Frozen Products Market Size and Growth Forecast 2026-2030
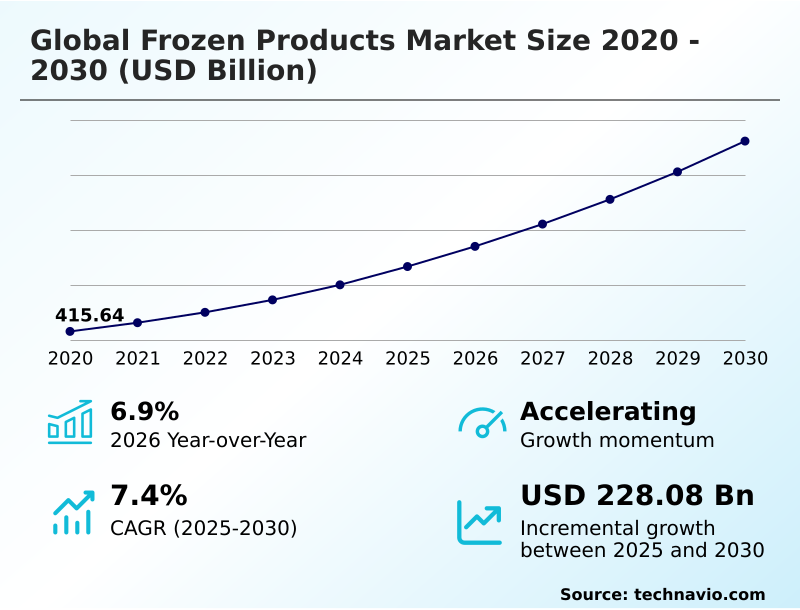
The Frozen Products Market size was valued at USD 533.57 billion in 2025 growing at a CAGR of 7.4% during the forecast period 2026-2030.
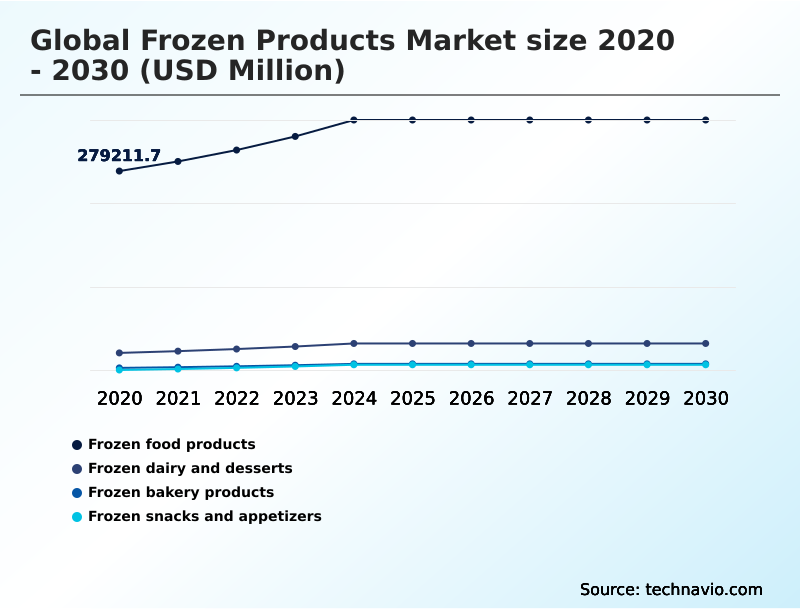
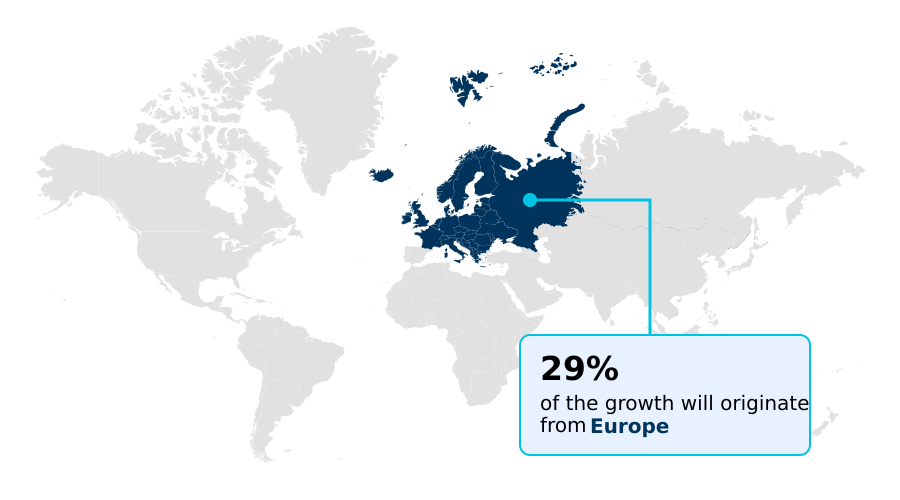
Europe accounts for 29.4% of incremental growth during the forecast period. The Frozen food products segment by Product was valued at USD 341.18 billion in 2024, while the Households and individual segment holds the largest revenue share by End-user.
The market is projected to grow by USD 346.01 billion from 2020 to 2030, with USD 228.08 billion of the growth expected during the forecast period of 2025 to 2030.
Get Key Insights on Market Forecast (PDF) Request Free Sample
Frozen Products Market Overview
The frozen products market is defined by its reliance on sophisticated cold chain logistics to ensure product integrity from production to consumption, with the market showing a steady 6.9% year-over-year growth. This expansion is fueled by innovations in preservation, such as individual quick freezing, which are critical for shelf life extension and maintaining quality. Within a modern food processing facility, the deployment of cryogenic freezing for high-value items like seafood or delicate fruits results in superior nutrient retention and texture, directly addressing consumer concerns about quality. This technological focus enables manufacturers to offer a wider array of premium frozen offerings, including complex ready-to-eat meals and plant-based proteins, thereby broadening market appeal. The continuous optimization of the entire temperature-controlled logistics network is essential for meeting stringent food safety compliance standards and satisfying the demand for high-quality, convenient food solutions worldwide.
Drivers, Trends, and Challenges in the Frozen Products Market
Strategic development in the global frozen products market is heavily influenced by the need to balance innovation with regulatory compliance. Adherence to protocols like the Food Safety Modernization Act (FSMA) in the US is a significant driver for adopting advanced technologies.
For instance, implementing blockchain for cold chain traceability within a multi-site frozen vegetable processing operation not only meets FSMA's record-keeping requirements but also directly addresses consumer trust in frozen food safety. This technology can reduce the time for a recall audit from days to minutes, a crucial improvement in operational efficiency.
Furthermore, the industry is actively exploring ai for personalized frozen meal plans, responding to nuanced consumer health demands. Efforts to reduce energy consumption in the cold chain are critical for improving margins, especially as energy costs in some regions are more than double those in others.
Success hinges on a company's ability to integrate these technological advancements, from developing frozen plant-based seafood to optimizing last-mile frozen delivery, while navigating the complex challenges of sustainability in frozen food packaging.
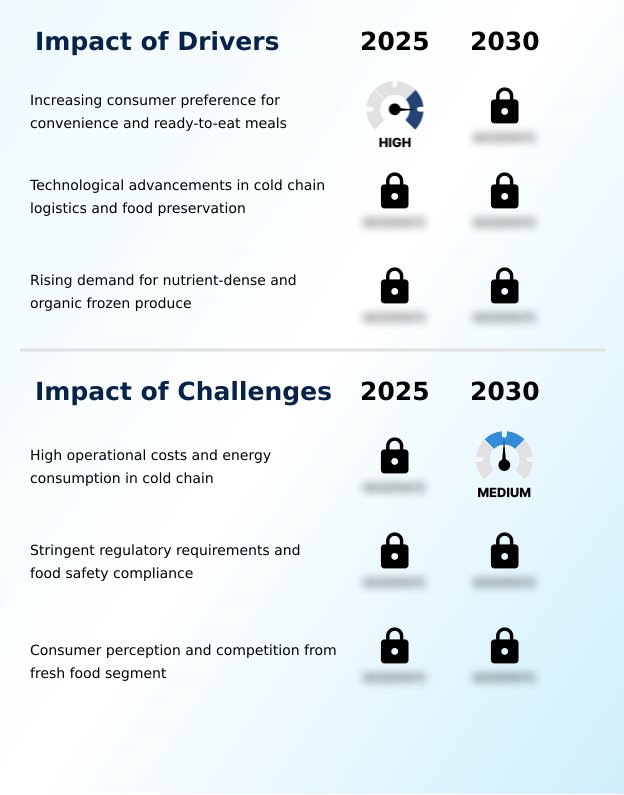
Primary Growth Driver: The market's growth is primarily driven by an increasing consumer preference for convenience and ready-to-eat meals that fit modern, time-constrained lifestyles.
Market growth is propelled by a confluence of lifestyle shifts and technological advancements. The primary driver remains convenience-driven food choices, as evidenced by the household and individual segment accounting for over 59% of consumption.
This demand is met by technological breakthroughs, particularly in flash-freezing technology and individual quick freezing (IQF), which preserve nutritional value and texture, directly addressing negative frozen food quality perception.
Furthermore, a surge in consumer health consciousness has expanded the market for organic, non-GMO, and plant-based protein options, turning the frozen aisle into a destination for health-focused shoppers.
This convergence of demand for convenience, quality, and health is a powerful catalyst for innovation.
Emerging Market Trend: The proliferation of hybrid protein products and novel meat substitutes marks a significant trend, reshaping the composition of frozen meals to meet evolving consumer dietary preferences.
Key trends are reshaping the frozen products market, moving beyond basic convenience to embrace sophisticated dietary and ethical demands. The integration of hybrid proteins and advanced meat analogues is becoming standard, catering to a growing flexitarian consumer base.
This is coupled with a push for radical supply chain transparency, where technologies like blockchain provide immutable records of a product's journey, enhancing food traceability technology. Concurrently, the use of AI is enabling hyper-personalized nutrition through modular meal systems and direct-to-consumer subscription models.
This shift from mass production to customized, data-driven offerings is creating new value streams and compelling incumbents to invest in digital transformation to remain competitive.
Key Industry Challenge: High operational costs and substantial energy consumption associated with maintaining the cold chain present a key challenge to the industry's profitability and growth.
The market faces significant structural challenges that constrain growth and profitability. The high operational costs tied to cold chain energy consumption remain a primary hurdle, making the industry vulnerable to volatile energy prices and compelling investment in energy-efficient refrigeration.
Concurrently, navigating the complex and fragmented landscape of global food safety compliance, with stringent regulations from bodies like the FDA and EFSA, demands substantial investment in quality control and documentation. Perhaps the most persistent challenge is the negative frozen food quality perception among some consumer segments, who still favor fresh alternatives.
Overcoming this requires continuous innovation in nutrient retention and transparent marketing to build consumer trust in frozen food safety.
Explore Full Market Dynamics Analysis Request Free Sample
Frozen Products Market Segmentation
The frozen products industry research report provides comprehensive data including region-wise segment analysis, with forecasts and analysis for the period 2026-2030, as well as historical data from 2020-2024 for the following segments.
Product Segment Analysis
The frozen food products segment is estimated to witness significant growth during the forecast period.
The frozen food products segment, representing a substantial portion of the market, is driven by the demand for convenience and nutritional integrity. Innovations in flash-freezing technology are pivotal, ensuring high nutrient retention in items from vegetables to complete ready-to-eat meals.
This addresses the growing consumer demand for clean-label products that align with health-conscious lifestyles.
The segment's expansion is further supported by the proliferation of diverse offerings, including a wide variety of plant-based proteins and specialized items designed for preparation in air fryers.
These developments cater to households seeking to reduce food waste while maintaining access to high-quality, easily prepared food, reflecting a fundamental shift in home cooking and meal planning strategies.
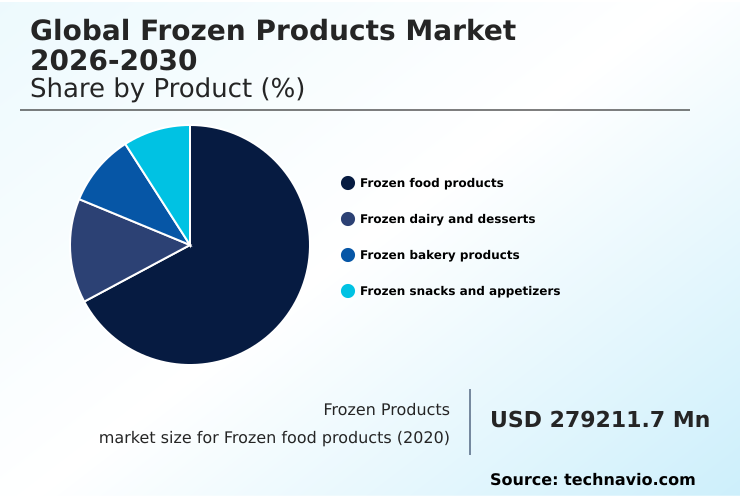
The Frozen food products segment was valued at USD 341.18 billion in 2024 and showed a gradual increase during the forecast period.
Frozen Products Market by Region: Europe Leads with 29.4% Growth Share
Europe is estimated to contribute 29.4% to the growth of the global market during the forecast period.
The geographic landscape of the frozen products market is characterized by mature, high-value markets in North America and Europe, contrasted with rapid expansion in the APAC region, which is projected to grow at a rate of 8.9%.
In APAC, massive investment in temperature-controlled logistics and automated warehouse systems is unlocking market potential, making a wider array of products accessible.
Europe, which accounts for over 29% of the incremental growth, focuses on regulatory standard harmonization and sustainability, pushing for energy-efficient refrigeration and eco-friendly packaging. Meanwhile, North America leads in the adoption of direct-to-consumer subscription models.
This global divergence requires adaptable strategies that balance technological deployment with regional consumer preferences and regulatory demands for supply chain transparency.
Customer Landscape Analysis for the Frozen Products Market
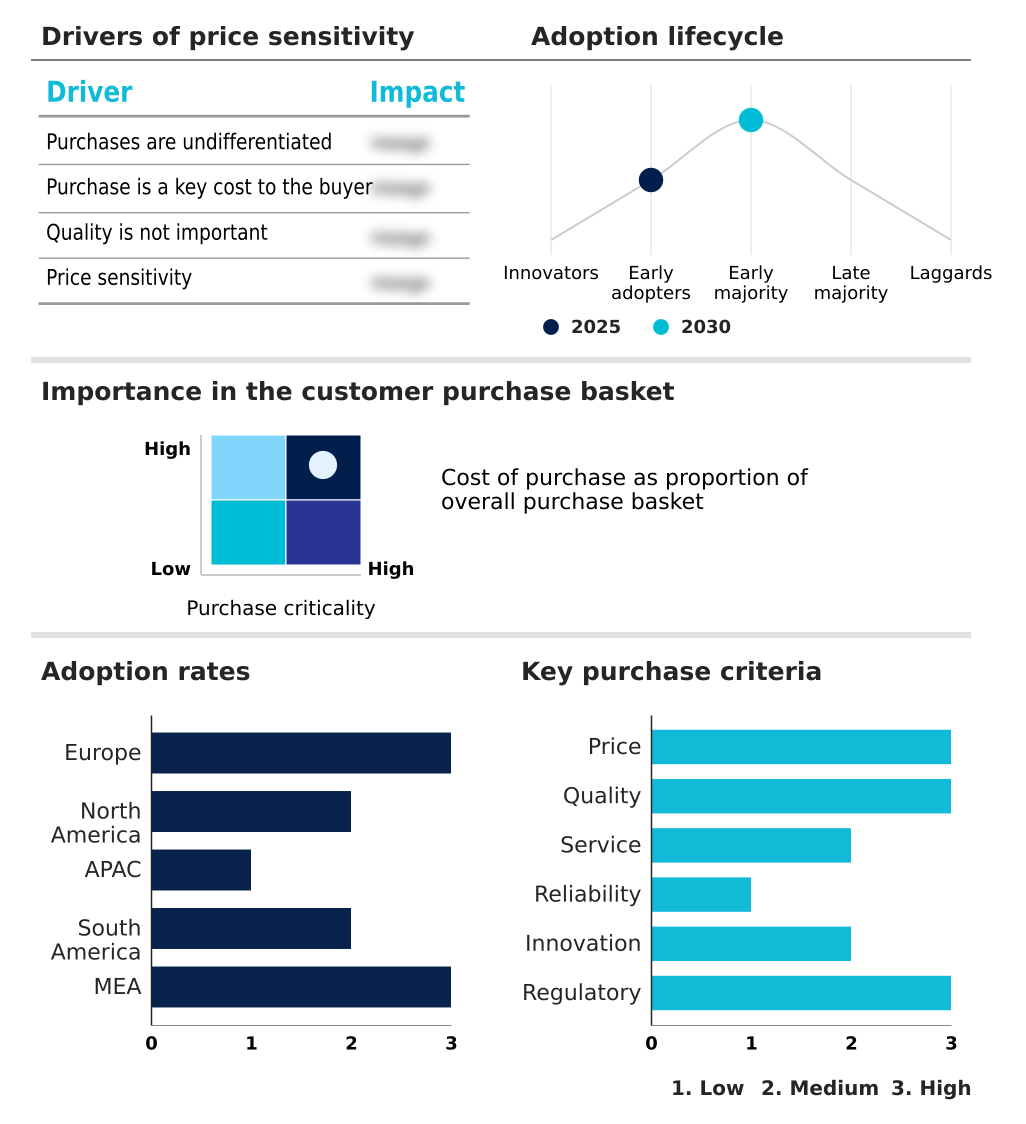
The frozen products market forecasting report includes the adoption lifecycle of the market, covering from the innovator’s stage to the laggard’s stage. It focuses on adoption rates in different regions based on penetration. Furthermore, the frozen products market report also includes key purchase criteria and drivers of price sensitivity to help companies evaluate and develop their market growth analysis strategies.
Competitive Landscape of the Frozen Products Market
Companies are implementing various strategies, such as strategic alliances, partnerships, mergers and acquisitions, geographical expansion, and product/service launches, to enhance their presence in the frozen products market industry.
Ajinomoto Co. Inc. - Key offerings focus on providing a diverse range of convenient, nutrient-preserving frozen foods, leveraging advanced preservation technologies to meet modern consumer demands for quality and taste.
The industry research and growth report includes detailed analyses of the competitive landscape of the market and information about key companies, including:
- Ajinomoto Co. Inc.
- Associated British Foods Plc
- Bellisio Foods Inc.
- CJ CheilJedang Corp.
- Conagra Brands Inc.
- Dr. August Oetker KG
- FRoSTA AG
- General Mills Inc.
- Goya Foods Inc.
- Hormel Foods Corp.
- Kellanova
- Lamb Weston Holdings Inc
- McCain Foods Ltd.
- Nestle SA
- Nichirei Corp.
- Nomad Foods Ltd.
- Rich Products Corp.
- The Kraft Heinz Co.
- Tyson Foods Inc.
- Unilever PLC
Qualitative and quantitative analysis of companies has been conducted to help clients understand the wider business environment as well as the strengths and weaknesses of key industry players. Data is qualitatively analyzed to categorize companies as pure play, category-focused, industry-focused, and diversified; it is quantitatively analyzed to categorize companies as dominant, leading, strong, tentative, and weak.
Recent Developments in the Frozen Products Market
- In March 2025, Westbridge Foods broadened its frozen ready-meal selection by introducing a new Thai cuisine line under its Kitchen Joy brand to cater to growing demand for ethnic flavors.
- In May 2025, ITC Limited invested approximately USD 14 million to acquire a 43.8% stake in Prasuma, a premium brand in India specializing in frozen Asian foods like momos and dumplings.
- In July 2025, McCain Foods announced an investment of approximately USD 400 million to build a new frozen potato processing facility in India, significantly expanding its manufacturing capacity in the region.
- In September 2025, the plant-based food brand BOSH, in collaboration with Tesco, launched a new range of frozen vegan ready meals in the United Kingdom, including tofu tikka masala and vegan lasagne.
Research Analyst Overview: Frozen Products Market
The operational core of the frozen products market is its sophisticated cold chain logistics, which is undergoing significant transformation due to technological and consumer pressures. Boardroom decisions are increasingly focused on balancing the high capital expenditure of energy-efficient refrigeration and automated warehouse systems against the long-term gains in operational efficiency and food safety compliance.
The rising demand for plant-based proteins and clean-label products is forcing a strategic pivot in R&D and supply chain sourcing to ensure traceability and quality, directly impacting vendor qualification criteria under frameworks like the Global Food Safety Initiative (GFSI).
With Europe contributing nearly 30% of the market's incremental growth, manufacturers must align with the region's stringent sustainability goals, including the adoption of sustainable packaging materials and innovations in flash-freezing technology to enhance nutrient retention and reduce waste.
Dive into Technavio’s robust research methodology, blending expert interviews, extensive data synthesis, and validated models for unparalleled Frozen Products Market insights. See full methodology.
| Market Scope | |
|---|---|
| Page number | 306 |
| Base year | 2025 |
| Historic period | 2020-2024 |
| Forecast period | 2026-2030 |
| Growth momentum & CAGR | Accelerate at a CAGR of 7.4% |
| Market growth 2026-2030 | USD 228081.0 million |
| Market structure | Fragmented |
| YoY growth 2025-2026(%) | 6.9% |
| Key countries | Germany, UK, France, Italy, Spain, The Netherlands, US, Canada, Mexico, China, Japan, India, South Korea, Australia, Indonesia, Brazil, Argentina, Colombia, Saudi Arabia, UAE, South Africa, Israel and Turkey |
| Competitive landscape | Leading Companies, Market Positioning of Companies, Competitive Strategies, and Industry Risks |
Frozen Products Market: Key Questions Answered in This Report
-
What is the expected growth of the Frozen Products Market between 2026 and 2030?
-
The Frozen Products Market is expected to grow by USD 228.08 billion during 2026-2030, registering a CAGR of 7.4%. Year-over-year growth in 2026 is estimated at 6.9%%. This acceleration is shaped by increasing consumer preference for convenience and ready-to-eat meals, which is intensifying demand across multiple end-use verticals covered in the report.
-
-
What segmentation does the market report cover?
-
The report is segmented by Product (Frozen food products, Frozen dairy and desserts, Frozen bakery products, and Frozen snacks and appetizers), End-user (Households and individual, Hotels and hospitality, and Restaurants and catering services), Distribution Channel (Offline, and Online) and Geography (Europe, North America, APAC, South America, Middle East and Africa). Among these, the Frozen food products segment is estimated to witness significant growth during the forecast period, driven by rising adoption across key application areas. Each segment includes detailed qualitative and quantitative analysis, along with historical data from 2020-2024 and forecasts through 2030 with year-over-year growth rates.
-
-
Which regions are analyzed in the report?
-
The report covers Europe, North America, APAC, South America and Middle East and Africa. Europe is estimated to contribute 29.4% to market growth during the forecast period. Country-level analysis includes Germany, UK, France, Italy, Spain, The Netherlands, US, Canada, Mexico, China, Japan, India, South Korea, Australia, Indonesia, Brazil, Argentina, Colombia, Saudi Arabia, UAE, South Africa, Israel and Turkey, with dedicated market size tables and year-over-year growth for each.
-
-
What are the key growth drivers and market challenges?
-
The primary driver is increasing consumer preference for convenience and ready-to-eat meals, which is accelerating investment and industry demand. The main challenge is high operational costs and energy consumption in cold chain, creating operational barriers for key market participants. The report quantifies the impact of each driver and challenge across 2026 and 2030 with comparative analysis.
-
-
Who are the major players in the Frozen Products Market?
-
Key vendors include Ajinomoto Co. Inc., Associated British Foods Plc, Bellisio Foods Inc., CJ CheilJedang Corp., Conagra Brands Inc., Dr. August Oetker KG, FRoSTA AG, General Mills Inc., Goya Foods Inc., Hormel Foods Corp., Kellanova, Lamb Weston Holdings Inc, McCain Foods Ltd., Nestle SA, Nichirei Corp., Nomad Foods Ltd., Rich Products Corp., The Kraft Heinz Co., Tyson Foods Inc. and Unilever PLC. The report provides qualitative and quantitative analysis categorizing companies as dominant, leading, strong, tentative, and weak based on their market positioning. Company profiles include business segment analysis, SWOT assessment, key offerings, and recent strategic developments.
-
Frozen Products Market Research Insights
Market dynamics are increasingly shaped by convenience-driven food choices balanced against rising consumer health consciousness. While the household segment remains the largest end-user, the foodservice portion control needs of the hospitality sector are driving significant innovation. Adherence to standards from bodies like the European Food Safety Authority necessitates investments in advanced food traceability technology and transparent sourcing.
For instance, a commercial kitchen supplier integrating blockchain-based tracking for its frozen seafood can provide verifiable proof of origin and handling, thereby building trust with restaurant clients. This move toward enhanced supply chain transparency is becoming a key differentiator, influencing procurement decisions beyond mere price considerations.
We can help! Our analysts can customize this frozen products market research report to meet your requirements.
 RIA -
RIA - 
