Fruit-flavored Soft Drinks Market Analysis, Size, and Forecast 2026-2030: North America (US, Canada, and Mexico), Europe (Germany, UK, and France), APAC (China, India, and Japan), South America (Brazil and Argentina), Middle East and Africa (South Africa, UAE, and Saudi Arabia), and Rest of World (ROW)

Fruit-flavored Soft Drinks Market Analysis, Size, and Forecast 2026-2030:
North America (US, Canada, and Mexico), Europe (Germany, UK, and France), APAC (China, India, and Japan), South America (Brazil and Argentina), Middle East and Africa (South Africa, UAE, and Saudi Arabia), and Rest of World (ROW)

Published: Mar 2026 294 Pages SKU: IRTNTR72929

Market Overview at a Glance

$28.62 B
Market Opportunity
5.1%
CAGR 2025 - 2030
34.4%
Europe Growth
$53.38 B
FFCSD segment 2024

Fruit-flavored Soft Drinks Market Size 2026-2030

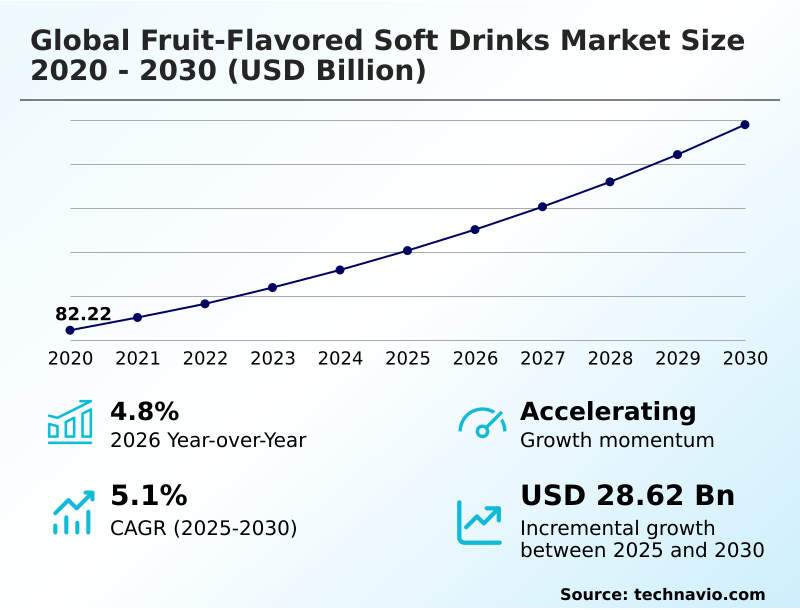
The fruit-flavored soft drinks market size is valued to increase by USD 28.62 billion, at a CAGR of 5.1% from 2025 to 2030. Rising demand for functional wellness and nutrient-dense formulations will drive the fruit-flavored soft drinks market.

Major Market Trends & Insights

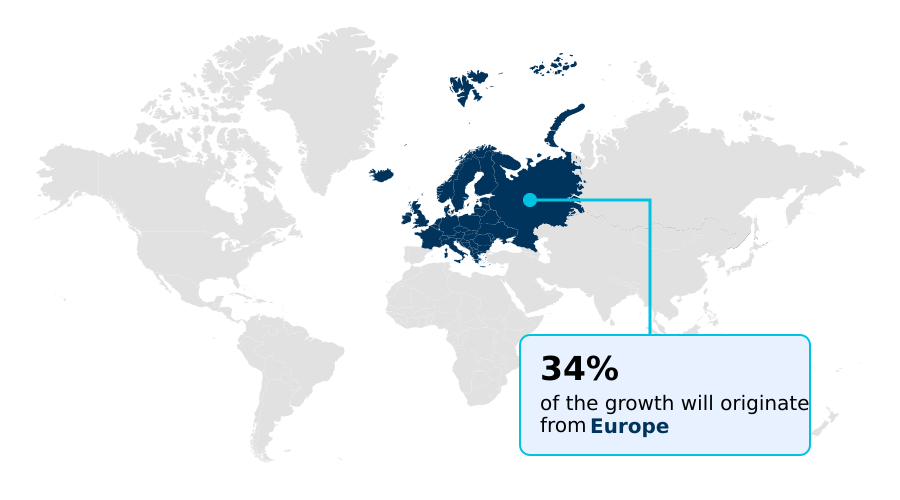
  • Europe dominated the market and accounted for a 34.4% growth during the forecast period.
  • By Type - FFCSD segment was valued at USD 53.38 billion in 2024
  • By Distribution Channel - Supermarkets or hypermarkets segment accounted for the largest market revenue share in 2024

Market Size & Forecast

  • Market Opportunities: USD 46.73 billion
  • Market Future Opportunities: USD 28.62 billion
  • CAGR from 2025 to 2030 : 5.1%

Market Summary

  • The Fruit-flavored Soft Drinks Market is experiencing a structural transformation, moving from traditional indulgence toward functional wellness and value-added hydration. This evolution is propelled by heightened consumer health awareness, leading to a demand for beverages with tangible nutritional benefits beyond simple refreshment. Manufacturers are aggressively reformulating portfolios to lower sugar content while incorporating natural ingredients like vitamins, adaptogens, and fiber.
  • This strategic pivot addresses a demographic that views beverage consumption as part of a holistic health regimen. For instance, a beverage company might overhaul its portfolio, discontinuing underperforming high-sugar variants to focus R&D on developing a new line of zero-sugar, fruit-flavored seltzers with added electrolytes and antioxidants.
  • This move not only aligns with consumer trends but also mitigates risks from potential sugar taxes, future-proofing the brand. The competitive landscape is shifting as legacy brands innovate to counter agile, health-centric competitors, emphasizing portfolio diversification and premiumization to align with modern dietary trends, including the rise of weight-management medications.

What will be the Size of the Fruit-flavored Soft Drinks Market during the forecast period?

Get Key Insights on Market Forecast (PDF) Request Free Sample

How is the Fruit-flavored Soft Drinks Market Segmented?

The fruit-flavored soft drinks industry research report provides comprehensive data (region-wise segment analysis), with forecasts and estimates in "USD million" for the period 2026-2030, as well as historical data from 2020-2024 for the following segments.

  • Type
    • FFCSD
    • FFNCSD
  • Distribution channel
    • Supermarkets or hypermarkets
    • Convenience stores
    • Online retail stores
  • Packaging
    • Bottles
    • Cans
    • Tetra packs
  • Geography
    • North America
      • US
      • Canada
      • Mexico
    • Europe
      • Germany
      • UK
      • France
    • APAC
      • China
      • India
      • Japan
    • South America
      • Brazil
      • Argentina
    • Middle East and Africa
      • South Africa
      • UAE
      • Saudi Arabia
    • Rest of World (ROW)

By Type Insights

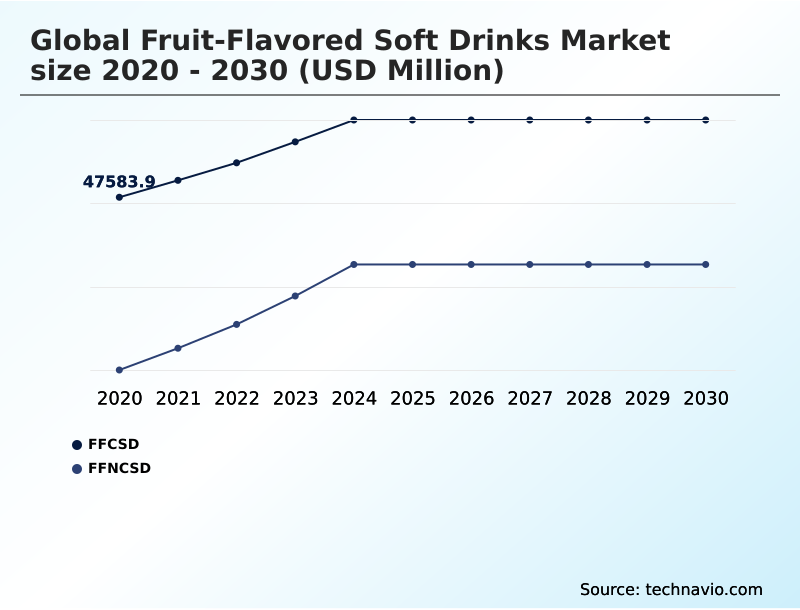
The ffcsd segment is estimated to witness significant growth during the forecast period.

The fruit-flavored carbonated soft drinks segment is transforming, driven by a pivot toward premiumization and cleaner formulations. Brands are integrating natural fruit extracts and reducing reliance on high-fructose corn syrup to meet evolving dietary standards.

This shift addresses the value-sustainability gap by appealing to health-conscious consumers. Innovations in carbonation levels and botanical infusions create complex, adult-oriented palates.

This focus on imaginative taste adventures and sophisticated flavor profiles is reshaping a category once defined by simple refreshment.

The strategic adoption of sustainable packaging, such as aluminum, has contributed to a more than 4% increase in shipments for some suppliers, aligning products with eco-essence seekers.

This evolution, using non-nutritive sweeteners and dairy-free creamers, caters to a demand for advanced circular packaging.

Request Free Sample

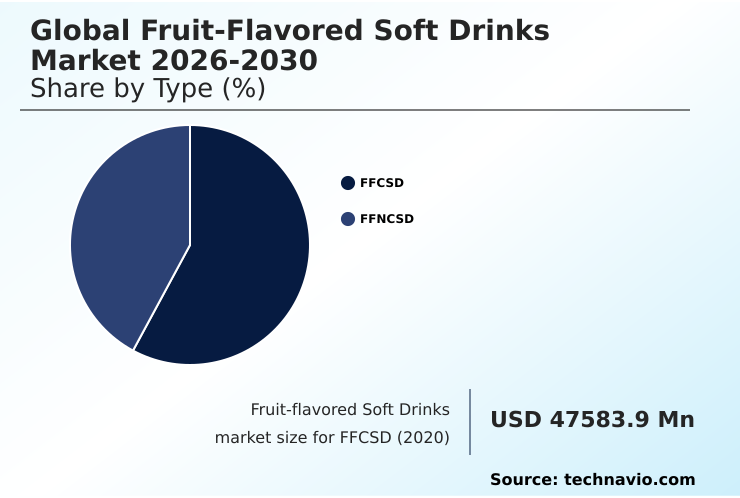
The FFCSD segment was valued at USD 53.38 billion in 2024 and showed a gradual increase during the forecast period.

Request Free Sample

Regional Analysis

Europe is estimated to contribute 34.4% to the growth of the global market during the forecast period.Technavio’s analysts have elaborately explained the regional trends and drivers that shape the market during the forecast period.

See How Fruit-flavored Soft Drinks Market Demand is Rising in Europe Request Free Sample

The geographic landscape of the fruit-flavored soft drinks market is defined by varying regional responses to global health and sustainability mandates.

In developed regions like North America and Europe, the focus is on premiumization and functional wellness beverages, leading to the rise of prebiotic sodas. Here, heightened sustainability mandates drive innovation in circular packaging systems.

For instance, efforts to improve the recyclability of PET have led some firms to target a 2% annual reduction in virgin plastic use.

In contrast, emerging markets in APAC and South America balance affordability with aspirational health trends, driving demand for both value formats and novel fruit-flavored non-carbonated soft drinks.

This complex environment, shaped by a mindful drinking culture and food safety enforcement, requires adaptable strategies for managing global fruit-sourcing vulnerabilities and diverse consumer expectations.

Market Dynamics

Our researchers analyzed the data with 2025 as the base year, along with the key drivers, trends, and challenges. A holistic analysis of drivers will help companies refine their marketing strategies to gain a competitive advantage.

  • The global fruit-flavored soft drinks market 2026-2030 is navigating a complex landscape where consumer preference for natural ingredients intersects with the need for cost-effective production. Innovations in zero sugar soda and the broader use of non-nutritive sweeteners are standard, addressing both health concerns and regulatory pressures.
  • The trend toward nootropic drinks for cognitive function and prebiotic soda gut health benefits signals a market shift toward functional beverages. This evolution requires sophisticated supply chain management for fruit concentrates, especially for exotic fruit flavors. Plant based soft drink options and dairy-free creamy soda formulations cater to niche but growing dietary preferences.
  • Concurrently, sustainability in beverage packaging is paramount, with advancements in aseptic packaging for fruit drinks and advanced circular packaging solutions becoming key differentiators. Some companies have streamlined portfolios by over 15% to improve supply chain efficiency and focus on high-growth segments.
  • Manufacturing processes like cold press juice manufacturing and high pressure processing (HPP) are adopted to preserve the nutritional value in low calorie fruit flavored drinks, justifying premium price points. The impact of regulation on sodas and sugar reduction in soft drinks continues to shape product development.
  • As brands explore upcycled ingredients in beverages and publicize their beverage packaging sustainability goals, managing beverage production costs remains a critical challenge for long-term viability.

What are the key market drivers leading to the rise in the adoption of Fruit-flavored Soft Drinks Industry?

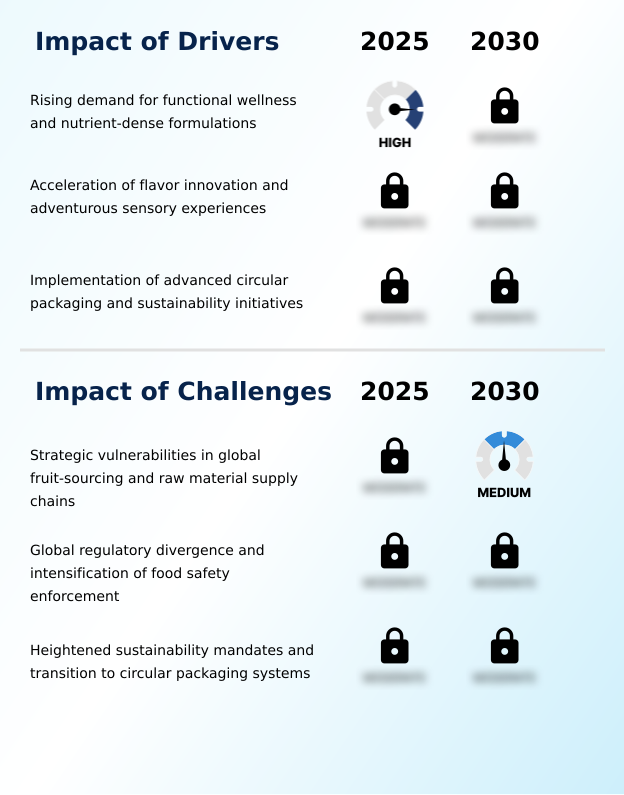
  • A key driver for the market is the rising demand for functional wellness and nutrient-dense formulations.

  • Market growth is propelled by a consumer-led push for functional wellness beverages and nutrient-dense formulations. The demand for products supporting holistic well-being goals is encouraging the integration of bioactive ingredients, including adaptogens and probiotics.
  • This focus on health has led to a 20% increase in R&D spending on zero-sugar formulations for some leading brands.
  • Flavor innovation is another significant driver, with consumers seeking imaginative taste adventures through swavory flavor mashups, botanical infusions, and heat-forward fruit blends.
  • Sustainability has become a core driver, with the adoption of advanced circular packaging and a zero-waste production model appealing to eco-essence seekers.
  • This shift is reshaping supply chains, with some companies reporting a 10% improvement in material efficiency by using upcycled fruit side-streams.

What are the market trends shaping the Fruit-flavored Soft Drinks Industry?

  • The proliferation of functional fruit hybrids and nootropic infusions is a significant upcoming market trend. This shift reflects growing consumer demand for beverages that offer cognitive and wellness benefits.

  • Key market trends are redefining product development, focusing on functional benefits and novel sensory experiences. The rise of functional fruit hybrids and beverages with nootropic beverage infusions highlights a shift toward cognitive performance enhancement.
  • This movement away from traditional sugary drinks is creating demand for gut-friendly fruit sodas and other emotional well-being drinks, which has led to operational efficiency gains of up to 15% in production lines geared for smaller, specialized batches. The mixed soda phenomenon, driven by social media, has prompted the creation of shelf-stable creamy-fruit fusion profiles and nostalgic indulgent flavors.
  • Innovations in dairy-free creamers are enabling this trend. Additionally, the emphasis on a mindful drinking culture is driving hyper-local sourcing and the use of upcycled fruit ingredients, aligning with consumer demand for transparency and sustainability.

What challenges does the Fruit-flavored Soft Drinks Industry face during its growth?

  • A key challenge affecting industry growth involves strategic vulnerabilities in global fruit-sourcing and raw material supply chains.

  • The market faces significant challenges related to supply chain stability, regulatory complexity, and sustainability mandates. Strategic global fruit-sourcing vulnerabilities, exacerbated by climate events, have led to double-digit percentage decreases in key fruit harvests, disrupting raw material supply chains.
  • Evolving regulatory landscapes, with stricter food safety enforcement and divergent labeling laws, complicate global operations and can increase compliance costs by over 25% for multinational corporations. The transition to circular packaging systems to meet heightened sustainability mandates presents another hurdle.
  • While consumer demand for eco-friendly packaging is high, bridging the value-sustainability gap without sacrificing convenience remains a challenge, particularly with the rising cost of recycled polyethylene terephthalate (rPET) and the investment needed for Extended Producer Responsibility laws.

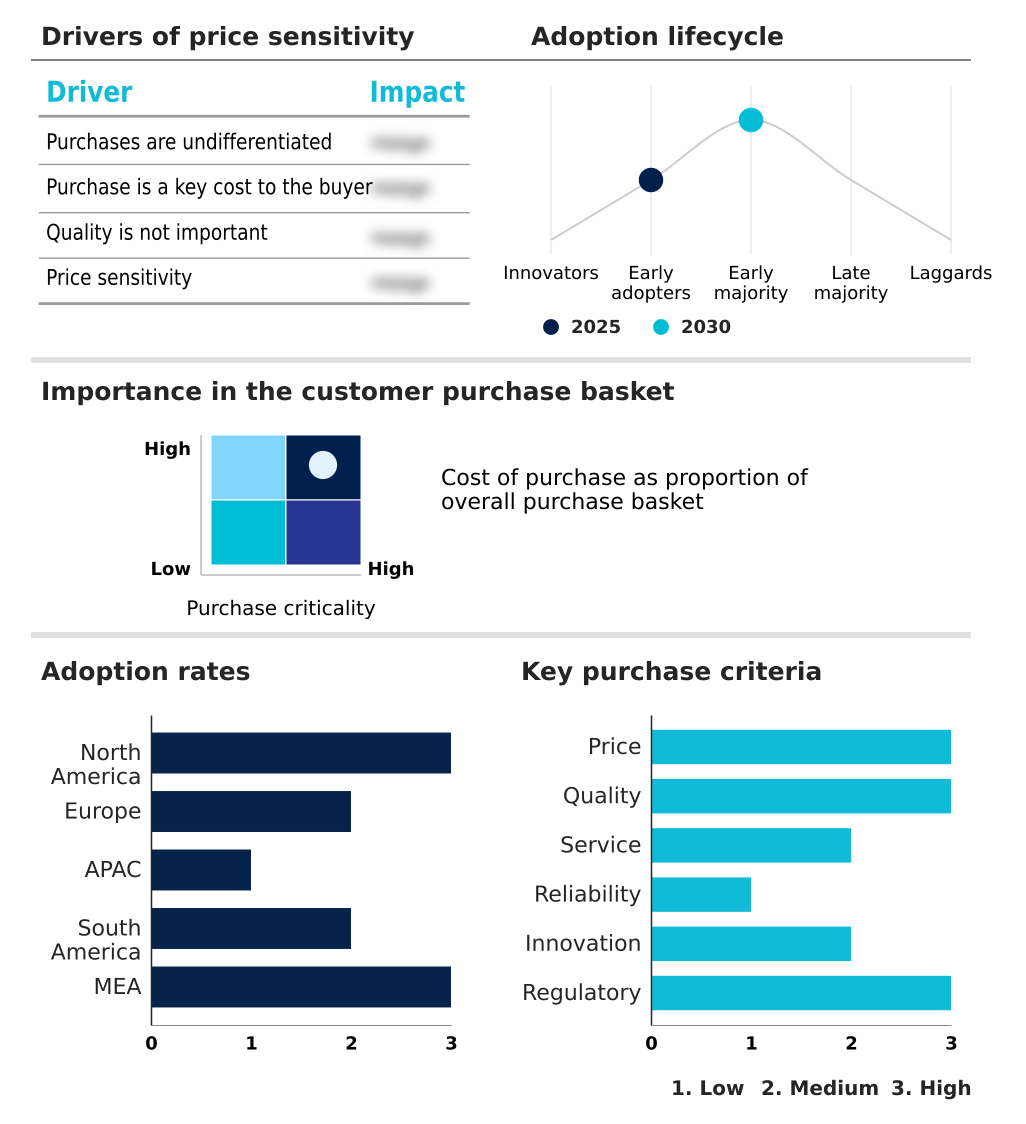
Exclusive Technavio Analysis on Customer Landscape

The fruit-flavored soft drinks market forecasting report includes the adoption lifecycle of the market, covering from the innovator’s stage to the laggard’s stage. It focuses on adoption rates in different regions based on penetration. Furthermore, the fruit-flavored soft drinks market report also includes key purchase criteria and drivers of price sensitivity to help companies evaluate and develop their market growth analysis strategies.

Customer Landscape of Fruit-flavored Soft Drinks Industry

Competitive Landscape

Companies are implementing various strategies, such as strategic alliances, fruit-flavored soft drinks market forecast, partnerships, mergers and acquisitions, geographical expansion, and product/service launches, to enhance their presence in the industry.

Asahi Group Holdings Ltd. - A diversified portfolio of fruit-flavored soft drinks is offered, catering to consumer preferences for both traditional and innovative taste profiles.

The industry research and growth report includes detailed analyses of the competitive landscape of the market and information about key companies, including:

  • Asahi Group Holdings Ltd.
  • Bundaberg Brewed Drinks
  • Danone SA
  • Harvest Hill Beverage Co.
  • ITO EN Ltd.
  • Keurig Dr Pepper Inc.
  • Kirin Holdings Co. Ltd.
  • Monster Beverage Corp.
  • National Beverage Corp.
  • Nestle SA
  • Ocean Spray Cranberries Inc.
  • PepsiCo Inc.
  • Polar Beverages
  • Red Bull GmbH
  • Refresco Group BV
  • Spindrift Beverage Co.
  • Suntory Beverage and Food Ltd.
  • Talking Rain Beverage Co.
  • The Coca Cola Co.
  • The Kraft Heinz Co.

Qualitative and quantitative analysis of companies has been conducted to help clients understand the wider business environment as well as the strengths and weaknesses of key industry players. Data is qualitatively analyzed to categorize companies as pure play, category-focused, industry-focused, and diversified; it is quantitatively analyzed to categorize companies as dominant, leading, strong, tentative, and weak.

Recent Development and News in Fruit-flavored soft drinks market

  • In May 2025, PepsiCo announced a strategic revision of its packaging sustainability goals, aiming to reduce virgin plastic usage by 2% annually to address market realities and external challenges.
  • In April 2025, Tropicana introduced its Fresh + Light range in the UK, a line of fruit juices with 40% less sugar and no artificial sweeteners to meet health expectations.
  • In February 2025, Keurig Dr Pepper launched Dr Pepper Blackberry nationally, merging its classic flavor profile with blackberry to capitalize on the growth of berry-flavored carbonated drinks.
  • In February 2025, The Coca-Cola Co. entered the prebiotic soda category with its Simply Pop brand, featuring fruit-flavored sodas formulated with real fruit juice and prebiotic fiber.

Dive into Technavio’s robust research methodology, blending expert interviews, extensive data synthesis, and validated models for unparalleled Fruit-flavored Soft Drinks Market insights. See full methodology.

Market Scope
Page number 294
Base year 2025
Historic period 2020-2024
Forecast period 2026-2030
Growth momentum & CAGR Accelerate at a CAGR of 5.1%
Market growth 2026-2030 USD 28621.5 million
Market structure Fragmented
YoY growth 2025-2026(%) 4.8%
Key countries US, Canada, Mexico, Germany, UK, France, Italy, Russia, Spain, China, India, Japan, South Korea, Australia, Indonesia, Brazil, Argentina, Chile, South Africa, UAE, Saudi Arabia, Egypt and Nigeria
Competitive landscape Leading Companies, Market Positioning of Companies, Competitive Strategies, and Industry Risks

Request Free Sample

Research Analyst Overview

  • The fruit-flavored soft drinks market is undergoing a significant strategic realignment, pivoting from high-volume, sugar-based models to value-driven, functional beverage ecosystems. This shift is a direct response to consumer demand for healthier options, driving the proliferation of fruit-flavored carbonated soft drinks and non-carbonated variants featuring bioactive ingredients. The integration of adaptogens and probiotics into zero-sugar formulations is becoming mainstream.
  • Boardroom decisions are increasingly centered on reformulating product lines with high-pulp content beverages and gut-friendly fruit sodas, often utilizing cold-press technology to preserve nutritional integrity. The rise of swavory flavor mashups and heat-forward fruit blends indicates a sophisticated approach to flavor innovation.
  • A key operational metric shows that the industry-wide move to sustainable packaging like aluminum has supported a more than 4% increase in shipments for some packaging suppliers. This focus on sustainability extends to using upcycled fruit ingredients and side-streams, developing functional fruit hybrids with nootropic beverage infusions, and creating prebiotic sodas.
  • The use of high-pressure processing (HPP) and fiber-based barriers in aseptic technology packaging also highlights a commitment to quality and environmental responsibility.

What are the Key Data Covered in this Fruit-flavored Soft Drinks Market Research and Growth Report?

  • What is the expected growth of the Fruit-flavored Soft Drinks Market between 2026 and 2030?

    • USD 28.62 billion, at a CAGR of 5.1%

  • What segmentation does the market report cover?

    • The report is segmented by Type (FFCSD, and FFNCSD), Distribution Channel (Supermarkets or hypermarkets, Convenience stores, and Online retail stores), Packaging (Bottles, Cans, and Tetra packs) and Geography (North America, Europe, APAC, South America, Middle East and Africa)

  • Which regions are analyzed in the report?

    • North America, Europe, APAC, South America and Middle East and Africa

  • What are the key growth drivers and market challenges?

    • Rising demand for functional wellness and nutrient-dense formulations, Strategic vulnerabilities in global fruit-sourcing and raw material supply chains

  • Who are the major players in the Fruit-flavored Soft Drinks Market?

    • Asahi Group Holdings Ltd., Bundaberg Brewed Drinks, Danone SA, Harvest Hill Beverage Co., ITO EN Ltd., Keurig Dr Pepper Inc., Kirin Holdings Co. Ltd., Monster Beverage Corp., National Beverage Corp., Nestle SA, Ocean Spray Cranberries Inc., PepsiCo Inc., Polar Beverages, Red Bull GmbH, Refresco Group BV, Spindrift Beverage Co., Suntory Beverage and Food Ltd., Talking Rain Beverage Co., The Coca Cola Co. and The Kraft Heinz Co.

Market Research Insights

  • The market's dynamics are shaped by a pronounced shift toward health-conscious consumption and sustainable practices. This transition is evident as companies streamline portfolios by up to 20% to enhance operating margins in response to inflationary pressures on raw material supply chains.
  • The adoption of advanced circular packaging and sustainable sourcing is a key differentiator, with some initiatives resulting in operational emission reductions exceeding 50%. This focus on a zero-waste production model appeals to eco-essence seekers and aligns with heightened sustainability mandates.
  • Furthermore, the move toward a circular economy and managing global fruit-sourcing vulnerabilities are central to long-term strategy, ensuring resilience against market volatility. These strategic adjustments reflect a deep understanding of consumer values and regulatory pressures.

We can help! Our analysts can customize this fruit-flavored soft drinks market research report to meet your requirements.

Get in touch

1. Executive Summary

1.1 Market overview

Executive Summary - Chart on Market Overview
Executive Summary - Data Table on Market Overview
Executive Summary - Chart on Global Market Characteristics
Executive Summary - Chart on Market by Geography
Executive Summary - Chart on Market Segmentation by Type
Executive Summary - Chart on Market Segmentation by Distribution Channel
Executive Summary - Chart on Market Segmentation by Packaging
Executive Summary - Chart on Incremental Growth
Executive Summary - Data Table on Incremental Growth
Executive Summary - Chart on Company Market Positioning

2. Technavio Analysis

2.1 Analysis of price sensitivity, lifecycle, customer purchase basket, adoption rates, and purchase criteria

2.2 Criticality of inputs and Factors of differentiation

Chart on Overview on criticality of inputs and factors of differentiation

2.3 Factors of disruption

Chart on Overview on factors of disruption

2.4 Impact of drivers and challenges

Chart on Impact of drivers and challenges in 2025 and 2030

3. Market Landscape

3.1 Market ecosystem

Chart on Parent Market
Data Table on - Parent Market

3.2 Market characteristics

Chart on Market characteristics analysis

3.3 Value chain analysis

Chart on Value chain analysis

4. Market Sizing

4.1 Market definition

Data Table on Offerings of companies included in the market definition

4.2 Market segment analysis

Market segments

4.3 Market size 2025

4.4 Market outlook: Forecast for 2025-2030

Chart on Global - Market size and forecast 2025-2030 ($ million)
Data Table on Global - Market size and forecast 2025-2030 ($ million)
Chart on Global Market: Year-over-year growth 2025-2030 (%)
Data Table on Global Market: Year-over-year growth 2025-2030 (%)

5. Historic Market Size

5.1 Global Fruit-Flavored Soft Drinks Market 2020 - 2024

Historic Market Size - Data Table on Global Fruit-Flavored Soft Drinks Market 2020 - 2024 ($ million)

5.2 Type segment analysis 2020 - 2024

Historic Market Size - Type Segment 2020 - 2024 ($ million)

5.3 Distribution Channel segment analysis 2020 - 2024

Historic Market Size - Distribution Channel Segment 2020 - 2024 ($ million)

5.4 Packaging segment analysis 2020 - 2024

Historic Market Size - Packaging Segment 2020 - 2024 ($ million)

5.5 Geography segment analysis 2020 - 2024

Historic Market Size - Geography Segment 2020 - 2024 ($ million)

5.6 Country segment analysis 2020 - 2024

Historic Market Size - Country Segment 2020 - 2024 ($ million)

6. Qualitative Analysis

6.1 Impact of AI on Global Fruit-Flavored Soft Drinks Market

7. Five Forces Analysis

7.1 Five forces summary

Five forces analysis - Comparison between 2025 and 2030

7.2 Bargaining power of buyers

Bargaining power of buyers - Impact of key factors 2025 and 2030

7.3 Bargaining power of suppliers

Bargaining power of suppliers - Impact of key factors in 2025 and 2030

7.4 Threat of new entrants

Threat of new entrants - Impact of key factors in 2025 and 2030

7.5 Threat of substitutes

Threat of substitutes - Impact of key factors in 2025 and 2030

7.6 Threat of rivalry

Threat of rivalry - Impact of key factors in 2025 and 2030

7.7 Market condition

Chart on Market condition - Five forces 2025 and 2030

8. Market Segmentation by Type

8.1 Market segments

Chart on Type - Market share 2025-2030 (%)
Data Table on Type - Market share 2025-2030 (%)

8.2 Comparison by Type

Chart on Comparison by Type
Data Table on Comparison by Type

8.3 FFCSD - Market size and forecast 2025-2030

Chart on FFCSD - Market size and forecast 2025-2030 ($ million)
Data Table on FFCSD - Market size and forecast 2025-2030 ($ million)
Chart on FFCSD - Year-over-year growth 2025-2030 (%)
Data Table on FFCSD - Year-over-year growth 2025-2030 (%)

8.4 FFNCSD - Market size and forecast 2025-2030

Chart on FFNCSD - Market size and forecast 2025-2030 ($ million)
Data Table on FFNCSD - Market size and forecast 2025-2030 ($ million)
Chart on FFNCSD - Year-over-year growth 2025-2030 (%)
Data Table on FFNCSD - Year-over-year growth 2025-2030 (%)

8.5 Market opportunity by Type

Market opportunity by Type ($ million)
Data Table on Market opportunity by Type ($ million)

9. Market Segmentation by Distribution Channel

9.1 Market segments

Chart on Distribution Channel - Market share 2025-2030 (%)
Data Table on Distribution Channel - Market share 2025-2030 (%)

9.2 Comparison by Distribution Channel

Chart on Comparison by Distribution Channel
Data Table on Comparison by Distribution Channel

9.3 Supermarkets or hypermarkets - Market size and forecast 2025-2030

Chart on Supermarkets or hypermarkets - Market size and forecast 2025-2030 ($ million)
Data Table on Supermarkets or hypermarkets - Market size and forecast 2025-2030 ($ million)
Chart on Supermarkets or hypermarkets - Year-over-year growth 2025-2030 (%)
Data Table on Supermarkets or hypermarkets - Year-over-year growth 2025-2030 (%)

9.4 Convenience stores - Market size and forecast 2025-2030

Chart on Convenience stores - Market size and forecast 2025-2030 ($ million)
Data Table on Convenience stores - Market size and forecast 2025-2030 ($ million)
Chart on Convenience stores - Year-over-year growth 2025-2030 (%)
Data Table on Convenience stores - Year-over-year growth 2025-2030 (%)

9.5 Online retail stores - Market size and forecast 2025-2030

Chart on Online retail stores - Market size and forecast 2025-2030 ($ million)
Data Table on Online retail stores - Market size and forecast 2025-2030 ($ million)
Chart on Online retail stores - Year-over-year growth 2025-2030 (%)
Data Table on Online retail stores - Year-over-year growth 2025-2030 (%)

9.6 Market opportunity by Distribution Channel

Market opportunity by Distribution Channel ($ million)
Data Table on Market opportunity by Distribution Channel ($ million)

10. Market Segmentation by Packaging

10.1 Market segments

Chart on Packaging - Market share 2025-2030 (%)
Data Table on Packaging - Market share 2025-2030 (%)

10.2 Comparison by Packaging

Chart on Comparison by Packaging
Data Table on Comparison by Packaging

10.3 Bottles - Market size and forecast 2025-2030

Chart on Bottles - Market size and forecast 2025-2030 ($ million)
Data Table on Bottles - Market size and forecast 2025-2030 ($ million)
Chart on Bottles - Year-over-year growth 2025-2030 (%)
Data Table on Bottles - Year-over-year growth 2025-2030 (%)

10.4 Cans - Market size and forecast 2025-2030

Chart on Cans - Market size and forecast 2025-2030 ($ million)
Data Table on Cans - Market size and forecast 2025-2030 ($ million)
Chart on Cans - Year-over-year growth 2025-2030 (%)
Data Table on Cans - Year-over-year growth 2025-2030 (%)

10.5 Tetra packs - Market size and forecast 2025-2030

Chart on Tetra packs - Market size and forecast 2025-2030 ($ million)
Data Table on Tetra packs - Market size and forecast 2025-2030 ($ million)
Chart on Tetra packs - Year-over-year growth 2025-2030 (%)
Data Table on Tetra packs - Year-over-year growth 2025-2030 (%)

10.6 Market opportunity by Packaging

Market opportunity by Packaging ($ million)
Data Table on Market opportunity by Packaging ($ million)

11. Customer Landscape

11.1 Customer landscape overview

Analysis of price sensitivity, lifecycle, customer purchase basket, adoption rates, and purchase criteria

12. Geographic Landscape

12.1 Geographic segmentation

Chart on Market share by geography 2025-2030 (%)
Data Table on Market share by geography 2025-2030 (%)

12.2 Geographic comparison

Chart on Geographic comparison
Data Table on Geographic comparison

12.3 North America - Market size and forecast 2025-2030

Chart on North America - Market size and forecast 2025-2030 ($ million)
Data Table on North America - Market size and forecast 2025-2030 ($ million)
Chart on North America - Year-over-year growth 2025-2030 (%)
Data Table on North America - Year-over-year growth 2025-2030 (%)
Chart on Regional Comparison - North America
Data Table on Regional Comparison - North America

12.3.1 US - Market size and forecast 2025-2030

Chart on US - Market size and forecast 2025-2030 ($ million)
Data Table on US - Market size and forecast 2025-2030 ($ million)
Chart on US - Year-over-year growth 2025-2030 (%)
Data Table on US - Year-over-year growth 2025-2030 (%)

12.3.2 Canada - Market size and forecast 2025-2030

Chart on Canada - Market size and forecast 2025-2030 ($ million)
Data Table on Canada - Market size and forecast 2025-2030 ($ million)
Chart on Canada - Year-over-year growth 2025-2030 (%)
Data Table on Canada - Year-over-year growth 2025-2030 (%)

12.3.3 Mexico - Market size and forecast 2025-2030

Chart on Mexico - Market size and forecast 2025-2030 ($ million)
Data Table on Mexico - Market size and forecast 2025-2030 ($ million)
Chart on Mexico - Year-over-year growth 2025-2030 (%)
Data Table on Mexico - Year-over-year growth 2025-2030 (%)

12.4 Europe - Market size and forecast 2025-2030

Chart on Europe - Market size and forecast 2025-2030 ($ million)
Data Table on Europe - Market size and forecast 2025-2030 ($ million)
Chart on Europe - Year-over-year growth 2025-2030 (%)
Data Table on Europe - Year-over-year growth 2025-2030 (%)
Chart on Regional Comparison - Europe
Data Table on Regional Comparison - Europe

12.4.1 Germany - Market size and forecast 2025-2030

Chart on Germany - Market size and forecast 2025-2030 ($ million)
Data Table on Germany - Market size and forecast 2025-2030 ($ million)
Chart on Germany - Year-over-year growth 2025-2030 (%)
Data Table on Germany - Year-over-year growth 2025-2030 (%)

12.4.2 UK - Market size and forecast 2025-2030

Chart on UK - Market size and forecast 2025-2030 ($ million)
Data Table on UK - Market size and forecast 2025-2030 ($ million)
Chart on UK - Year-over-year growth 2025-2030 (%)
Data Table on UK - Year-over-year growth 2025-2030 (%)

12.4.3 France - Market size and forecast 2025-2030

Chart on France - Market size and forecast 2025-2030 ($ million)
Data Table on France - Market size and forecast 2025-2030 ($ million)
Chart on France - Year-over-year growth 2025-2030 (%)
Data Table on France - Year-over-year growth 2025-2030 (%)

12.4.4 Italy - Market size and forecast 2025-2030

Chart on Italy - Market size and forecast 2025-2030 ($ million)
Data Table on Italy - Market size and forecast 2025-2030 ($ million)
Chart on Italy - Year-over-year growth 2025-2030 (%)
Data Table on Italy - Year-over-year growth 2025-2030 (%)

12.4.5 Russia - Market size and forecast 2025-2030

Chart on Russia - Market size and forecast 2025-2030 ($ million)
Data Table on Russia - Market size and forecast 2025-2030 ($ million)
Chart on Russia - Year-over-year growth 2025-2030 (%)
Data Table on Russia - Year-over-year growth 2025-2030 (%)

12.4.6 Spain - Market size and forecast 2025-2030

Chart on Spain - Market size and forecast 2025-2030 ($ million)
Data Table on Spain - Market size and forecast 2025-2030 ($ million)
Chart on Spain - Year-over-year growth 2025-2030 (%)
Data Table on Spain - Year-over-year growth 2025-2030 (%)

12.5 APAC - Market size and forecast 2025-2030

Chart on APAC - Market size and forecast 2025-2030 ($ million)
Data Table on APAC - Market size and forecast 2025-2030 ($ million)
Chart on APAC - Year-over-year growth 2025-2030 (%)
Data Table on APAC - Year-over-year growth 2025-2030 (%)
Chart on Regional Comparison - APAC
Data Table on Regional Comparison - APAC

12.5.1 China - Market size and forecast 2025-2030

Chart on China - Market size and forecast 2025-2030 ($ million)
Data Table on China - Market size and forecast 2025-2030 ($ million)
Chart on China - Year-over-year growth 2025-2030 (%)
Data Table on China - Year-over-year growth 2025-2030 (%)

12.5.2 India - Market size and forecast 2025-2030

Chart on India - Market size and forecast 2025-2030 ($ million)
Data Table on India - Market size and forecast 2025-2030 ($ million)
Chart on India - Year-over-year growth 2025-2030 (%)
Data Table on India - Year-over-year growth 2025-2030 (%)

12.5.3 Japan - Market size and forecast 2025-2030

Chart on Japan - Market size and forecast 2025-2030 ($ million)
Data Table on Japan - Market size and forecast 2025-2030 ($ million)
Chart on Japan - Year-over-year growth 2025-2030 (%)
Data Table on Japan - Year-over-year growth 2025-2030 (%)

12.5.4 South Korea - Market size and forecast 2025-2030

Chart on South Korea - Market size and forecast 2025-2030 ($ million)
Data Table on South Korea - Market size and forecast 2025-2030 ($ million)
Chart on South Korea - Year-over-year growth 2025-2030 (%)
Data Table on South Korea - Year-over-year growth 2025-2030 (%)

12.5.5 Australia - Market size and forecast 2025-2030

Chart on Australia - Market size and forecast 2025-2030 ($ million)
Data Table on Australia - Market size and forecast 2025-2030 ($ million)
Chart on Australia - Year-over-year growth 2025-2030 (%)
Data Table on Australia - Year-over-year growth 2025-2030 (%)

12.5.6 Indonesia - Market size and forecast 2025-2030

Chart on Indonesia - Market size and forecast 2025-2030 ($ million)
Data Table on Indonesia - Market size and forecast 2025-2030 ($ million)
Chart on Indonesia - Year-over-year growth 2025-2030 (%)
Data Table on Indonesia - Year-over-year growth 2025-2030 (%)

12.6 South America - Market size and forecast 2025-2030

Chart on South America - Market size and forecast 2025-2030 ($ million)
Data Table on South America - Market size and forecast 2025-2030 ($ million)
Chart on South America - Year-over-year growth 2025-2030 (%)
Data Table on South America - Year-over-year growth 2025-2030 (%)
Chart on Regional Comparison - South America
Data Table on Regional Comparison - South America

12.6.1 Brazil - Market size and forecast 2025-2030

Chart on Brazil - Market size and forecast 2025-2030 ($ million)
Data Table on Brazil - Market size and forecast 2025-2030 ($ million)
Chart on Brazil - Year-over-year growth 2025-2030 (%)
Data Table on Brazil - Year-over-year growth 2025-2030 (%)

12.6.2 Argentina - Market size and forecast 2025-2030

Chart on Argentina - Market size and forecast 2025-2030 ($ million)
Data Table on Argentina - Market size and forecast 2025-2030 ($ million)
Chart on Argentina - Year-over-year growth 2025-2030 (%)
Data Table on Argentina - Year-over-year growth 2025-2030 (%)

12.6.3 Chile - Market size and forecast 2025-2030

Chart on Chile - Market size and forecast 2025-2030 ($ million)
Data Table on Chile - Market size and forecast 2025-2030 ($ million)
Chart on Chile - Year-over-year growth 2025-2030 (%)
Data Table on Chile - Year-over-year growth 2025-2030 (%)

12.7 Middle East and Africa - Market size and forecast 2025-2030

Chart on Middle East and Africa - Market size and forecast 2025-2030 ($ million)
Data Table on Middle East and Africa - Market size and forecast 2025-2030 ($ million)
Chart on Middle East and Africa - Year-over-year growth 2025-2030 (%)
Data Table on Middle East and Africa - Year-over-year growth 2025-2030 (%)
Chart on Regional Comparison - Middle East and Africa
Data Table on Regional Comparison - Middle East and Africa

12.7.1 South Africa - Market size and forecast 2025-2030

Chart on South Africa - Market size and forecast 2025-2030 ($ million)
Data Table on South Africa - Market size and forecast 2025-2030 ($ million)
Chart on South Africa - Year-over-year growth 2025-2030 (%)
Data Table on South Africa - Year-over-year growth 2025-2030 (%)

12.7.2 UAE - Market size and forecast 2025-2030

Chart on UAE - Market size and forecast 2025-2030 ($ million)
Data Table on UAE - Market size and forecast 2025-2030 ($ million)
Chart on UAE - Year-over-year growth 2025-2030 (%)
Data Table on UAE - Year-over-year growth 2025-2030 (%)

12.7.3 Saudi Arabia - Market size and forecast 2025-2030

Chart on Saudi Arabia - Market size and forecast 2025-2030 ($ million)
Data Table on Saudi Arabia - Market size and forecast 2025-2030 ($ million)
Chart on Saudi Arabia - Year-over-year growth 2025-2030 (%)
Data Table on Saudi Arabia - Year-over-year growth 2025-2030 (%)

12.7.4 Egypt - Market size and forecast 2025-2030

Chart on Egypt - Market size and forecast 2025-2030 ($ million)
Data Table on Egypt - Market size and forecast 2025-2030 ($ million)
Chart on Egypt - Year-over-year growth 2025-2030 (%)
Data Table on Egypt - Year-over-year growth 2025-2030 (%)

12.7.5 Nigeria - Market size and forecast 2025-2030

Chart on Nigeria - Market size and forecast 2025-2030 ($ million)
Data Table on Nigeria - Market size and forecast 2025-2030 ($ million)
Chart on Nigeria - Year-over-year growth 2025-2030 (%)
Data Table on Nigeria - Year-over-year growth 2025-2030 (%)

12.8 Market opportunity by geography

Market opportunity by geography ($ million)
Data Tables on Market opportunity by geography ($ million)

13. Drivers, Challenges, and Opportunity

13.1 Market drivers

Rising demand for functional wellness and nutrient-dense formulations
Acceleration of flavor innovation and adventurous sensory experiences
Implementation of advanced circular packaging and sustainability initiatives

13.2 Market challenges

Strategic vulnerabilities in global fruit-sourcing and raw material supply chains
Global regulatory divergence and intensification of food safety enforcement
Heightened sustainability mandates and transition to circular packaging systems

13.3 Impact of drivers and challenges

Impact of drivers and challenges in 2025 and 2030

13.4 Market opportunities

Proliferation of functional fruit hybrids and nootropic infusions
Rise of mixed soda phenomenon and creamy-fruit fusion profiles
Hyper-local sourcing and integration of upcycled fruit ingredients

14. Competitive Landscape

14.1 Overview

14.2

Overview on criticality of inputs and factors of differentiation

14.3 Landscape disruption

Overview on factors of disruption

14.4 Industry risks

Impact of key risks on business

15. Competitive Analysis

15.1 Companies profiled

Companies covered

15.2 Company ranking index

15.3 Market positioning of companies

Matrix on companies position and classification

15.4 Asahi Group Holdings Ltd.

Asahi Group Holdings Ltd. - Overview
Asahi Group Holdings Ltd. - Business segments
Asahi Group Holdings Ltd. - Key news
Asahi Group Holdings Ltd. - Key offerings
Asahi Group Holdings Ltd. - Segment focus
SWOT

15.5 Danone SA

Danone SA - Overview
Danone SA - Business segments
Danone SA - Key news
Danone SA - Key offerings
Danone SA - Segment focus
SWOT

15.6 ITO EN Ltd.

ITO EN Ltd. - Overview
ITO EN Ltd. - Business segments
ITO EN Ltd. - Key offerings
ITO EN Ltd. - Segment focus
SWOT

15.7 Keurig Dr Pepper Inc.

Keurig Dr Pepper Inc. - Overview
Keurig Dr Pepper Inc. - Business segments
Keurig Dr Pepper Inc. - Key offerings
Keurig Dr Pepper Inc. - Segment focus
SWOT

15.8 Kirin Holdings Co. Ltd.

Kirin Holdings Co. Ltd. - Overview
Kirin Holdings Co. Ltd. - Business segments
Kirin Holdings Co. Ltd. - Key offerings
Kirin Holdings Co. Ltd. - Segment focus
SWOT

15.9 Monster Beverage Corp.

Monster Beverage Corp. - Overview
Monster Beverage Corp. - Business segments
Monster Beverage Corp. - Key offerings
Monster Beverage Corp. - Segment focus
SWOT

15.10 National Beverage Corp.

National Beverage Corp. - Overview
National Beverage Corp. - Product / Service
National Beverage Corp. - Key offerings
SWOT

15.11 Nestle SA

Nestle SA - Overview
Nestle SA - Business segments
Nestle SA - Key news
Nestle SA - Key offerings
Nestle SA - Segment focus
SWOT

15.12 PepsiCo Inc.

PepsiCo Inc. - Overview
PepsiCo Inc. - Business segments
PepsiCo Inc. - Key news
PepsiCo Inc. - Key offerings
PepsiCo Inc. - Segment focus
SWOT

15.13 Polar Beverages

Polar Beverages - Overview
Polar Beverages - Product / Service
Polar Beverages - Key offerings
SWOT

15.14 Red Bull GmbH

Red Bull GmbH - Overview
Red Bull GmbH - Product / Service
Red Bull GmbH - Key offerings
SWOT

15.15 Spindrift Beverage Co.

Spindrift Beverage Co. - Overview
Spindrift Beverage Co. - Product / Service
Spindrift Beverage Co. - Key offerings
SWOT

15.16 Suntory Beverage and Food Ltd.

Suntory Beverage and Food Ltd. - Overview
Suntory Beverage and Food Ltd. - Business segments
Suntory Beverage and Food Ltd. - Key news
Suntory Beverage and Food Ltd. - Key offerings
Suntory Beverage and Food Ltd. - Segment focus
SWOT

15.17 The Coca Cola Co.

The Coca Cola Co. - Overview
The Coca Cola Co. - Business segments
The Coca Cola Co. - Key news
The Coca Cola Co. - Key offerings
The Coca Cola Co. - Segment focus
SWOT

15.18 The Kraft Heinz Co.

The Kraft Heinz Co. - Overview
The Kraft Heinz Co. - Business segments
The Kraft Heinz Co. - Key news
The Kraft Heinz Co. - Key offerings
The Kraft Heinz Co. - Segment focus
SWOT

16. Appendix

16.1 Scope of the report

Market definition
Objectives
Notes and caveats

16.2 Inclusions and exclusions checklist

Inclusions checklist
Exclusions checklist

16.3 Currency conversion rates for US$

16.4 Research methodology

16.5 Data procurement

Information sources

16.6 Data validation

16.7 Validation techniques employed for market sizing

16.8 Data synthesis

16.9 360 degree market analysis

16.10 List of abbreviations

Research Methodology

Technavio presents a detailed picture of the market by way of study, synthesis, and summation of data from multiple sources. The analysts have presented the various facets of the market with a particular focus on identifying the key industry influencers. The data thus presented is comprehensive, reliable, and the result of extensive research, both primary and secondary.

INFORMATION SOURCES

Primary sources

  • Manufacturers and suppliers
  • Channel partners
  • Industry experts
  • Strategic decision makers

Secondary sources

  • Industry journals and periodicals
  • Government data
  • Financial reports of key industry players
  • Historical data
  • Press releases

DATA ANALYSIS

Data Synthesis

  • Collation of data
  • Estimation of key figures
  • Analysis of derived insights

Data Validation

  • Triangulation with data models
  • Reference against proprietary databases
  • Corroboration with industry experts

REPORT WRITING

Qualitative

  • Market drivers
  • Market challenges
  • Market trends
  • Five forces analysis

Quantitative

  • Market size and forecast
  • Market segmentation
  • Geographical insights
  • Competitive landscape

Interested in this report?

Get your sample now to see our research methodology and insights!

Download Now

Frequently Asked Questions

Fruit-flavored Soft Drinks market growth will increase by USD 28621.5 million during 2026-2030.

The Fruit-flavored Soft Drinks market is expected to grow at a CAGR of 5.1% during 2026-2030.

Fruit-flavored Soft Drinks market is segmented by Type (FFCSD, FFNCSD) Distribution channel (Supermarkets or hypermarkets, Convenience stores, Online retail stores) Packaging (Bottles, Cans, Tetra packs)

Asahi Group Holdings Ltd., Bundaberg Brewed Drinks, Danone SA, Harvest Hill Beverage Co., ITO EN Ltd., Keurig Dr Pepper Inc., Kirin Holdings Co. Ltd., Monster Beverage Corp., National Beverage Corp., Nestle SA, Ocean Spray Cranberries Inc., PepsiCo Inc., Polar Beverages, Red Bull GmbH, Refresco Group BV, Spindrift Beverage Co., Suntory Beverage and Food Ltd., Talking Rain Beverage Co., The Coca Cola Co., The Kraft Heinz Co. are a few of the key vendors in the Fruit-flavored Soft Drinks market.

Europe will register the highest growth rate of 34.4% among the other regions. Therefore, the Fruit-flavored Soft Drinks market in Europe is expected to garner significant business opportunities for the vendors during the forecast period.

US, Canada, Mexico, Germany, UK, France, Italy, Russia, Spain, China, India, Japan, South Korea, Australia, Indonesia, Brazil, Argentina, Chile, South Africa, UAE, Saudi Arabia, Egypt, Nigeria

  • Rising demand for functional wellness and nutrient-dense formulations is the driving factor this market.

The Fruit-flavored Soft Drinks market vendors should focus on grabbing business opportunities from the Type segment as it accounted for the largest market share in the base year.
RIA - Research AI Assistant
Ask RIA