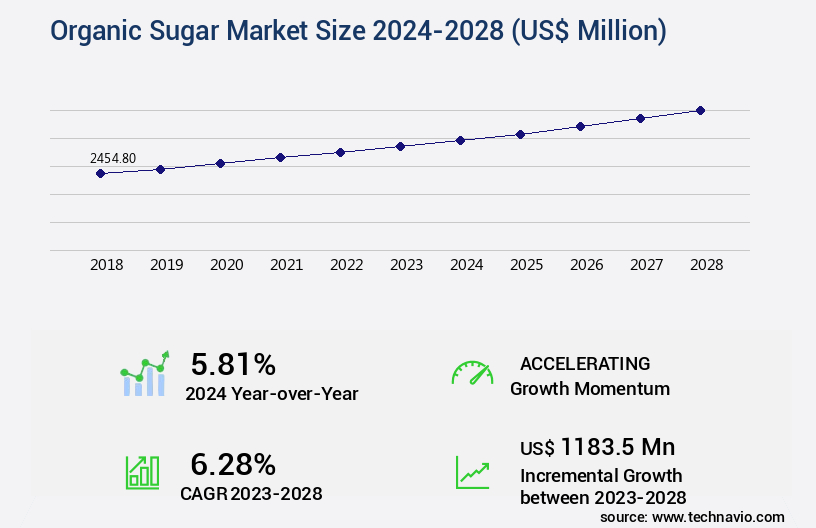
Organic Sugar Market Size 2024-2028
The organic sugar market size is valued to increase USD 1.18 billion, at a CAGR of 6.28% from 2023 to 2028. Growing health consciousness will drive the organic sugar market.
Major Market Trends & Insights
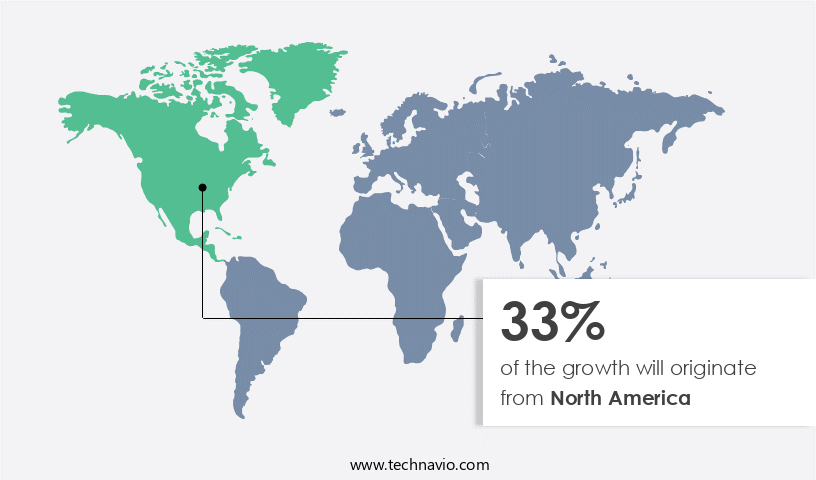
- North America dominated the market and accounted for a 33% growth during the forecast period.
- By Type - Crystals segment was valued at USD 1.57 billion in 2022
- By Distribution Channel - Offline segment accounted for the largest market revenue share in 2022
Market Size & Forecast
- Market Opportunities: USD 83.72 million
- Market Future Opportunities: USD 1183.50 million
- CAGR from 2023 to 2028 : 6.28%
Market Summary
- Organic sugar, a natural alternative to refined sugar, has experienced significant growth in recent years due to increasing consumer preference for healthier food options. According to the Organic Trade Association, global organic food sales reached USD103.5 billion in 2019, with organic sugar being a notable segment. This trend is driven by the emergence of e-commerce platforms, which have made it easier for consumers to access organic products, including sugar. However, the high cost of organic sugar production poses a challenge to its widespread adoption. Farmers must adhere to stringent organic farming practices, which include avoiding the use of synthetic fertilizers and pesticides, and following specific harvesting and processing methods.
- Despite these challenges, the market continues to expand, as consumers become more conscious of their health and the environmental impact of their food choices. This shift towards organic sugar reflects a broader trend towards sustainable and healthier food options, and is expected to continue shaping the food industry landscape in the coming years.
What will be the Size of the Organic Sugar Market during the forecast period?
Get Key Insights on Market Forecast (PDF) Request Free Sample
How is the Organic Sugar Market Segmented ?
The organic sugar industry research report provides comprehensive data (region-wise segment analysis), with forecasts and estimates in "USD million" for the period 2024-2028, as well as historical data from 2018-2022 for the following segments.
- Type
- Crystals
- Molasses
- Distribution Channel
- Offline
- Online
- Source
- Sugarcane
- Sugar Beet
- Coconut
- Date
- Maple
- Stevia
- Certification
- USDA Organic
- EU Organic
- JAS Organic
- Other Regional Certifications
- Application
- Food & Beverages
- Personal Care & Cosmetics
- Pharmaceuticals
- Other Industrial Applications
- Geography
- North America
- US
- Canada
- Europe
- France
- Germany
- Italy
- UK
- Middle East and Africa
- Egypt
- KSA
- Oman
- UAE
- APAC
- China
- India
- Japan
- South America
- Argentina
- Brazil
- Rest of World (ROW)
- North America
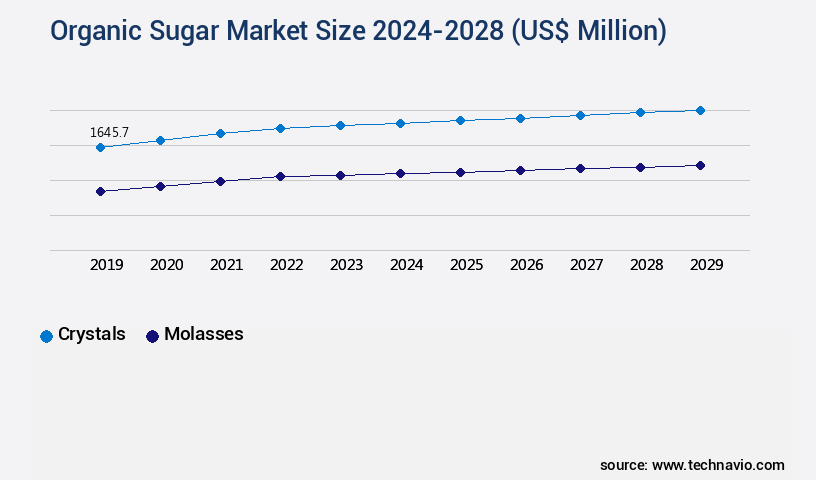
By Type Insights
The crystals segment is estimated to witness significant growth during the forecast period.
The market continues to evolve, with ongoing activities in sugarcane genetic improvement, sugar refining techniques, and sugar yield optimization shaping industry trends. Sugarcane variety selection, molasses fermentation, and wastewater treatment are key areas of focus for companies, as they strive for sugarcane disease resistance, maturity assessment, and physiology advancements. Sugarcane juice clarification, pest management strategies, and sugarcane processing techniques are also under constant review, with centrifugal separation, color removal methods, and sugar crystallization processes being refined for improved efficiency. Harvesting techniques and sugarcane growth stages are essential aspects of cultivation practices, with sugarcane biochemistry and quality control measures ensuring sugar purity metrics and storage methods maintain the integrity of the final product.
Sugarcane cultivation practices are increasingly adopting sustainable approaches, such as regenerative agriculture, renewable energy sources, and carbon offsetting programs, to minimize environmental impact. The market's commitment to sustainability is further demonstrated by efforts to optimize sugarcane milling efficiency, reduce energy consumption, and analyze sugarcane fiber for potential bioenergy applications. Byproduct recovery and sugarcane transportation methods are also being reevaluated to enhance overall sustainability and profitability.
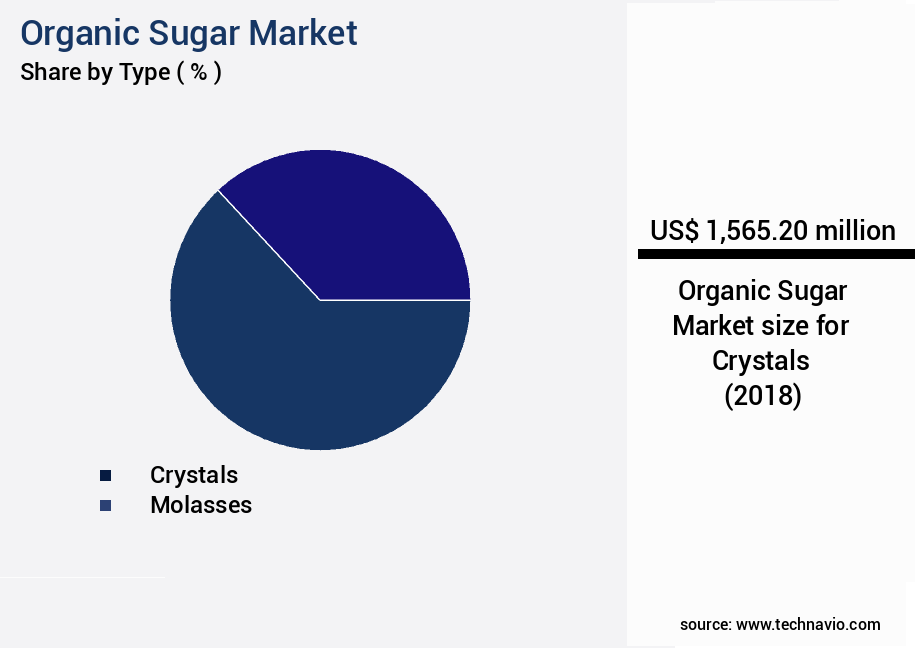
The Crystals segment was valued at USD 1.57 billion in 2018 and showed a gradual increase during the forecast period.
Regional Analysis
North America is estimated to contribute 33% to the growth of the global market during the forecast period.Technavio's analysts have elaborately explained the regional trends and drivers that shape the market during the forecast period.
See How Organic Sugar Market Demand is Rising in North America Request Free Sample
The market is witnessing significant growth, driven by the expanding consumer base seeking healthier and more sustainable food options. The North American region, comprising the US and Canada, dominates this market due to its large consumer base and increasing preference for organic food products. According to recent studies, the market in North America is projected to expand at a steady pace, with the US accounting for the majority of the demand. Moreover, the shift towards eco-friendly and ethically sourced food products is influencing the market dynamics. Organic sugar manufacturers are adopting sustainable farming practices and implementing transparent supply-chain systems to cater to this growing demand.
For instance, some manufacturers have reduced their water usage by up to 30% through rainwater harvesting and drip irrigation techniques. Furthermore, they are focusing on fair trade practices and ethical labor conditions to meet the evolving consumer preferences. This commitment to sustainability and transparency is expected to fuel the growth of the market in the coming years.
Market Dynamics
Our researchers analyzed the data with 2023 as the base year, along with the key drivers, trends, and challenges. A holistic analysis of drivers will help companies refine their marketing strategies to gain a competitive advantage.
The market is experiencing significant growth due to increasing consumer awareness and demand for healthier food options. To meet this demand, the optimization of the sugarcane milling process is crucial. This involves improving soil nutrient management to enhance sugar yield, employing advanced sugarcane juice clarification techniques, and utilizing energy-efficient sugar crystallization technologies. The impact of soil nutrients on sugar yield is a critical factor in the production of organic sugar. Proper nutrient management ensures the optimal growth of sugarcane, leading to higher sugar content in the crop. Sugarcane irrigation practices also play a vital role in sugar quality. Water-efficient irrigation systems and the use of sustainable irrigation methods are essential for producing high-quality organic sugar. In addition to sugar production, sugarcane waste valorization methods are gaining importance. Sugarcane bagasse is a valuable resource for bioenergy production, while molasses can be optimally fermented for various industrial applications. Improved sugar refining processes and sugarcane waste treatment technologies are also essential for ensuring the highest quality organic sugar. Sustainable sugarcane cultivation practices, such as high-sugarcane variety development, advanced pest management techniques, and sugarcane genetic engineering for yield improvement, are crucial for maintaining a steady supply of organic sugar. Water-efficient sugarcane irrigation systems and energy-efficient sugarcane processing are also essential for reducing the environmental footprint of organic sugar production. Advanced sugar quality control measures, including sugarcane disease resistance genes, are necessary to ensure the consistent production of high-quality organic sugar. Sugarcane byproducts, such as sugarcane molasses and bagasse, have numerous applications in the food industry, further increasing the market potential for organic sugar. Overall, the market is poised for growth as consumers continue to demand healthier food options and sustainable production methods.

What are the key market drivers leading to the rise in the adoption of Organic Sugar Industry?
- The growing awareness and prioritization of health concerns serve as the primary catalyst for market expansion.
- The market is experiencing significant growth due to the increasing health consciousness among consumers worldwide. The preference for organic sugar over refined sugar is on the rise, driven by the awareness of its health benefits. The global demand for organic sugar is surging as people seek healthier alternatives, a trend that is expected to persist even beyond the pandemic. The shift towards organic lifestyles, fueled by the pandemic and the desire to prioritize health, is boosting the market's growth.
- Organic sugar's market expansion underscores the importance of offering healthier options in various sectors, including food and beverage manufacturing, pharmaceuticals, and personal care. The market's robust growth is a testament to the global population's evolving health priorities.
What are the market trends shaping the Organic Sugar Industry?
- The emergence of e-commerce platforms represents a significant market trend in the business world. This trend signifies a shift towards online shopping and digital commerce solutions.
- The market has experienced notable expansion, propelled by the rise of e-commerce platforms. Major retailers like Amazon, Walmart, and Alibaba have created a vast marketplace for organic sugar producers, enabling them to reach a broader consumer base. For example, Walmart's online platform offers a dedicated section for organic products, providing customers with various organic sugar brands. E-commerce platforms have revolutionized the purchasing process, allowing customers to buy organic sugar conveniently from their homes.
- This digital shift has increased accessibility and convenience for consumers, contributing to the market's growth.
What challenges does the Organic Sugar Industry face during its growth?
- The high cost of production poses a significant challenge to the growth of the industry. In order to remain competitive, companies must find ways to minimize production costs while maintaining quality and efficiency. This can be achieved through various means such as implementing lean manufacturing processes, negotiating favorable supplier contracts, and investing in automation technology. By addressing this challenge effectively, the industry can continue to thrive and innovate, driving economic growth and creating new opportunities.
- Organic sugar production entails higher costs due to the absence of synthetic pesticides and fertilizers in its cultivation. This results in lower yields and a more labor-intensive process compared to conventional sugar production. The organic farming industry, which supports organic sugar production, necessitates intensive labor practices to manage pests naturally and maintain soil fertility. Consequently, the cost of organic sugar production is significantly higher than that of conventional sugar. This price disparity may deter some consumers from purchasing organic sugar. Despite these challenges, the market continues to evolve, driven by increasing consumer awareness and demand for healthier food alternatives.
- For instance, organic sugar accounts for approximately 1% of the global sugar market share, highlighting its niche yet growing presence.
Exclusive Technavio Analysis on Customer Landscape
The organic sugar market forecasting report includes the adoption lifecycle of the market, covering from the innovator's stage to the laggard's stage. It focuses on adoption rates in different regions based on penetration. Furthermore, the organic sugar market report also includes key purchase criteria and drivers of price sensitivity to help companies evaluate and develop their market growth analysis strategies.
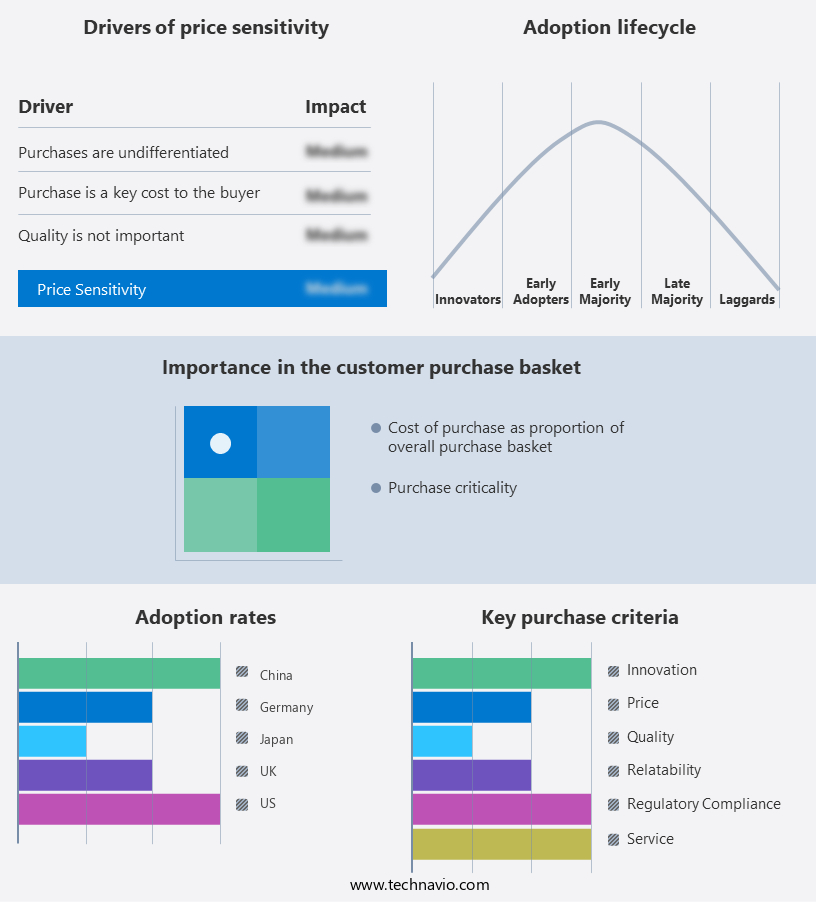
Customer Landscape of Organic Sugar Industry
Competitive Landscape
Companies are implementing various strategies, such as strategic alliances, organic sugar market forecast, partnerships, mergers and acquisitions, geographical expansion, and product/service launches, to enhance their presence in the industry.
Agrana Beteiligungs-AG - This company specializes in the production and distribution of certified organic sugar varieties, including Brown Coconut Sugar, Golden Coconut Sugar, and Vanilla Coconut Sugar. Their product line caters to consumers seeking natural sweeteners for their dietary needs.
The industry research and growth report includes detailed analyses of the competitive landscape of the market and information about key companies, including:
- Agrana Beteiligungs-AG
- ASR Group International, Inc.
- Associated British Foods plc
- Bajaj Hindusthan Sugar Ltd.
- BayCo, Inc.
- Biosev S.A.
- Bunge Limited
- Cargill, Inc.
- COFCO International Limited
- Cosan S.A.
- Dalmia Bharat Sugar and Industries Limited
- DW Montgomery & Company
- E.I.D. Parry (India) Limited
- Florida Crystals Corporation
- Global Organics, Ltd.
- International Sugars, Inc.
- Louis Dreyfus Company B.V.
- Mitr Phol Group
- Nanning Sugar Industry Co., Ltd.
- Pronatec AG
- Raízen S.A.
- Samruddhi Organic Farm Private Limited
- Shree Renuka Sugars Ltd.
- Südzucker AG
- Tate & Lyle PLC
- Tereos SCA
- Thai Roong Ruang Sugar Group
- Wilmar International Ltd.
Qualitative and quantitative analysis of companies has been conducted to help clients understand the wider business environment as well as the strengths and weaknesses of key industry players. Data is qualitatively analyzed to categorize companies as pure play, category-focused, industry-focused, and diversified; it is quantitatively analyzed to categorize companies as dominant, leading, strong, tentative, and weak.
Recent Development and News in Organic Sugar Market
- In January 2024, Wholesome Sweeteners, a leading organic sugar producer, announced the launch of its new line of organic sugar in bulk packaging. This expansion aimed to cater to the growing demand from food manufacturers and industrial consumers (Wholesome Sweeteners Press Release).
- In March 2024, C&H Sugar, a major sugar processor, entered into a strategic partnership with Organic Valley, a cooperative of organic farmers. The collaboration focused on sourcing and marketing organic sugar under the Organic Valley brand (Organic Valley Press Release).
- In May 2024, Florida Crystals, a prominent sugar producer, completed the acquisition of a 50% stake in Monasterio Sucre, a leading Colombian organic sugar producer. This move strengthened Florida Crystals' position in The market and expanded its production capacity (Florida Crystals Press Release).
- In February 2025, the European Commission approved a new regulation that mandated a 10% increase in the use of organic sugar in all food products sold within the European Union by 2027. This policy change is expected to significantly boost the demand for organic sugar in Europe (European Commission Press Release).
Dive into Technavio's robust research methodology, blending expert interviews, extensive data synthesis, and validated models for unparalleled Organic Sugar Market insights. See full methodology.
|
Market Scope |
|
|
Report Coverage |
Details |
|
Page number |
150 |
|
Base year |
2023 |
|
Historic period |
2018-2022 |
|
Forecast period |
2024-2028 |
|
Growth momentum & CAGR |
Accelerate at a CAGR of 6.28% |
|
Market growth 2024-2028 |
USD 1183.5 million |
|
Market structure |
Fragmented |
|
YoY growth 2023-2024(%) |
5.81 |
|
Key countries |
US, Canada, Germany, UK, Italy, France, China, India, Japan, Brazil, Egypt, UAE, Oman, Argentina, KSA, UAE, Brazil, and Rest of World (ROW) |
|
Competitive landscape |
Leading Companies, Market Positioning of Companies, Competitive Strategies, and Industry Risks |
Research Analyst Overview
- The market continues to evolve, driven by the increasing demand for sustainable and health-conscious sweeteners. Sugarcane genetic improvement and sugar refining techniques are at the forefront of market activities, with researchers and producers continually seeking to optimize sugar yield and improve disease resistance. For instance, the adoption of sugarcane varieties with higher sucrose content and enhanced maturity assessment techniques has led to a 5% increase in sugar yield in some regions. Moreover, sugarcane physiology and biochemistry are undergoing significant research to enhance sugar crystallization processes, sugar purity metrics, and sugarcane juice clarification. Sugarcane processing innovations, such as centrifugal separation and color removal methods, contribute to improved sugar milling efficiency and energy consumption reduction.
- Pest management strategies and sugarcane cultivation practices are also essential aspects of the market, with a focus on sustainable farming methods and soil nutrient management. Sugarcane breeding programs and sugarcane fiber analysis are crucial for developing new sugarcane varieties and enhancing sugarcane bagasse utilization. Furthermore, the market is expanding beyond traditional applications to include bioenergy from sugarcane and byproduct recovery. The industry expects a 7% annual growth rate as market dynamics unfold, with ongoing research and development in areas such as wastewater treatment, molasses fermentation, and beet sugar extraction. For example, a leading sugar producer implemented a sugarcane harvesting technique that reduced water usage efficiency by 20%, resulting in significant cost savings and environmental benefits.
- Quality control measures and storage methods are also essential to ensure the purity and consistency of organic sugar products. In conclusion, the market is a dynamic and evolving industry, with ongoing research and innovation driving improvements in sugarcane genetics, processing techniques and machinery, and sustainability practices. The market's continuous unfolding is shaped by various factors, including sugar yield optimization, sugarcane variety selection, pest management strategies, and byproduct recovery.
What are the Key Data Covered in this Organic Sugar Market Research and Growth Report?
-
What is the expected growth of the Organic Sugar Market between 2024 and 2028?
-
USD 1.18 billion, at a CAGR of 6.28%
-
-
What segmentation does the market report cover?
-
The report is segmented by Type (Crystals and Molasses), Distribution Channel (Offline and Online), Geography (North America, Europe, APAC, South America, and Middle East and Africa), Source (Sugarcane, Sugar Beet, Coconut, Date, Maple, and Stevia), Certification (USDA Organic, EU Organic, JAS Organic, and Other Regional Certifications), and Application (Food & Beverages, Personal Care & Cosmetics, Pharmaceuticals, and Other Industrial Applications)
-
-
Which regions are analyzed in the report?
-
North America, Europe, APAC, South America, and Middle East and Africa
-
-
What are the key growth drivers and market challenges?
-
Growing health consciousness, High cost of production
-
-
Who are the major players in the Organic Sugar Market?
-
Agrana Beteiligungs-AG, ASR Group International, Inc., Associated British Foods plc, Bajaj Hindusthan Sugar Ltd., BayCo, Inc., Biosev S.A., Bunge Limited, Cargill, Inc., COFCO International Limited, Cosan S.A., Dalmia Bharat Sugar and Industries Limited, DW Montgomery & Company, E.I.D. Parry (India) Limited, Florida Crystals Corporation, Global Organics, Ltd., International Sugars, Inc., Louis Dreyfus Company B.V., Mitr Phol Group, Nanning Sugar Industry Co., Ltd., Pronatec AG, Raízen S.A., Samruddhi Organic Farm Private Limited, Shree Renuka Sugars Ltd., Südzucker AG, Tate & Lyle PLC, Tereos SCA, Thai Roong Ruang Sugar Group, and Wilmar International Ltd.
-
Market Research Insights
- The market is a continually evolving industry, with a growing demand for sustainably produced sweeteners. According to recent reports, the market is projected to expand at a significant rate, with an anticipated growth of 10% annually. This expansion is driven by increasing consumer awareness and preference for organic products, as well as advancements in sugarcane harvest mechanization and processing optimization. For instance, sugarcane farmers have implemented more efficient transportation logistics, reducing the time from harvest to processing and ensuring a higher quality product.
- Additionally, sugarcane growers are focusing on disease monitoring and sustainability practices, such as biorefinery technologies and fertilizer application methods, to minimize environmental impact and maximize yields. These efforts have led to an increase in organic sugar production, with some farms reporting a sales increase of up to 15% in the past year.
We can help! Our analysts can customize this organic sugar market research report to meet your requirements.
 RIA -
RIA - 
