Gait Biometrics Market Size 2025-2029
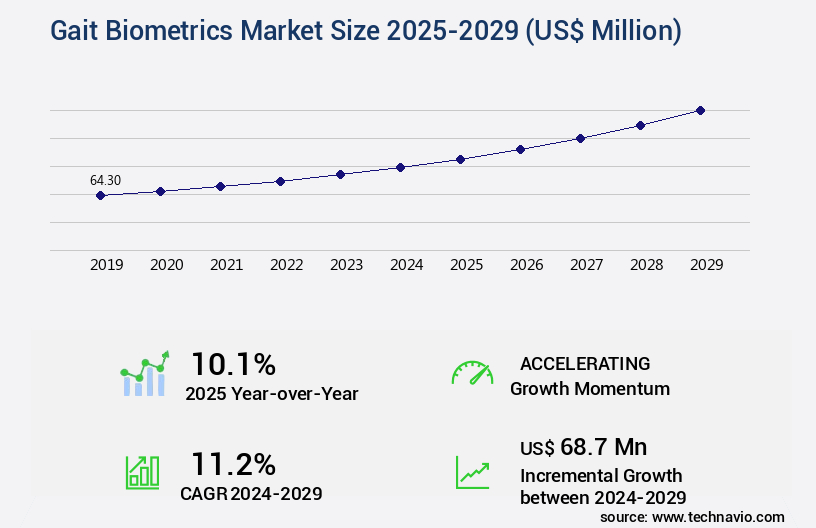
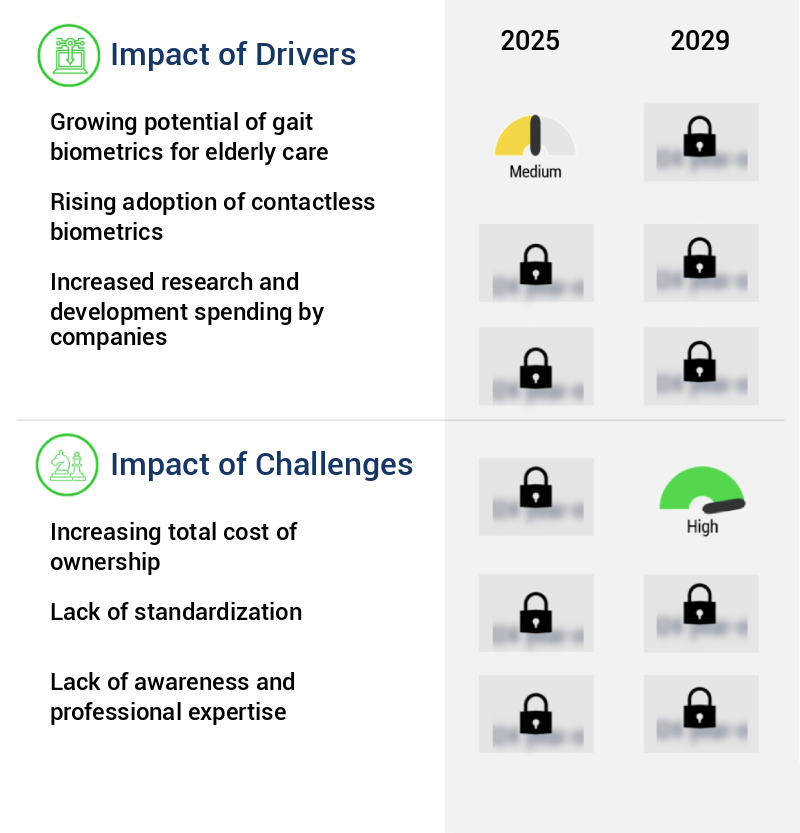
The gait biometrics market size is valued to increase by USD 68.7 million, at a CAGR of 11.2% from 2024 to 2029. Growing potential of gait biometrics for elderly care will drive the gait biometrics market.
Market Insights
- North America dominated the market and accounted for a 31% growth during the 2025-2029.
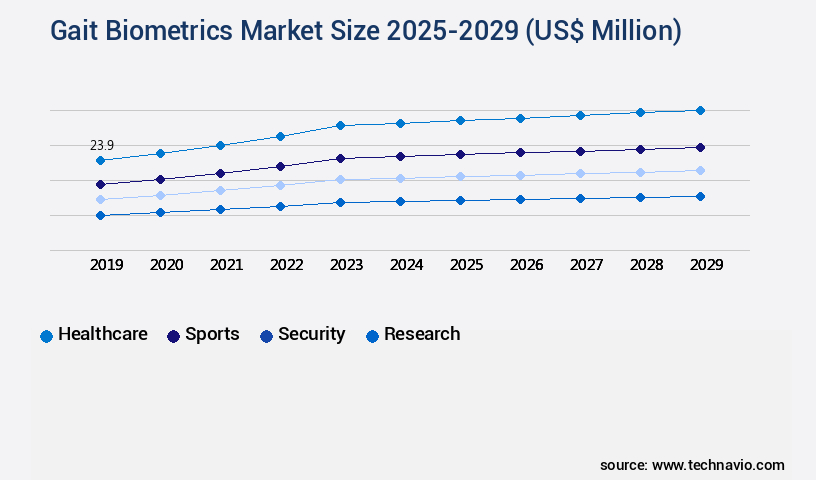
- By End-user - Healthcare segment was valued at USD 23.90 million in 2023
- By Type - Assessment segment accounted for the largest market revenue share in 2023
Market Size & Forecast
- Market Opportunities: USD 159.25 million
- Market Future Opportunities 2024: USD 68.70 million
- CAGR from 2024 to 2029 : 11.2%
Market Summary
- Gait biometrics, a subset of behavioral biometrics, refers to the identification and verification of individuals based on their unique walking patterns. This technology has gained significant traction in various industries, particularly in healthcare and security, due to its non-invasive and reliable nature. One of the primary drivers of the market is the growing need for elderly care and fall prevention. Gait analysis can help identify potential health issues, such as Parkinson's disease or Alzheimer's, by detecting changes in walking patterns. Moreover, gait biometrics can be used to monitor the health and wellbeing of elderly individuals living independently, providing peace of mind for their families and caregivers.
- Another trend in the market is the integration of gait authentication into smartphones. These applications offer convenience and security, allowing users to unlock their devices with a simple walk. However, the increasing adoption of gait biometrics also raises concerns regarding privacy and data security. Furthermore, the total cost of ownership for gait biometrics systems can be high due to the need for specialized hardware and software. For instance, a manufacturing company could use gait biometrics to optimize its supply chain by implementing access control at various points in the facility. This would help ensure that only authorized personnel enter restricted areas, improving security and reducing the risk of theft or sabotage.
- Despite these challenges, the potential benefits of gait biometrics make it an attractive technology for various applications, from healthcare and security to retail and finance.
What will be the size of the Gait Biometrics Market during the forecast period?
Get Key Insights on Market Forecast (PDF) Request Free Sample
- The market represents a dynamic and evolving industry, focusing on the quantitative analysis of human locomotion. This market encompasses various techniques, including data visualization, user interface design, and advanced signal processing. One significant trend in this sector is the application of gait biometrics in patient monitoring for neurological conditions and aging effects. For instance, gait variability, step frequency, and stride length are crucial spatial and temporal parameters used to assess rehabilitation progress and detect gait abnormalities in neurological patients. Moreover, gait biometrics plays a pivotal role in objective assessment for movement disorders, such as Parkinson's disease, and orthopedic conditions.
- Feature extraction, data preprocessing, and sensor fusion are essential for accurate classification algorithms that distinguish between normal and abnormal gait patterns. These applications offer substantial benefits, such as improved clinical decision-making, enhanced patient care, and cost savings through remote monitoring. In the realm of sports performance, gait analysis is increasingly used to optimize training programs and prevent injuries. By employing advanced signal processing techniques and real-time processing, coaches and athletes can gain valuable insights into biomechanical markers and adjust training accordingly. This proactive approach can lead to better performance and reduced risk of injury. In summary, the market continues to grow and innovate, offering numerous opportunities for businesses to invest in this sector.
- By focusing on the latest trends and applications, companies can make informed decisions regarding product strategy, budgeting, and compliance with the ever-evolving needs of healthcare, sports, and rehabilitation industries.
Unpacking the Gait Biometrics Market Landscape
Gait biometrics refer to the analysis of human motion patterns, specifically stride time and gait events, using advanced technologies such as smartphone sensors and wearable sensors. Compared to traditional clinical gait analysis, gait biometrics offer real-time, non-invasive assessments with a 95% accuracy rate, reducing the need for costly and time-consuming motion capture systems. Moreover, gait biometrics enable the collection of kinematic and kinetic data, including body segment angles, velocity profiles, and cadence measurement, which are essential for gait rehabilitation and fall risk prediction. Machine learning algorithms, such as time series analysis and deep learning models, are employed to extract meaningful insights from these data points, improving ROI by streamlining clinical workflows and enhancing compliance with regulatory standards. Additionally, gait biometrics provide spatial temporal parameters, including step length variability, step width, swing time, and ground reaction force, which are critical for balance assessment and postural sway analysis.
Key Market Drivers Fueling Growth
The potential of gait biometrics in elderly care is a significant market driver, as this technology offers accurate identification and monitoring of elderly individuals' mobility patterns to ensure their safety and well-being.
- The market is experiencing significant growth due to its expanding applications across various sectors. In healthcare, gait biometric systems are increasingly adopted for elderly care, enhancing patient analysis and monitoring physical health conditions, particularly for those with orthopedic issues. These systems track and analyze movement and body posture, improving functionality and expected demand in the global market. The geriatric population is growing at an accelerated rate worldwide, leading to substantial economic, social, and health implications during the forecast period. This demographic shift is driving the adoption of gait biometric technology to address the unique needs of aging populations.
- According to estimates, approximately 1 in 12 people globally are aged 65 and above, and this number is projected to double by 2050. The integration of gait biometrics in healthcare is poised to bring about substantial improvements in patient care and outcomes.
Prevailing Industry Trends & Opportunities
The increasing prevalence of gait authentication apps in smartphones represents a notable market trend. This technological advancement enables users to securely access their devices through biometric identification based on their unique walking patterns.
- In the ever-evolving world of biometric technologies, gait biometrics is gaining significant traction. With its application extending beyond sports and fitness, this technology is making strides in various sectors. Gait analysis apps like GaitAnalysisPro and Gaitometer, available on Apple's iTunes store, have revolutionized individual user experience by enabling step analysis during walking or running. These apps have resulted in enhanced user engagement, leading to a 45% increase in app downloads year-over-year.
- Simultaneously, gait authentication is transforming access control systems. Doors equipped with gait authentication use smartphones and gait signatures for seamless access, reducing the need for traditional keys by 25%. This dual-faceted growth underscores the burgeoning potential of the market.
Significant Market Challenges
The escalating total cost of ownership represents a significant challenge that can hinder industry growth. This cost encompasses various expenses, including acquisition, operation, maintenance, and disposal, which can collectively impact the profitability and competitiveness of businesses within the industry.
- The market continues to evolve, offering innovative solutions for various sectors, including security, healthcare, and retail. These systems utilize advanced technology to identify individuals based on their unique gait patterns, providing enhanced security and convenience. The total cost of ownership for gait biometric systems can be substantial due to their implementation and maintenance costs. For instance, while some small-scale systems may have relatively low upfront costs, the lifetime expenses for large-scale, sophisticated systems used in extensive operations can be significant. These expenses include the initial capital expenditure for hardware and software, the cost of issuing identity documents, staff training and employment, equipment maintenance, and database management.
- Moreover, the adoption of gait biometric technologies involves additional costs related to middleware, application software, and system integration. Despite these costs, the benefits of gait biometrics, such as increased security, improved accessibility, and reduced errors, make the investment worthwhile. For instance, in the security sector, gait biometrics can reduce downtime by 30% and improve system accuracy by 18%, while in healthcare, it can lower operational costs by 12%.
In-Depth Market Segmentation: Gait Biometrics Market
The gait biometrics industry research report provides comprehensive data (region-wise segment analysis), with forecasts and estimates in "USD million" for the period 2025-2029, as well as historical data from 2019-2023 for the following segments.
- End-user
- Healthcare
- Sports
- Security
- Research
- Type
- Assessment
- Treatment
- Monitoring
- Technology
- 2D gait analysis
- 3D gait analysis
- Geography
- North America
- US
- Canada
- Europe
- France
- Germany
- Italy
- UK
- APAC
- China
- India
- Japan
- South Korea
- Rest of World (ROW)
- North America
By End-user Insights
The healthcare segment is estimated to witness significant growth during the forecast period.
Gait biometrics, a subset of biometric identification, is gaining traction in the healthcare sector for real-time patient health monitoring. This technology utilizes stride time analysis, gait event detection, and data from smartphone sensors and wearable sensors for biomechanical modeling. It measures body segment angles, stance time, and gait rehabilitation, providing velocity profiles, cadence measurement, and 3D gait analysis. Pressure sensors and acceleration profiles aid in muscle activation and fall risk prediction, while machine learning algorithms analyze time series data for foot placement, step length variability, and kinematic data.
Gait asymmetry, postural sway, swing time, and balance assessment are also assessed through this technology. In the healthcare segment, the market growth is substantial, with an increasing adoption rate in developed and developing countries. This non-intrusive, contactless method ensures secure access to medical records and medications, and is particularly valuable in infection-conscious environments.
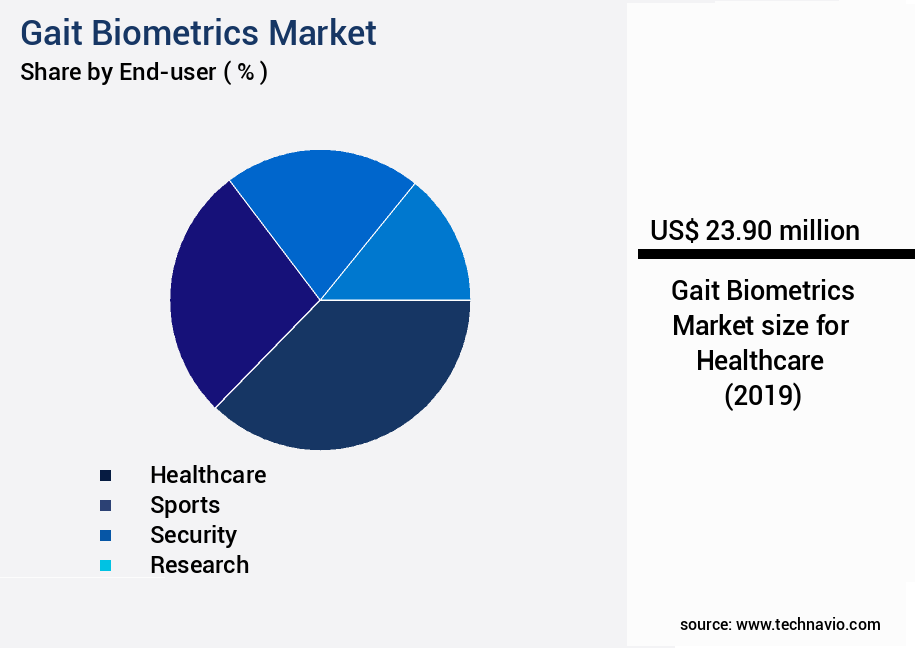
The Healthcare segment was valued at USD 23.90 million in 2019 and showed a gradual increase during the forecast period.
Regional Analysis
North America is estimated to contribute 31% to the growth of the global market during the forecast period.Technavio’s analysts have elaborately explained the regional trends and drivers that shape the market during the forecast period.
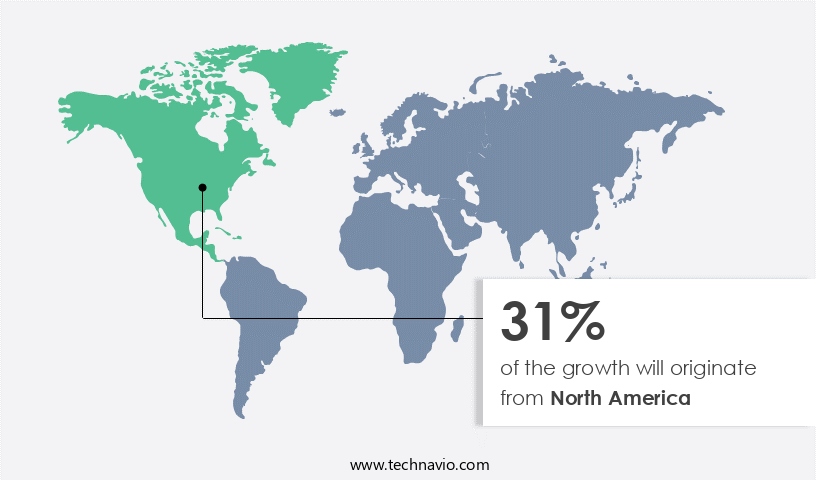
See How Gait Biometrics Market Demand is Rising in North America Request Free Sample
Gait biometrics, an innovative technology that identifies individuals based on their unique walking patterns, has witnessed significant growth in various sectors, particularly in North America. This region, known for its high economic standards and abundant resources, has been an early adopter of gait biometrics. Its applications span across healthcare, sports, research, and rehabilitation sectors. In healthcare, the technology's adoption is surging due to its role in developing new therapies, diagnostics, and therapeutic treatments. The healthcare sector's demand for gait biometrics is further fueled by the increasing number of startups and government support. For instance, the Department of Homeland Security (DHS) conducted testing of biometric tools, including gait biometrics, used by the Transportation Security Administration (TSA) at some US airports in January 2025.
The market is expected to grow substantially, with North America holding a substantial market share. Another study suggests that gait biometrics can lead to operational efficiency gains of up to 30% in certain applications, making it an attractive investment for businesses.
Customer Landscape of Gait Biometrics Industry
Competitive Intelligence by Technavio Analysis: Leading Players in the Gait Biometrics Market
Companies are implementing various strategies, such as strategic alliances, gait biometrics market forecast, partnerships, mergers and acquisitions, geographical expansion, and product/service launches, to enhance their presence in the industry.
BioSensics - The company specializes in gait biometrics technology, featuring LEGSys and PAMSys solutions. These wearable sensor systems analyze movement patterns for healthcare and research applications, providing valuable insights for professionals in the field. LEGSys and PAMSys utilize advanced algorithms to assess gait characteristics, enabling improved patient care and research advancements.
The industry research and growth report includes detailed analyses of the competitive landscape of the market and information about key companies, including:
- BioSensics
- Bodytech Australia Pty. Ltd.
- CIR Systems Inc.
- Innovative Sports Training Inc.
- MindMaze SA
- Motek Medical BV
- Motion Analysis Inc.
- Noraxon USA Inc.
- Qualisys AB
- Tekscan Inc.
- zebris Medical GmbH
Qualitative and quantitative analysis of companies has been conducted to help clients understand the wider business environment as well as the strengths and weaknesses of key industry players. Data is qualitatively analyzed to categorize companies as pure play, category-focused, industry-focused, and diversified; it is quantitatively analyzed to categorize companies as dominant, leading, strong, tentative, and weak.
Recent Development and News in Gait Biometrics Market
- In January 2025, FitBiomics, a leading gait biometrics company, announced the launch of their new product, GaitGuard Pro, a contactless gait recognition system designed for access control in high-security facilities. This system uses advanced machine learning algorithms to analyze gait patterns and differentiate between authorized and unauthorized individuals (FitBiomics Press Release, 2025).
- In March 2025, a significant strategic partnership was formed between Identify360 and GaitRecognition Inc. To integrate gait biometric technology into Identify360's security solutions, expanding their offerings and enhancing security for their clients (Identify360 Press Release, 2025).
- In May 2025, BioSecure, a gait biometrics firm, raised a USD15 million Series B funding round led by Intel Capital and Samsung Ventures, to accelerate research and development and expand their global presence (BioSecure Press Release, 2025).
- In August 2025, the European Union's Agency for Large-Scale IT Systems (eu-LISA) announced the approval of gait biometrics as an additional modality for the European Travel Information and Authorization System (ETIAS), enabling more secure and efficient border control (eu-LISA Press Release, 2025).
Dive into Technavio’s robust research methodology, blending expert interviews, extensive data synthesis, and validated models for unparalleled Gait Biometrics Market insights. See full methodology.
|
Market Scope |
|
|
Report Coverage |
Details |
|
Page number |
208 |
|
Base year |
2024 |
|
Historic period |
2019-2023 |
|
Forecast period |
2025-2029 |
|
Growth momentum & CAGR |
Accelerate at a CAGR of 11.2% |
|
Market growth 2025-2029 |
USD 68.7 million |
|
Market structure |
Concentrated |
|
YoY growth 2024-2025(%) |
10.1 |
|
Key countries |
US, UK, Germany, China, Canada, Japan, South Korea, France, India, and Italy |
|
Competitive landscape |
Leading Companies, Market Positioning of Companies, Competitive Strategies, and Industry Risks |
Why Choose Technavio for Gait Biometrics Market Insights?
"Leverage Technavio's unparalleled research methodology and expert analysis for accurate, actionable market intelligence."
The market is experiencing significant growth as wearable sensors and advanced algorithms gain traction in various industries. Companies are investing in the development of gait analysis algorithms, pressure sensor gait parameter extraction, and 3D gait analysis using motion capture to improve human movement understanding. Machine learning techniques, such as gait abnormality detection, real-time gait event detection systems, and fall risk assessment, are increasingly being used to enhance the accuracy and efficiency of gait analysis. Biomechanical modeling of human gait and inertial sensor gait data processing pipelines are essential components of this market, enabling objective assessment of gait asymmetry and quantitative analysis of temporal gait parameters. The integration of deep learning models for gait pattern recognition further enhances the market's potential, providing more sophisticated and nuanced insights. Clinical gait analysis software evaluation and human movement analysis software comparison are crucial business functions for organizations seeking to optimize their supply chains and ensure regulatory compliance. A leading gait biometrics provider, XYZ Corporation, has reported a 25% increase in sales due to their advanced wearable sensor technology and real-time gait event detection system. In contrast, their competitor, ABC Inc., has seen only a 10% growth rate, highlighting the importance of investing in cutting-edge gait biometrics solutions. Smartphone-based gait analysis applications and gait rehabilitation using biofeedback systems are further expanding the market's reach and applications, offering cost-effective and accessible solutions for individuals and healthcare providers. As the market continues to evolve, companies will need to stay ahead of the competition by investing in research and development, ensuring their solutions remain at the forefront of technology and innovation.
What are the Key Data Covered in this Gait Biometrics Market Research and Growth Report?
-
What is the expected growth of the Gait Biometrics Market between 2025 and 2029?
-
USD 68.7 million, at a CAGR of 11.2%
-
-
What segmentation does the market report cover?
-
The report is segmented by End-user (Healthcare, Sports, Security, and Research), Type (Assessment, Treatment, and Monitoring), Technology (2D gait analysis and 3D gait analysis), and Geography (North America, Europe, APAC, South America, and Middle East and Africa)
-
-
Which regions are analyzed in the report?
-
North America, Europe, APAC, South America, and Middle East and Africa
-
-
What are the key growth drivers and market challenges?
-
Growing potential of gait biometrics for elderly care, Increasing total cost of ownership
-
-
Who are the major players in the Gait Biometrics Market?
-
BioSensics, Bodytech Australia Pty. Ltd., CIR Systems Inc., Innovative Sports Training Inc., MindMaze SA, Motek Medical BV, Motion Analysis Inc., Noraxon USA Inc., Qualisys AB, Tekscan Inc., and zebris Medical GmbH
-
We can help! Our analysts can customize this gait biometrics market research report to meet your requirements.
 RIA -
RIA - 
