Behavioral Biometric Market Analysis North America, APAC, Europe, South America, Middle East and Africa - US, China, Japan, UK, Germany - Size and Forecast 2024-2028

Behavioral Biometric Market Analysis North America, APAC, Europe, South America, Middle East and Africa - US, China, Japan, UK, Germany - Size and Forecast 2024-2028

Published: Feb 2024 165 Pages SKU: IRTNTR77513

Market Overview at a Glance

$14.33 B
Market Opportunity
26.65%
CAGR
25.87
YoY growth 2023-2024(%)

Behavioral Biometric Market Size 2024-2028

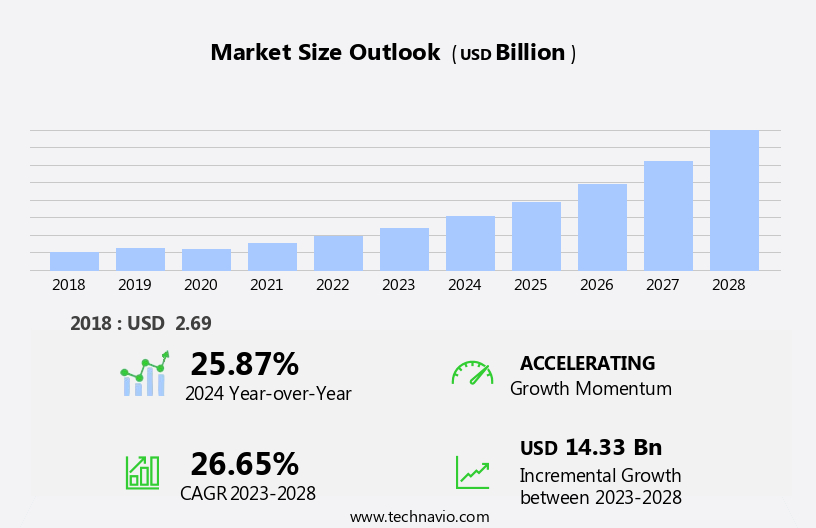
The behavioral biometric market size is forecast to increase by USD 14.33 billion at a CAGR of 26.65% between 2023 and 2028.

  • Behavioral biometrics is an emerging technology that utilizes user behavior patterns to ensure security and enhance user experience. The market for behavioral biometrics is experiencing significant growth due to several key trends. Firstly, the increasing concern for cybersecurity is driving the adoption of behavioral biometrics as an additional layer of security. Secondly, the combination of multiple biometric modalities is becoming increasingly popular, as it provides a more comprehensive and accurate identification solution. However, the market also faces challenges, such as the increasing misuse of personal information and privacy concerns. Despite these challenges, the future of behavioral biometrics looks promising, with continued innovation and advancements in technology expected to drive growth In the market.
  • Overall, the behavioral biometrics market is poised for significant growth, as it offers a more secure and convenient identification solution for businesses and consumers alike.
  • What will be the Size of the Behavioral Biometric Market During the Forecast Period?

    Behavioral Biometric Market Size

     Request Free Sample

  • The market encompasses the use of unique human attributes, such as keystroke dynamics, swipe analysis, touch analysis, mouse interactions, cognitive biometrics, and physical biometrics, for user verification and fraud prevention in various digital contexts. Behavioral biometrics offer a more frictionless and continuous authentication experience compared to traditional methods, such as fingerprints, facial patterns, iris characteristics, and voiceprints. These advanced verification methods analyze user proclivities and interactions with devices to detect anomalous behavior indicative of higher-risk events, including account opening fraud, account takeover, scams, and other forms of cybercrime. By recognizing and adapting to individual user behaviors, behavioral biometrics enable personalized experiences, increased trust, and reduced friction during online transactions and website interaction.
  • The market is experiencing significant growth due to the increasing prevalence of digital devices and the rising need for robust security solutions to protect against evolving fraud threats.
  • How is this Behavioral Biometric Industry segmented and which is the largest segment?

    The behavioral biometric industry research report provides comprehensive data (region-wise segment analysis), with forecasts and estimates in "USD billion" for the period 2024-2028, as well as historical data from 2018-2022 for the following segments.

    • End-user
      • Government
      • BFSI
      • Automotive
      • Healthcare
      • Others
    • Technology
      • Voice recognition
      • Signature recognition
      • Keystroke recognition
      • Gait analysis
    • Geography
      • North America
        • US
      • APAC
        • China
        • Japan
      • Europe
        • Germany
        • UK
      • South America
        • Middle East and Africa

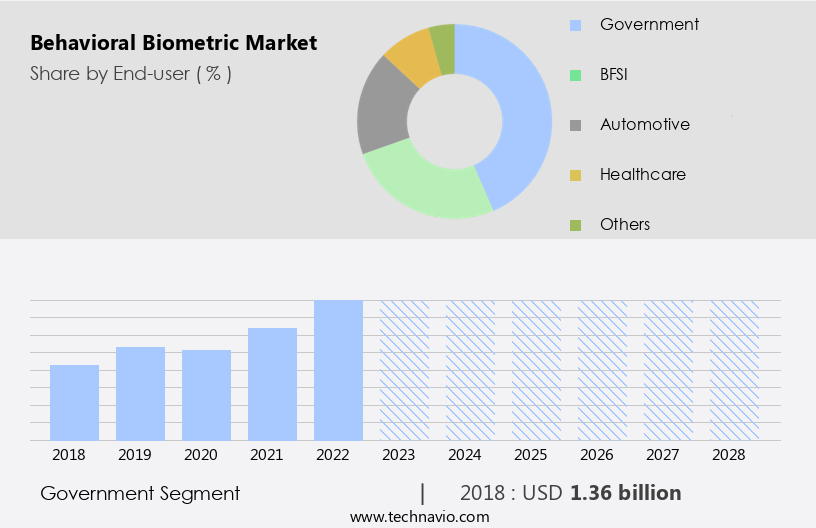
        By End-user Insights

        • The government segment is estimated to witness significant growth during the forecast period.

        Behavioral biometrics is a critical technology in modern security solutions, with significant growth in various sectors, particularly the government. The need for enhanced security measures, border control, and public safety drives the adoption of behavioral biometrics by government entities. Applications include access control to critical areas, identity verification for law enforcement, and securing digital government platforms. Behavioral biometrics, such as keystroke dynamics, swipe analysis, touch analysis, mouse interactions, cognitive biometrics, and physical biometrics like fingerprints, facial patterns, iris characteristics, and voiceprints, offer unique human attributes for user verification. These technologies improve the accuracy and reliability of identity verification processes, ensuring secure access to sensitive databases and infrastructure.

        In border control and immigration, behavioral biometrics are used to authenticate travelers' identities through facial and voice recognition. The integration of behavioral biometrics enhances security, prevents fraudulent activities, and provides personalized experiences with minimal friction. Emerging technologies, such as continuous authentication and monitoring, offer increased security and adaptability in preventing higher-risk events, including account opening fraud, account takeover, scams, and cybercriminal attacks.

        Behavioral Biometric Market Size

        Get a glance at the  Behavioral Biometric Industry report of share of various segments Request Free Sample

        The Government segment was valued at USD 1.36 billion in 2018 and showed a gradual increase during the forecast period.
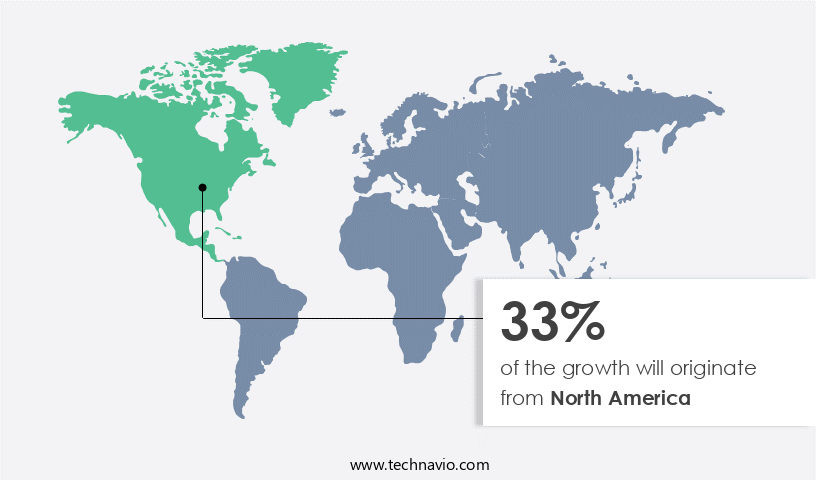
        Regional Analysis

        • North America is estimated to contribute 33% to the growth of the global market during the forecast period.

        Technavio’s analysts have elaborately explained the regional trends and drivers that shape the market during the forecast period.

        Behavioral Biometric Market Share by Geography

        For more insights on the market share of various regions, Request Free Sample

        Behavioral biometrics, which involves analyzing user proclivities, interactions, and unique human attributes, has gained significant traction in North America due to escalating cybersecurity threats and the increasing importance of secure identity verification. This market growth is fueled by the widespread use of digital devices and online transactions, necessitating advanced verification methods. Keystroke dynamics, swipe analysis, touch analysis, mouse interactions, cognitive biometrics, and physical biometrics such as fingerprints, facial patterns, iris characteristics, and voiceprints are all integral to behavioral biometrics. These technologies enable continuous authentication and monitoring, ensuring security during financial transactions and the protection of sensitive data. Organizations in various sectors, including finance, healthcare, and e-commerce, are adopting behavioral biometrics for customer recognition, personalized experiences, and fraud prevention.

        Regulatory initiatives promoting data security and privacy further bolster market expansion. The advanced technological infrastructure and high cybersecurity awareness in North America provide a conducive environment for the implementation of behavioral biometrics solutions.

        Market Dynamics

        Our  researchers analyzed the data with 2023 as the base year, along with the key drivers, trends, and challenges. A holistic analysis of drivers will help companies refine their marketing strategies to gain a competitive advantage.

        What are the key market drivers leading to the rise In the adoption of Behavioral Biometric Industry?

        Increasing cybersecurity concerns driving behavioral biometrics is the key driver of the market.

      • Behavioral biometrics is a cutting-edge technology that offers enhanced security by analyzing an individual's unique behavioral patterns during interactions with digital devices. This dynamic approach to user verification goes beyond traditional methods like passwords and physical biometrics, such as fingerprints or facial patterns, by focusing on cognitive and physical behaviors. Keystroke dynamics, swipe analysis, touch analysis, mouse interactions, and cognitive biometrics are some of the behavioral biometric methods used to create a user profile. In the digital age, where online transactions and website interactions are commonplace, behavioral biometrics plays a crucial role in detecting potential fraud and suspicious activities.
      • Financial institutions, in particular, benefit from this technology as it helps prevent account opening fraud, account takeover, scams, and other cybercrimes. By continuously monitoring user activity and comparing it against established behavioral patterns, behavioral biometrics can identify anomalies and signals of automation, potentially preventing fraudulent behavior. Behavioral biometrics also offers a streamlined user experience by eliminating the need for frequent password changes and providing personalized experiences based on user behavior. However, it is essential to balance security with user convenience, as increased friction may limit adaptability and hinder the user experience. Emerging technologies, such as continuous authentication and monitoring, aim to provide a frictionless experience while maintaining a high level of security.
      • In conclusion, behavioral biometrics offers a powerful solution to the growing threat of cybercrime by providing an additional layer of security through the analysis of unique human attributes. By focusing on user behavior, this technology can detect potential fraud and suspicious activities, ultimately enhancing security and protecting sensitive data.
      • What are the market trends shaping the Behavioral Biometric Industry?

        Combining multiple biometric modalities is the upcoming market trend.

      • The market is witnessing significant growth as organizations seek to enhance security and user experience through the use of unique human attributes for verification. Behavioral biometrics, which includes proclivities such as keystroke dynamics, swipe analysis, touch analysis, cognitive biometrics, and mouse interactions, provide valuable insights into user behavior and interactions with digital devices. These behaviors are distinct and consistent for each individual, making them ideal for user recognition and fraud prevention. Physical biometrics, such as fingerprints, facial patterns, and iris characteristics, are commonly used for user verification. However, behavioral biometrics offer a dynamic approach that continuously monitors user activity and adapts to changing patterns.
      • This is particularly useful in online transactions, where trust is paramount and fraud is a constant threat. Behavioral biometrics can detect suspicious activities, such as account opening fraud, account takeover, scams, and automation signals. They can also identify potential fraudulent behavior, such as compromised credentials and social engineering attacks, even before they result in financial losses or sensitive data breaches. Continuous authentication and monitoring provide an added layer of security, ensuring that only authorized users have access to sensitive information. Behavioral biometrics offer a frictionless experience, minimizing the need for frequent re-authentication and enhancing user satisfaction. Emerging technologies, such as deep fakes and voiceprints, are also being explored In the market.
      • These technologies offer new opportunities for user recognition and fraud prevention, but also present challenges in terms of adaptability and potential misuse by cybercriminals. In conclusion, the market is poised for growth as organizations seek to improve security and user experience through the use of unique human attributes for verification. Behavioral biometrics offer a dynamic and comprehensive approach to user recognition and fraud prevention, making them an essential component of modern cybersecurity strategies.
      • What challenges does the Behavioral Biometric Industry face during its growth?

        Increasing misuse of personal information is a key challenge affecting the industry growth.

      • The market is experiencing significant growth as businesses seek to enhance user verification and fraud prevention methods. Proclivities and interactions on digital devices are analyzed through biometric behaviors such as keystroke dynamics, swipe analysis, touch analysis, mouse interactions, cognitive biometrics, and physical biometrics like fingerprints, facial patterns, iris characteristics, and voiceprints. These unique human attributes enable trust in online transactions and customer recognition, providing personalized experiences while minimizing friction. However, the deployment of behavioral biometrics is not without challenges. Concerns over privacy and potential misuse of sensitive data have arisen, with the rigorous analysis of data privacy legislation adding complexity.
      • The possibility of fraudulent behavior, cybercriminals, compromised credentials, social engineering attacks, deep fakes, and suspicious activities necessitates continuous authentication and monitoring for security. Behavioral biometrics offer a dynamic approach to user activity patterns and device interactions, providing a streamlined experience while maintaining security. However, the market faces limitations in adaptability and increased friction for higher-risk events, such as account opening fraud, account takeover, and scams. Emerging technologies continue to shape the behavioral biometric landscape, offering potential solutions to these challenges. Despite these considerations, the market's potential benefits in fraud prevention and continuous authentication make it a valuable tool for businesses.
      • Exclusive Customer Landscape

        The behavioral biometric market forecasting report includes the adoption lifecycle of the market, covering from the innovator’s stage to the laggard’s stage. It focuses on adoption rates in different regions based on penetration. Furthermore, the behavioral biometric market report also includes key purchase criteria and drivers of price sensitivity to help companies evaluate and develop their market growth analysis strategies.
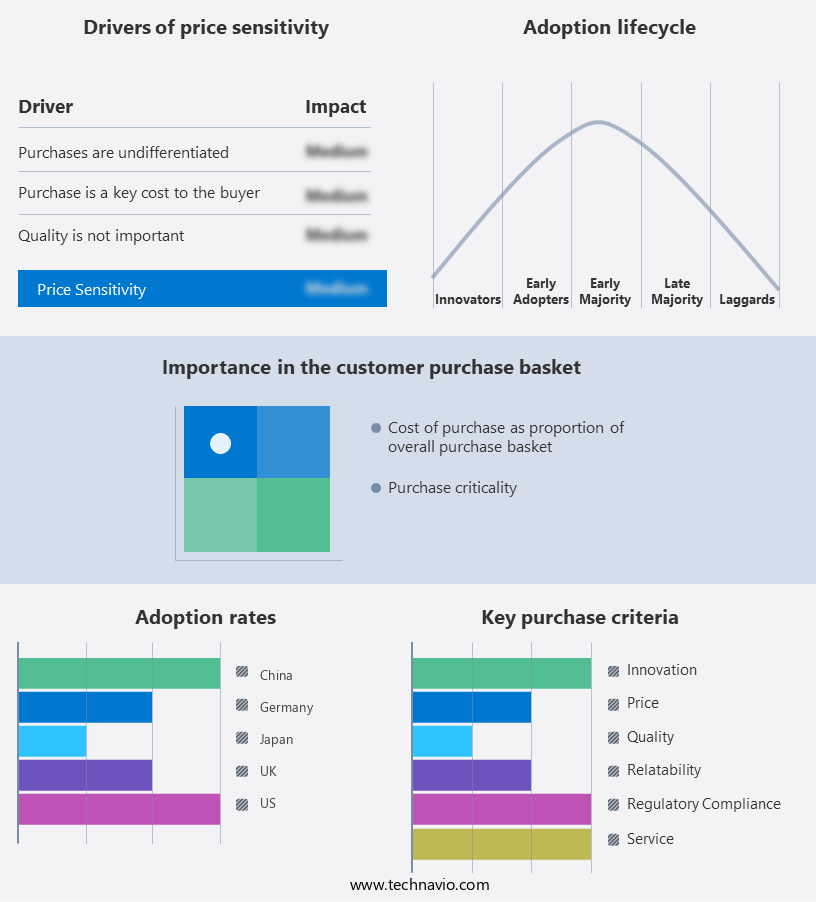
        Behavioral Biometric Market Share by Geography

         Customer Landscape

        Key Companies & Market Insights

        Companies are implementing various strategies, such as strategic alliances, behavioral biometric market forecast, partnerships, mergers and acquisitions, geographical expansion, and product/service launches, to enhance their presence In the industry.

        BIO key International Inc. - Behavioral biometrics is a cutting-edge technology that allows users to securely access multiple applications or systems using unique behavioral credentials. These credentials, which can include fingerprints, palm prints, facial features, or iris patterns, offer a more dynamic and nuanced approach to authentication than traditional methods. By analyzing user behavior patterns, behavioral biometric solutions provide an additional layer of security, helping to prevent unauthorized access and protect against fraud. This technology is an essential component of modern security strategies, empowering organizations to verify identity and enhance user experience in a seamless and efficient manner.

        The industry research and growth report includes detailed analyses of the competitive landscape of the market and information about key companies, including:

        • BIO key International Inc.
        • BioCatch Ltd.
        • Callsign Inc.
        • Deepnet Security
        • Fingerprint Cards AB
        • International Business Machines Corp.
        • Mangopay SA
        • Mastercard Inc.
        • Microsoft Corp.
        • Mitek Systems Inc.
        • Plurilock Security Inc
        • Prove Identity Inc.
        • Quest Software Inc.
        • RELX Plc
        • SecureAuth Corp.
        • ThreatMark
        • TypingDNA
        • Veridium IP Ltd.
        • XTN Cognitive Security Srl
        • Zighra Inc.

        Qualitative and quantitative analysis of companies has been conducted to help clients understand the wider business environment as well as the strengths and weaknesses of key industry players. Data is qualitatively analyzed to categorize companies as pure play, category-focused, industry-focused, and diversified; it is quantitatively analyzed to categorize companies as dominant, leading, strong, tentative, and weak.

        Research Analyst Overview

        Behavioral biometrics refers to the analysis of unique human attributes and interactions with digital devices to verify user identity and detect fraudulent activities. This approach utilizes various verification methods, including keystroke dynamics, swipe analysis, touch analysis, mouse interactions, cognitive biometrics, and physical biometrics such as fingerprints, facial patterns, and iris characteristics. Behavioral biometrics provides a dynamic and adaptive solution for user verification in online transactions and website interactions. It recognizes users based on their unique behavioral habits, including mouse movement, mobile phone usage, touch screen swiping, and keyboard typing. This method offers a frictionless experience for genuine transactions while increasing security by detecting potential fraud and suspicious activities.

        Fraudsters employ various tactics, such as account opening fraud, account takeover, scams, social engineering attacks, deep fakes, and compromised credentials, to bypass initial authentication and gain unauthorized access to sensitive data. Behavioral biometrics, with its continuous authentication and monitoring capabilities, can detect anomalies and signals of automation, providing an additional layer of security to prevent these threats. Trust is a crucial factor in online transactions, and behavioral biometrics plays a significant role in establishing trust between users and digital platforms. By recognizing authorized users based on their unique behavioral patterns, behavioral biometrics enables personalized experiences and reduces friction.

        However, behavioral biometrics also faces challenges, such as limited adaptability and increased friction. Emerging technologies, such as machine learning and artificial intelligence, are being explored to address these challenges and improve the overall effectiveness of behavioral biometrics. Behavioral biometrics offers a dynamic and continuous approach to user verification and fraud prevention, making it an essential tool for businesses in various industries, including finance, healthcare, and e-commerce, to secure their digital interactions and protect their customers' sensitive data.

        Market Scope

        Report Coverage

        Details

        Page number

        165

        Base year

        2023

        Historic period

        2018-2022

        Forecast period

        2024-2028

        Growth momentum & CAGR

        Accelerate at a CAGR of 26.65%

        Market growth 2024-2028

        USD 14.33 billion

        Market structure

        Fragmented

        YoY growth 2023-2024(%)

        25.87

        Key countries

        US, China, Japan, UK, and Germany

        Competitive landscape

        Leading Companies, Market Positioning of Companies, Competitive Strategies, and Industry Risks

        Request Free Sample

        What are the Key Data Covered in this Behavioral Biometric Market Research and Growth Report?

        • CAGR of the Behavioral Biometric industry during the forecast period
        • Detailed information on factors that will drive the growth and forecasting between 2024 and 2028
        • Precise estimation of the size of the market and its contribution of the industry in focus to the parent market
        • Accurate predictions about upcoming growth and trends and changes in consumer behaviour
        • Growth of the market across North America, APAC, Europe, South America, and Middle East and Africa
        • Thorough analysis of the market’s competitive landscape and detailed information about companies
        • Comprehensive analysis of factors that will challenge the behavioral biometric market growth of industry companies

        We can help! Our analysts can customize this behavioral biometric market research report to meet your requirements.

        Get in touch


        1 Executive Summary

        • 1.1 Market overview
          • Exhibit 01: Executive Summary – Chart on Market Overview
          • Exhibit 02: Executive Summary – Data Table on Market Overview
          • Exhibit 03: Executive Summary – Chart on Global Market Characteristics
          • Exhibit 04: Executive Summary – Chart on Market by Geography
          • Exhibit 05: Executive Summary – Chart on Market Segmentation by End-user
          • Exhibit 06: Executive Summary – Chart on Market Segmentation by Technology
          • Exhibit 07: Executive Summary – Chart on Incremental Growth
          • Exhibit 08: Executive Summary – Data Table on Incremental Growth
          • Exhibit 09: Executive Summary – Chart on Vendor Market Positioning

        2 Market Landscape

        • 2.1 Market ecosystem
          • Exhibit 10: Parent market
          • Exhibit 11: Market Characteristics

        3 Market Sizing

        • 3.1 Market definition
          • Exhibit 12: Offerings of vendors included in the market definition
        • 3.2 Market segment analysis
          • Exhibit 13: Market segments
        • 3.3 Market size 2023
          • 3.4 Market outlook: Forecast for 2023-2028
            • Exhibit 14: Chart on Global - Market size and forecast 2023-2028 ($ billion)
            • Exhibit 15: Data Table on Global - Market size and forecast 2023-2028 ($ billion)
            • Exhibit 16: Chart on Global Market: Year-over-year growth 2023-2028 (%)
            • Exhibit 17: Data Table on Global Market: Year-over-year growth 2023-2028 (%)

          4 Historic Market Size

          • 4.1 Global behavioral biometric market 2018 - 2022
            • Exhibit 18: Historic Market Size – Data Table on global behavioral biometric market 2018 - 2022 ($ billion)
          • 4.2 End-user Segment Analysis 2018 - 2022
            • Exhibit 19: Historic Market Size – End-user Segment 2018 - 2022 ($ billion)
          • 4.3 Technology Segment Analysis 2018 - 2022
            • Exhibit 20: Historic Market Size – Technology Segment 2018 - 2022 ($ billion)
          • 4.4 Geography Segment Analysis 2018 - 2022
            • Exhibit 21: Historic Market Size – Geography Segment 2018 - 2022 ($ billion)
          • 4.5 Country Segment Analysis 2018 - 2022
            • Exhibit 22: Historic Market Size – Country Segment 2018 - 2022 ($ billion)

          5 Five Forces Analysis

          • 5.1 Five forces summary
            • Exhibit 23: Five forces analysis - Comparison between 2023 and 2028
          • 5.2 Bargaining power of buyers
            • Exhibit 24: Chart on Bargaining power of buyers – Impact of key factors 2023 and 2028
          • 5.3 Bargaining power of suppliers
            • Exhibit 25: Bargaining power of suppliers – Impact of key factors in 2023 and 2028
          • 5.4 Threat of new entrants
            • Exhibit 26: Threat of new entrants – Impact of key factors in 2023 and 2028
          • 5.5 Threat of substitutes
            • Exhibit 27: Threat of substitutes – Impact of key factors in 2023 and 2028
          • 5.6 Threat of rivalry
            • Exhibit 28: Threat of rivalry – Impact of key factors in 2023 and 2028
          • 5.7 Market condition
            • Exhibit 29: Chart on Market condition - Five forces 2023 and 2028

          6 Market Segmentation by End-user

          • 6.1 Market segments
            • Exhibit 30: Chart on End-user - Market share 2023-2028 (%)
            • Exhibit 31: Data Table on End-user - Market share 2023-2028 (%)
          • 6.2 Comparison by End-user
            • Exhibit 32: Chart on Comparison by End-user
            • Exhibit 33: Data Table on Comparison by End-user
          • 6.3 Government - Market size and forecast 2023-2028
            • Exhibit 34: Chart on Government - Market size and forecast 2023-2028 ($ billion)
            • Exhibit 35: Data Table on Government - Market size and forecast 2023-2028 ($ billion)
            • Exhibit 36: Chart on Government - Year-over-year growth 2023-2028 (%)
            • Exhibit 37: Data Table on Government - Year-over-year growth 2023-2028 (%)
          • 6.4 BFSI - Market size and forecast 2023-2028
            • Exhibit 38: Chart on BFSI - Market size and forecast 2023-2028 ($ billion)
            • Exhibit 39: Data Table on BFSI - Market size and forecast 2023-2028 ($ billion)
            • Exhibit 40: Chart on BFSI - Year-over-year growth 2023-2028 (%)
            • Exhibit 41: Data Table on BFSI - Year-over-year growth 2023-2028 (%)
          • 6.5 Automotive - Market size and forecast 2023-2028
            • Exhibit 42: Chart on Automotive - Market size and forecast 2023-2028 ($ billion)
            • Exhibit 43: Data Table on Automotive - Market size and forecast 2023-2028 ($ billion)
            • Exhibit 44: Chart on Automotive - Year-over-year growth 2023-2028 (%)
            • Exhibit 45: Data Table on Automotive - Year-over-year growth 2023-2028 (%)
          • 6.6 Healthcare - Market size and forecast 2023-2028
            • Exhibit 46: Chart on Healthcare - Market size and forecast 2023-2028 ($ billion)
            • Exhibit 47: Data Table on Healthcare - Market size and forecast 2023-2028 ($ billion)
            • Exhibit 48: Chart on Healthcare - Year-over-year growth 2023-2028 (%)
            • Exhibit 49: Data Table on Healthcare - Year-over-year growth 2023-2028 (%)
          • 6.7 Others - Market size and forecast 2023-2028
            • Exhibit 50: Chart on Others - Market size and forecast 2023-2028 ($ billion)
            • Exhibit 51: Data Table on Others - Market size and forecast 2023-2028 ($ billion)
            • Exhibit 52: Chart on Others - Year-over-year growth 2023-2028 (%)
            • Exhibit 53: Data Table on Others - Year-over-year growth 2023-2028 (%)
          • 6.8 Market opportunity by End-user
            • Exhibit 54: Market opportunity by End-user ($ billion)
            • Exhibit 55: Data Table on Market opportunity by End-user ($ billion)

          7 Market Segmentation by Technology

          • 7.1 Market segments
            • Exhibit 56: Chart on Technology - Market share 2023-2028 (%)
            • Exhibit 57: Data Table on Technology - Market share 2023-2028 (%)
          • 7.2 Comparison by Technology
            • Exhibit 58: Chart on Comparison by Technology
            • Exhibit 59: Data Table on Comparison by Technology
          • 7.3 Voice recognition - Market size and forecast 2023-2028
            • Exhibit 60: Chart on Voice recognition - Market size and forecast 2023-2028 ($ billion)
            • Exhibit 61: Data Table on Voice recognition - Market size and forecast 2023-2028 ($ billion)
            • Exhibit 62: Chart on Voice recognition - Year-over-year growth 2023-2028 (%)
            • Exhibit 63: Data Table on Voice recognition - Year-over-year growth 2023-2028 (%)
          • 7.4 Signature recognition - Market size and forecast 2023-2028
            • Exhibit 64: Chart on Signature recognition - Market size and forecast 2023-2028 ($ billion)
            • Exhibit 65: Data Table on Signature recognition - Market size and forecast 2023-2028 ($ billion)
            • Exhibit 66: Chart on Signature recognition - Year-over-year growth 2023-2028 (%)
            • Exhibit 67: Data Table on Signature recognition - Year-over-year growth 2023-2028 (%)
          • 7.5 Keystroke recognition - Market size and forecast 2023-2028
            • Exhibit 68: Chart on Keystroke recognition - Market size and forecast 2023-2028 ($ billion)
            • Exhibit 69: Data Table on Keystroke recognition - Market size and forecast 2023-2028 ($ billion)
            • Exhibit 70: Chart on Keystroke recognition - Year-over-year growth 2023-2028 (%)
            • Exhibit 71: Data Table on Keystroke recognition - Year-over-year growth 2023-2028 (%)
          • 7.6 Gait analysis - Market size and forecast 2023-2028
            • Exhibit 72: Chart on Gait analysis - Market size and forecast 2023-2028 ($ billion)
            • Exhibit 73: Data Table on Gait analysis - Market size and forecast 2023-2028 ($ billion)
            • Exhibit 74: Chart on Gait analysis - Year-over-year growth 2023-2028 (%)
            • Exhibit 75: Data Table on Gait analysis - Year-over-year growth 2023-2028 (%)
          • 7.7 Market opportunity by Technology
            • Exhibit 76: Market opportunity by Technology ($ billion)
            • Exhibit 77: Data Table on Market opportunity by Technology ($ billion)

          8 Customer Landscape

          • 8.1 Customer landscape overview
            • Exhibit 78: Analysis of price sensitivity, lifecycle, customer purchase basket, adoption rates, and purchase criteria

          9 Geographic Landscape

          • 9.1 Geographic segmentation
            • Exhibit 79: Chart on Market share by geography 2023-2028 (%)
            • Exhibit 80: Data Table on Market share by geography 2023-2028 (%)
          • 9.2 Geographic comparison
            • Exhibit 81: Chart on Geographic comparison
            • Exhibit 82: Data Table on Geographic comparison
          • 9.3 North America - Market size and forecast 2023-2028
            • Exhibit 83: Chart on North America - Market size and forecast 2023-2028 ($ billion)
            • Exhibit 84: Data Table on North America - Market size and forecast 2023-2028 ($ billion)
            • Exhibit 85: Chart on North America - Year-over-year growth 2023-2028 (%)
            • Exhibit 86: Data Table on North America - Year-over-year growth 2023-2028 (%)
          • 9.4 APAC - Market size and forecast 2023-2028
            • Exhibit 87: Chart on APAC - Market size and forecast 2023-2028 ($ billion)
            • Exhibit 88: Data Table on APAC - Market size and forecast 2023-2028 ($ billion)
            • Exhibit 89: Chart on APAC - Year-over-year growth 2023-2028 (%)
            • Exhibit 90: Data Table on APAC - Year-over-year growth 2023-2028 (%)
          • 9.5 Europe - Market size and forecast 2023-2028
            • Exhibit 91: Chart on Europe - Market size and forecast 2023-2028 ($ billion)
            • Exhibit 92: Data Table on Europe - Market size and forecast 2023-2028 ($ billion)
            • Exhibit 93: Chart on Europe - Year-over-year growth 2023-2028 (%)
            • Exhibit 94: Data Table on Europe - Year-over-year growth 2023-2028 (%)
          • 9.6 South America - Market size and forecast 2023-2028
            • Exhibit 95: Chart on South America - Market size and forecast 2023-2028 ($ billion)
            • Exhibit 96: Data Table on South America - Market size and forecast 2023-2028 ($ billion)
            • Exhibit 97: Chart on South America - Year-over-year growth 2023-2028 (%)
            • Exhibit 98: Data Table on South America - Year-over-year growth 2023-2028 (%)
          • 9.7 Middle East and Africa - Market size and forecast 2023-2028
            • Exhibit 99: Chart on Middle East and Africa - Market size and forecast 2023-2028 ($ billion)
            • Exhibit 100: Data Table on Middle East and Africa - Market size and forecast 2023-2028 ($ billion)
            • Exhibit 101: Chart on Middle East and Africa - Year-over-year growth 2023-2028 (%)
            • Exhibit 102: Data Table on Middle East and Africa - Year-over-year growth 2023-2028 (%)
          • 9.8 US - Market size and forecast 2023-2028
            • Exhibit 103: Chart on US - Market size and forecast 2023-2028 ($ billion)
            • Exhibit 104: Data Table on US - Market size and forecast 2023-2028 ($ billion)
            • Exhibit 105: Chart on US - Year-over-year growth 2023-2028 (%)
            • Exhibit 106: Data Table on US - Year-over-year growth 2023-2028 (%)
          • 9.9 China - Market size and forecast 2023-2028
            • Exhibit 107: Chart on China - Market size and forecast 2023-2028 ($ billion)
            • Exhibit 108: Data Table on China - Market size and forecast 2023-2028 ($ billion)
            • Exhibit 109: Chart on China - Year-over-year growth 2023-2028 (%)
            • Exhibit 110: Data Table on China - Year-over-year growth 2023-2028 (%)
          • 9.10 Japan - Market size and forecast 2023-2028
            • Exhibit 111: Chart on Japan - Market size and forecast 2023-2028 ($ billion)
            • Exhibit 112: Data Table on Japan - Market size and forecast 2023-2028 ($ billion)
            • Exhibit 113: Chart on Japan - Year-over-year growth 2023-2028 (%)
            • Exhibit 114: Data Table on Japan - Year-over-year growth 2023-2028 (%)
          • 9.11 UK - Market size and forecast 2023-2028
            • Exhibit 115: Chart on UK - Market size and forecast 2023-2028 ($ billion)
            • Exhibit 116: Data Table on UK - Market size and forecast 2023-2028 ($ billion)
            • Exhibit 117: Chart on UK - Year-over-year growth 2023-2028 (%)
            • Exhibit 118: Data Table on UK - Year-over-year growth 2023-2028 (%)
          • 9.12 Germany - Market size and forecast 2023-2028
            • Exhibit 119: Chart on Germany - Market size and forecast 2023-2028 ($ billion)
            • Exhibit 120: Data Table on Germany - Market size and forecast 2023-2028 ($ billion)
            • Exhibit 121: Chart on Germany - Year-over-year growth 2023-2028 (%)
            • Exhibit 122: Data Table on Germany - Year-over-year growth 2023-2028 (%)
          • 9.13 Market opportunity by geography
            • Exhibit 123: Market opportunity by geography ($ billion)
            • Exhibit 124: Data Tables on Market opportunity by geography ($ billion)

          10 Drivers, Challenges, and Trends

          • 10.1 Market drivers
            • 10.2 Market challenges
              • 10.3 Impact of drivers and challenges
                • Exhibit 125: Impact of drivers and challenges in 2023 and 2028
              • 10.4 Market trends

                11 Vendor Landscape

                • 11.1 Overview
                  • 11.2 Vendor landscape
                    • Exhibit 126: Overview on Criticality of inputs and Factors of differentiation
                  • 11.3 Landscape disruption
                    • Exhibit 127: Overview on factors of disruption
                  • 11.4 Industry risks
                    • Exhibit 128: Impact of key risks on business

                  12 Vendor Analysis

                  • 12.1 Vendors covered
                    • Exhibit 129: Vendors covered
                  • 12.2 Market positioning of vendors
                    • Exhibit 130: Matrix on vendor position and classification
                  • 12.3 BIO key International Inc.
                    • Exhibit 131: BIO key International Inc. - Overview
                    • Exhibit 132: BIO key International Inc. - Business segments
                    • Exhibit 133: BIO key International Inc. - Key news
                    • Exhibit 134: BIO key International Inc. - Key offerings
                    • Exhibit 135: BIO key International Inc. - Segment focus
                  • 12.4 BioCatch Ltd.
                    • Exhibit 136: BioCatch Ltd. - Overview
                    • Exhibit 137: BioCatch Ltd. - Product / Service
                    • Exhibit 138: BioCatch Ltd. - Key offerings
                  • 12.5 Callsign Inc.
                    • Exhibit 139: Callsign Inc. - Overview
                    • Exhibit 140: Callsign Inc. - Product / Service
                    • Exhibit 141: Callsign Inc. - Key offerings
                  • 12.6 International Business Machines Corp.
                    • Exhibit 142: International Business Machines Corp. - Overview
                    • Exhibit 143: International Business Machines Corp. - Business segments
                    • Exhibit 144: International Business Machines Corp. - Key news
                    • Exhibit 145: International Business Machines Corp. - Key offerings
                    • Exhibit 146: International Business Machines Corp. - Segment focus
                  • 12.7 Mastercard Inc.
                    • Exhibit 147: Mastercard Inc. - Overview
                    • Exhibit 148: Mastercard Inc. - Product / Service
                    • Exhibit 149: Mastercard Inc. - Key news
                    • Exhibit 150: Mastercard Inc. - Key offerings
                  • 12.8 Microsoft Corp.
                    • Exhibit 151: Microsoft Corp. - Overview
                    • Exhibit 152: Microsoft Corp. - Business segments
                    • Exhibit 153: Microsoft Corp. - Key news
                    • Exhibit 154: Microsoft Corp. - Key offerings
                    • Exhibit 155: Microsoft Corp. - Segment focus
                  • 12.9 Mitek Systems Inc.
                    • Exhibit 156: Mitek Systems Inc. - Overview
                    • Exhibit 157: Mitek Systems Inc. - Product / Service
                    • Exhibit 158: Mitek Systems Inc. - Key news
                    • Exhibit 159: Mitek Systems Inc. - Key offerings
                  • 12.10 Plurilock Security Inc
                    • Exhibit 160: Plurilock Security Inc - Overview
                    • Exhibit 161: Plurilock Security Inc - Product / Service
                    • Exhibit 162: Plurilock Security Inc - Key offerings
                  • 12.11 Quest Software Inc.
                    • Exhibit 163: Quest Software Inc. - Overview
                    • Exhibit 164: Quest Software Inc. - Product / Service
                    • Exhibit 165: Quest Software Inc. - Key offerings
                  • 12.12 RELX Plc
                    • Exhibit 166: RELX Plc - Overview
                    • Exhibit 167: RELX Plc - Business segments
                    • Exhibit 168: RELX Plc - Key offerings
                    • Exhibit 169: RELX Plc - Segment focus
                  • 12.13 SecureAuth Corp.
                    • Exhibit 170: SecureAuth Corp. - Overview
                    • Exhibit 171: SecureAuth Corp. - Product / Service
                    • Exhibit 172: SecureAuth Corp. - Key offerings
                  • 12.14 ThreatMark
                    • Exhibit 173: ThreatMark - Overview
                    • Exhibit 174: ThreatMark - Product / Service
                    • Exhibit 175: ThreatMark - Key offerings
                  • 12.15 TypingDNA
                    • Exhibit 176: TypingDNA - Overview
                    • Exhibit 177: TypingDNA - Product / Service
                    • Exhibit 178: TypingDNA - Key offerings
                  • 12.16 XTN Cognitive Security Srl
                    • Exhibit 179: XTN Cognitive Security Srl - Overview
                    • Exhibit 180: XTN Cognitive Security Srl - Product / Service
                    • Exhibit 181: XTN Cognitive Security Srl - Key offerings
                  • 12.17 Zighra Inc.
                    • Exhibit 182: Zighra Inc. - Overview
                    • Exhibit 183: Zighra Inc. - Product / Service
                    • Exhibit 184: Zighra Inc. - Key offerings

                  13 Appendix

                  • 13.1 Scope of the report
                    • 13.2 Inclusions and exclusions checklist
                      • Exhibit 185: Inclusions checklist
                      • Exhibit 186: Exclusions checklist
                    • 13.3 Currency conversion rates for US$
                      • Exhibit 187: Currency conversion rates for US$
                    • 13.4 Research methodology
                      • Exhibit 188: Research methodology
                      • Exhibit 189: Validation techniques employed for market sizing
                      • Exhibit 190: Information sources
                    • 13.5 List of abbreviations
                      • Exhibit 191: List of abbreviations

                    Research Methodology

                    Technavio presents a detailed picture of the market by way of study, synthesis, and summation of data from multiple sources. The analysts have presented the various facets of the market with a particular focus on identifying the key industry influencers. The data thus presented is comprehensive, reliable, and the result of extensive research, both primary and secondary.

                    INFORMATION SOURCES

                    Primary sources

                    • Manufacturers and suppliers
                    • Channel partners
                    • Industry experts
                    • Strategic decision makers

                    Secondary sources

                    • Industry journals and periodicals
                    • Government data
                    • Financial reports of key industry players
                    • Historical data
                    • Press releases

                    DATA ANALYSIS

                    Data Synthesis

                    • Collation of data
                    • Estimation of key figures
                    • Analysis of derived insights

                    Data Validation

                    • Triangulation with data models
                    • Reference against proprietary databases
                    • Corroboration with industry experts

                    REPORT WRITING

                    Qualitative

                    • Market drivers
                    • Market challenges
                    • Market trends
                    • Five forces analysis

                    Quantitative

                    • Market size and forecast
                    • Market segmentation
                    • Geographical insights
                    • Competitive landscape

                    Interested in this report?

                    Get your sample now to see our research methodology and insights!

                    Download Now

                    Frequently Asked Questions

                    Behavioral Biometric market growth will increase by $ 14.33 bn during 2024-2028.

                    The Behavioral Biometric market is expected to grow at a CAGR of 26.65% during 2024-2028.

                    Behavioral Biometric market is segmented by End-user( Government, BFSI, Automotive, Healthcare, Others) Technology( Voice recognition, Signature recognition, Keystroke recognition, Gait analysis)

                    BIO key International Inc., BioCatch Ltd., Callsign Inc., Deepnet Security, Fingerprint Cards AB, International Business Machines Corp., Mangopay SA, Mastercard Inc., Microsoft Corp., Mitek Systems Inc., Plurilock Security Inc, Prove Identity Inc., Quest Software Inc., RELX Plc, SecureAuth Corp., ThreatMark, TypingDNA, Veridium IP Ltd., XTN Cognitive Security Srl, Zighra Inc. are a few of the key vendors in the Behavioral Biometric market.

                    North America will register the highest growth rate of 33% among the other regions. Therefore, the Behavioral Biometric market in North America is expected to garner significant business opportunities for the vendors during the forecast period.

                    US, China, Japan, UK, Germany

                    • Increasing cybersecurity concerns driving behavioral biometricsThe global increase in cyber risks and fraud incidences is driving the adoption of behavioral biometrics as a means of improving security. As traditional authentication systems become vulnerable to sophisticated attacks is the driving factor this market.
                    • corporations are turning to behavioral biometrics to strengthen their defenses. This technology analyzes individual activity patterns is the driving factor this market.
                    • such as keystrokes is the driving factor this market.
                    • mouse movements is the driving factor this market.
                    • and typing dynamics is the driving factor this market.
                    • to generate a unique user profile. By continually investigating these behavioral characteristics is the driving factor this market.
                    • it adds an additional layer of security to traditional approaches such as passwords. In the financial sector is the driving factor this market.
                    • where phishing and account takeovers are common is the driving factor this market.
                    • behavioral biometrics become invaluable. It detects irregularities in user activity and issues alerts or requests additional verification in the event of a security breach. Similarly is the driving factor this market.
                    • in healthcare is the driving factor this market.
                    • which is increasingly targeted for sensitive patient data is the driving factor this market.
                    • behavioral biometrics protects access restrictions and provides a strong protection against unwanted access. The growing use of behavioral biometrics highlights a paradigm shift toward dynamic and adaptive security solutions is the driving factor this market.
                    • in which organizations prefer staying ahead of developing cyber threats by utilizing innovative technologies to protect sensitive data and ensure strong identity verification. Therefore is the driving factor this market.
                    • the increasing cybersecurity concerns driving behavioral biometrics will increase the adoption of behavioral biometrics is the driving factor this market.
                    • which is the driving factor this market.
                    • in turn is the driving factor this market.
                    • will drive the revenue growth of the global behavioral biometric market during the forecast period. is the driving factor this market.

                    The Behavioral Biometric market vendors should focus on grabbing business opportunities from the Government segment as it accounted for the largest market share in the base year.