Gallium Nitride (GaN) RF Devices Market Analysis APAC, Europe, North America, South America, Middle East and Africa - US, China, Japan, South Korea, Germany - Size and Forecast 2024-2028

Gallium Nitride (GaN) RF Devices Market Analysis APAC, Europe, North America, South America, Middle East and Africa - US, China, Japan, South Korea, Germany - Size and Forecast 2024-2028

Published: Jan 2024 177 Pages SKU: IRTNTR73623

Market Overview at a Glance

$1.61 B
Market Opportunity
17.42%
CAGR
17.22
YoY growth 2023-2024(%)

GaN RF Devices Market Size 2024-2028 

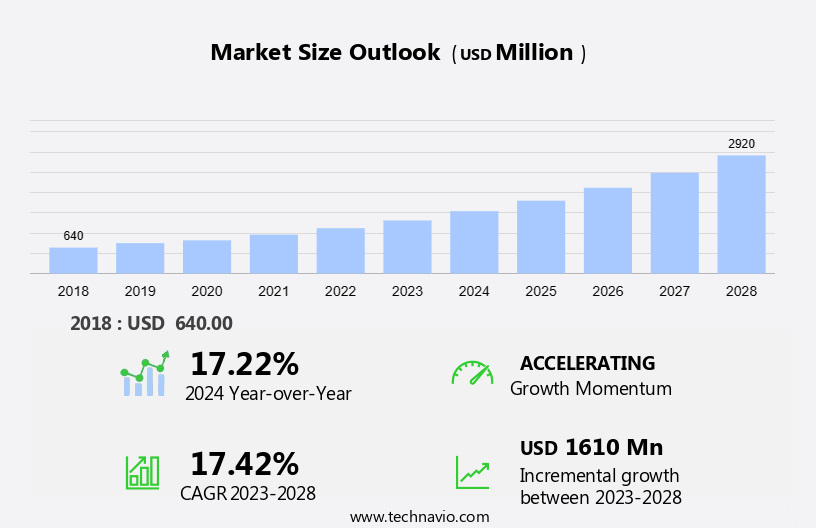
The GaN RF devices market size is forecast to increase by USD 1.61 billion at a CAGR of 17.42% between 2023 and 2028.

  • The market is experiencing significant growth due to the increasing use in broadcasting applications. GaN RF devices offer superior power handling capabilities and efficiency, making them an ideal choice for broadcasting applications. Another trend driving market growth is the growing prominence of GaN-on-Diamond technology, which provides enhanced power density and thermal management. Furthermore, GaN RF devices are also gaining popularity in aerospace, defense, optoelectronics, and quantum devices due to their high-temperature operation capabilities and energy efficiency. However, the high cost of raw materials and production process poses a challenge to market growth. Despite this, the market is expected to continue expanding due to the increasing demand for GaN RF devices in various end-use industries such as telecommunications, military and aerospace, and industrial automation. The market analysis report provides a comprehensive study of these trends and growth factors, offering valuable insights for stakeholders and market participants.

What will be the Size of the GaN RF Devices Market During the Forecast Period?

GaN RF Devices Market Size

 Request Free Sample

  • The High-Power Electronics (HPE) market, specifically In the realm of Gallium Nitride (GaN) RF devices, continues to experience significant growth due to their superior electrical and thermal properties. GaN RF devices exhibit excellent power handling capabilities and high electron mobility, making them ideal for use in various applications such as radio frequency amplifiers and power converters. The thermal properties of GaN RF devices are a critical factor In their performance. Phonons, quantum mechanical vibrations of the crystal lattice, significantly impact lattice thermal conductivity. First-principles modeling, including quantum perturbation theory and density functional theory, are employed to understand phonon distributions and thermal transport in GaN.
  • Moreover, GaN RF devices come in both p-type and n-type varieties, with the barrier height and specific contact resistivity being essential factors In their thermal stability. The development of AlGaN/GaN heterostructures and ternary alloys has led to enhanced device performance and improved thermal management. Nanostructures, such as quantum dots and nanowires, are also being explored to further optimize GaN RF devices' thermal and electrical properties.

How is this GaN RF Devices Industry segmented and which is the largest segment?

The GaN RF devices industry research report provides comprehensive data (region-wise segment analysis), with forecasts and estimates in "USD billion" for the period 2024-2028, as well as historical data from 2018-2022 for the following segments.

  • Application
    • Cellular infrastructure
    • Defense and military
    • CATV
    • Others
  • Material
    • GaN-on-Si
    • GaN-on-SiC
    • GaN-on-Diamond
  • Geography
    • APAC
      • China
      • Japan
      • South Korea
    • Europe
      • Germany
    • North America
      • US
    • South America
    • Middle East and Africa

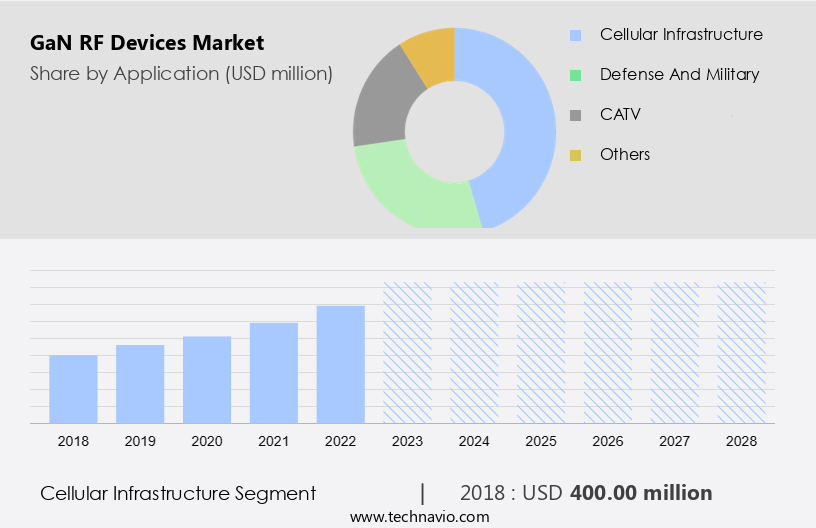
By Application Insights

  • The cellular infrastructure segment is estimated to witness significant growth during the forecast period.

GaN RF devices have gained significant traction In the telecommunications industry due to their high power density, switching frequency, and efficiency. These properties make GaN RF devices ideal for establishing 5G infrastructure, as they can handle more power than other high-frequency technologies and offer high instantaneous bandwidths, which are essential for wider frequency bands and carrier aggregation in telecom networks. The energy consumption in telecom networks primarily comes from the RF chain. GaN RF devices' superior properties, such as high power density, power added efficiency, and ease in impedance-matching, enable improved overall efficiency In the RF chain, making them indispensable for the implementation of 5G wireless networks. In data centers, GaN RF devices' ability to reduce carbon footprint and improve energy efficiency is a significant advantage.

GaN RF Devices Market Size

Get a glance at the  GaN RF Devices Industry report of share of various segments Request Free Sample

The cellular infrastructure segment was valued at USD 400.00 million in 2018 and showed a gradual increase during the forecast period.

Regional Analysis

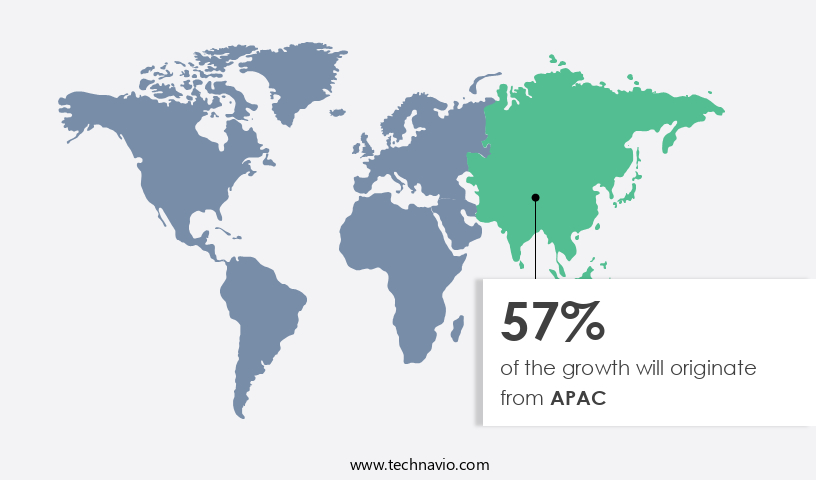
  • APAC is estimated to contribute 57% to the growth of the global market during the forecast period.

Technavio's analysts have elaborately explained the regional trends and drivers that shape the market during the forecast period.

GaN RF Devices Market Share by Geography

For more insights on the market share of various regions, Request Free Sample

The market in APAC is projected to experience significant growth during the forecast period, driven by increasing defense and military expenditures In the region. China, in particular, is leading this trend due to its continuous increase in defense budget over the past decade. This growth in defense spending will result in an expanded military workforce and increased demand for ammunition, leading to a heightened need for GaN RF devices. Additionally, the demand for improved cellular networks in developing countries such as China, India, South Korea, Taiwan, and Malaysia will further fuel the market growth in APAC. The region's market will expand rapidly due to its applications in various end-use industries, including telecommunications, military and defense, and consumer electronics.

Market Dynamics

Our GaN RF devices market researchers analyzed the data with 2023 as the base year, along with the key drivers, trends, and challenges. A holistic analysis of drivers will help companies refine their marketing strategies to gain a competitive advantage.

What are the key market drivers leading to the rise In the adoption of GaN RF Devices Industry?

Increasing use in broadcasting applications is the key driver of the market.

  • GaN RF devices, derived from High-Power Electronics, exhibit exceptional properties that make them increasingly sought-after in various industries. GaN RF transistors outperform their GaAs and silicon counterparts due to superior power output and superior thermal conductivity. This high lattice thermal conductivity, a key thermal property, stems from the interaction of phonons, the quantum mechanical particles responsible for heat transport. First-principles modeling and phonon distributions have been instrumental in understanding thermal transport in P-Type GaN and N-Type GaN. AlGaN/GaN heterostructures and ternary alloys further enhance GaN RF devices' performance in various applications. GaN RF devices are essential for power conversion technologies, particularly in high-power, high-frequency, and high-temperature operations.
  • Moreover, they find applications in diverse sectors, including automotive, consumer electronics, fast chargers, aerospace, defense, optoelectronics, data centers, quantum devices, and more. The environmental friendliness of GaN RF devices, with a lower carbon footprint and energy savings, adds to their appeal. GaN RF devices' miniaturization and compatibility with electronic designs, such as those from Cadence, make them suitable for various industry applications. Thermal stability and breakdown field are crucial factors In thermal transient testing for GaN RF devices. GaN RF devices' applications extend to sensor applications and RF power amplifiers. As GaN RF devices continue to evolve, they will play a significant role in carbon emissions reduction, energy savings, and sustainability.

What are the market trends shaping the GaN RF Devices Industry?

Growing prominence of GaN-on-Diamond is the upcoming market trend.

  • GaN RF devices, a crucial component in high-power electronics, exhibit superior performance in various applications, including power conversion technologies, radio frequency (RF) applications, sensor applications, and optoelectronics. The thermal properties of GaN RF devices, particularly P-Type GaN and N-Type GaN, significantly impact their efficiency and reliability. Phonon distributions and lattice thermal conductivity are essential factors influencing thermal transport In these devices. First-principles modeling is employed to understand the thermal behavior of GaN RF devices at the atomic level. The thermal stability of GaN RF devices is essential for their successful implementation in demanding applications. The barrier height and specific contact resistivity of AlGaN/GaN heterostructures and ternary alloys are critical in optimizing device performance.
  • In addition, GaN RF devices' thermal properties are crucial for high-temperature operation and low-voltage as well as high-voltage applications. Industrial diamond, with its superior thermal conductivity, offers a promising solution for enhancing the thermal properties of GaN RF devices. The adoption of GaN-on-Diamond wafers paves the way for high-performance, resilient power electronics. This approach addresses the challenges of improving efficiency and device lifetime, safety requirements, and optimized cost. The use of diamond substrates also reduces carbon footprint and enhances energy efficiency, making GaN RF devices more sustainable for various industry applications. GaN RF devices' adoption in automotive applications, consumer electronics, fast chargers, aerospace, defense, and data centers is on the rise due to their high efficiency, environmental friendliness, and miniaturization.

What challenges does the GaN RF Devices Industry face during its growth?

High cost of raw materials and production process is a key challenge affecting the industry growth.

  • The market is experiencing significant growth due to the increasing demand for High-Power Electronics in various industries. GaN RF devices, including P-Type GaN and N-Type GaN, exhibit superior thermal properties, making them ideal for applications requiring high power handling and efficiency. However, the high cost of raw materials and complex manufacturing process pose challenges to market expansion. First-principles modeling and electrothermal modeling are utilized to enhance the thermal transport properties of AlGaN/GaN Heterostructures and Ternary Alloys, thereby improving device performance. Phonon distributions and lattice thermal conductivity are critical factors influencing thermal stability in GaN RF devices. GaN RF devices offer advantages such as high breakdown field, thermal transient testing, and suitability for sensor applications.
  • In addition, they are expected to replace silicon-based RF devices In the future due to their superior efficiency and environmental friendliness. GaN RF devices are finding applications in various industries, including automotive, consumer electronics, power conversion technologies, aerospace, defense, optoelectronics, data centers, and quantum devices. The high average selling price of GaN RF devices is attributed to the novelty of this technology and its application in high-power, high-voltage, and high-temperature operations. GaN RF devices are essential components in power amplifiers, fast chargers, and Terahertz (THz) devices, contributing to carbon emissions reduction and energy savings. Electronic designs using GaN RF devices are becoming increasingly popular due to their miniaturization capabilities and compatibility with Cadence and other industry applications.

Exclusive Customer Landscape

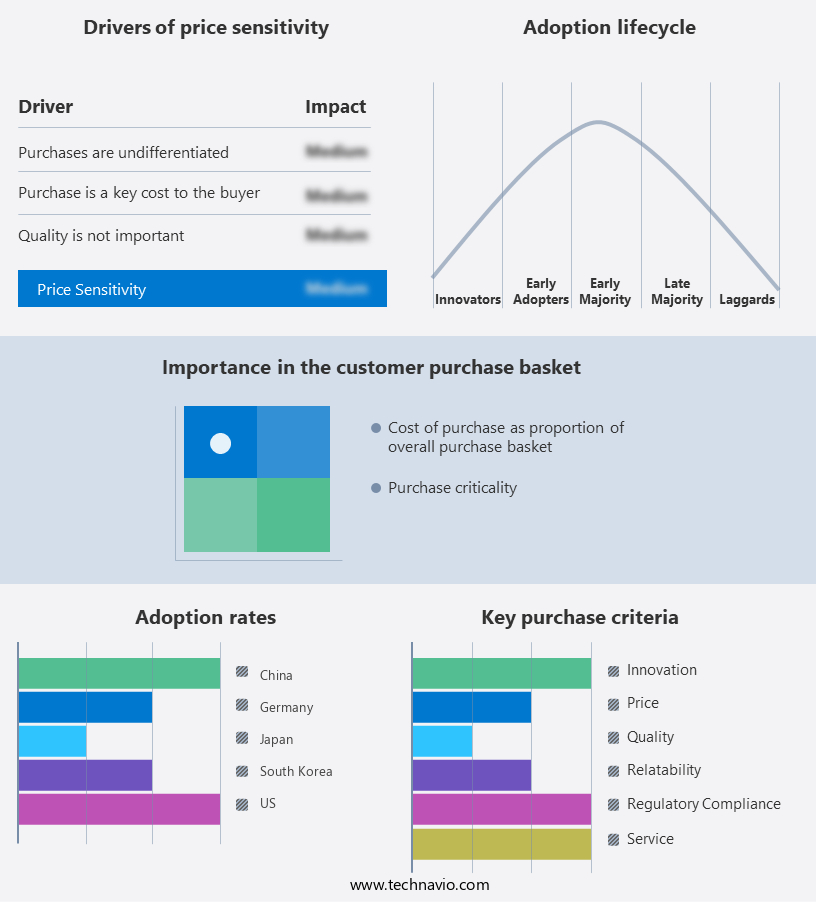
The gan rf devices market forecasting report includes the adoption lifecycle of the market, covering from the innovator's stage to the laggard's stage. It focuses on adoption rates in different regions based on penetration. Furthermore, the gan rf devices market report also includes key purchase criteria and drivers of price sensitivity to help companies evaluate and develop their market growth analysis strategies.

GaN RF Devices Market Share by Geography

 Customer Landscape

Key Companies & Market Insights

Companies are implementing various strategies, such as strategic alliances, gan rf devices market forecast, partnerships, mergers and acquisitions, geographical expansion, and product/service launches, to enhance their presence In the industry.

The industry research and growth report includes detailed analyses of the competitive landscape of the market and information about key companies, including:

  • Ampleon Netherlands BV
  • Broadcom Inc.
  • Fujitsu Ltd.
  • GaN Systems
  • Infineon Technologies AG
  • Integra Technologies Inc.
  • MACOM Technology Solutions Inc.
  • Microchip Technology Inc.
  • Mitsubishi Electric Corp.
  • Northrop Grumman Corp.
  • NXP Semiconductors NV
  • Qorvo Inc.
  • Raytheon Technologies Corp.
  • RFHIC Corp.
  • STMicroelectronics International N.V.
  • Sumitomo Electric Industries Ltd.
  • Texas Instruments Inc.
  • Toshiba Corp.
  • United Monolithic Semiconductors Holding SAS
  • NTT Advanced Technology Corp.

Qualitative and quantitative analysis of companies has been conducted to help clients understand the wider business environment as well as the strengths and weaknesses of key industry players. Data is qualitatively analyzed to categorize companies as pure play, category-focused, industry-focused, and diversified; it is quantitatively analyzed to categorize companies as dominant, leading, strong, tentative, and weak.

Research Analyst Overview

Gallium Nitride (GaN) RF devices have emerged as a game-changer In the high-power electronics industry due to their superior thermal properties and electrical performance. The unique lattice thermal conductivity of GaN makes it an ideal material for RF power conversion technologies, enabling efficient energy transfer and minimizing thermal losses. First-principles modeling and advanced simulation techniques have played a crucial role in understanding the phonon distributions and thermal transport properties of GaN. These studies have led to the development of high-performance GaN RF devices, including p-type and n-type GaN, which exhibit excellent specific contact resistivity and barrier height.

In addition, the integration of AlGaN/GaN heterostructures and ternary alloys has further enhanced the performance of GaN RF devices. These advancements have led to the creation of miniaturized, high-efficiency RF power amplifiers and power supplies, suitable for various applications, including automotive, consumer electronics, aerospace, defense, and optoelectronics. Electrothermal modeling and thermal transient testing have become essential in evaluating the performance and reliability of GaN RF devices under different operating conditions. The ability to operate GaN RF devices at high temperatures and under high electric fields has expanded their applications in various industries. The environmental friendliness and energy efficiency of GaN RF devices have also gained significant attention.

Moreover, the reduced carbon footprint and energy savings offered by GaN RF devices make them an attractive alternative to traditional power conversion technologies. Moreover, GaN RF devices have shown promise in sensor applications, data centers, and quantum devices, further expanding their market potential. The demand for GaN RF devices is driven by the increasing need for high-power, efficient, and reliable RF power conversion technologies. The market is expected to grow significantly due to the increasing adoption of GaN RF devices in various industries, including automotive, consumer electronics, aerospace, defense, and optoelectronics. The miniaturization of GaN RF devices has led to their integration into various applications, such as fast chargers, power supplies, and high-voltage applications.

Furthermore, the development of GaN RF devices for low-voltage applications has also gained significant attention due to the increasing demand for energy-efficient electronic designs. Therefore, the market is driven by the increasing demand for high-power, efficient, and reliable RF power conversion technologies. The unique thermal properties and electrical performance of GaN make it an ideal material for various applications, including automotive, consumer electronics, aerospace, defense, and optoelectronics. The ongoing research and development efforts In the field of GaN RF devices are expected to lead to significant advancements In the coming years.

GaN RF Devices Market Scope

Report Coverage

Details

Page number

177

Base year

2023

Historic period

2018-2022

Forecast period

2024-2028

Growth momentum & CAGR

Accelerate at a CAGR of 17.42%

Market growth 2024-2028

USD 1.61 billion

Market structure

Fragmented

YoY growth 2023-2024(%)

17.22

Key countries

US, China, Japan, South Korea, and Germany

Competitive landscape

Leading Companies, Market Positioning of Companies, Competitive Strategies, and Industry Risks

Request Free Sample

What are the Key Data Covered in this GaN RF Devices Market Research and Growth Report?

  • CAGR of the GaN RF Devices industry during the forecast period
  • Detailed information on factors that will drive the GaN RF Devices growth and forecasting between 2024 and 2028
  • Precise estimation of the size of the market and its contribution of the industry in focus to the parent market
  • Accurate predictions about upcoming growth and trends and changes in consumer behaviour
  • Growth of the market across APAC, Europe, North America, South America, and Middle East and Africa
  • Thorough analysis of the market's competitive landscape and detailed information about companies
  • Comprehensive analysis of factors that will challenge the gan rf devices market growth of industry companies

We can help! Our analysts can customize this gan rf devices market research report to meet your requirements.

Get in touch

1 Executive Summary

  • 1.1 Market overview
    • Exhibit 01: Executive Summary – Chart on Market Overview
    • Exhibit 02: Executive Summary – Data Table on Market Overview
    • Exhibit 03: Executive Summary – Chart on Global Market Characteristics
    • Exhibit 04: Executive Summary – Chart on Market by Geography
    • Exhibit 05: Executive Summary – Chart on Market Segmentation by Application
    • Exhibit 06: Executive Summary – Chart on Market Segmentation by Material
    • Exhibit 07: Executive Summary – Chart on Incremental Growth
    • Exhibit 08: Executive Summary – Data Table on Incremental Growth
    • Exhibit 09: Executive Summary – Chart on Vendor Market Positioning

2 Market Landscape

  • 2.1 Market ecosystem
    • Exhibit 10: Parent market
    • Exhibit 11: Market Characteristics

3 Market Sizing

  • 3.1 Market definition
    • Exhibit 12: Offerings of vendors included in the market definition
  • 3.2 Market segment analysis
    • Exhibit 13: Market segments
  • 3.3 Market size 2023
    • 3.4 Market outlook: Forecast for 2023-2028
      • Exhibit 14: Chart on Global - Market size and forecast 2023-2028 ($ million)
      • Exhibit 15: Data Table on Global - Market size and forecast 2023-2028 ($ million)
      • Exhibit 16: Chart on Global Market: Year-over-year growth 2023-2028 (%)
      • Exhibit 17: Data Table on Global Market: Year-over-year growth 2023-2028 (%)

    4 Historic Market Size

    • 4.1 Global GaN RF devices market 2018 - 2022
      • Exhibit 18: Historic Market Size – Data Table on global gan rf devices market 2018 - 2022 ($ million)
    • 4.2 Application Segment Analysis 2018 - 2022
      • Exhibit 19: Historic Market Size – Application Segment 2018 - 2022 ($ million)
    • 4.3 Material Segment Analysis 2018 - 2022
      • Exhibit 20: Historic Market Size – Material Segment 2018 - 2022 ($ million)
    • 4.4 Geography Segment Analysis 2018 - 2022
      • Exhibit 21: Historic Market Size – Geography Segment 2018 - 2022 ($ million)
    • 4.5 Country Segment Analysis 2018 - 2022
      • Exhibit 22: Historic Market Size – Country Segment 2018 - 2022 ($ million)

    5 Five Forces Analysis

    • 5.1 Five forces summary
      • Exhibit 23: Five forces analysis - Comparison between 2023 and 2028
    • 5.2 Bargaining power of buyers
      • Exhibit 24: Chart on Bargaining power of buyers – Impact of key factors 2023 and 2028
    • 5.3 Bargaining power of suppliers
      • Exhibit 25: Bargaining power of suppliers – Impact of key factors in 2023 and 2028
    • 5.4 Threat of new entrants
      • Exhibit 26: Threat of new entrants – Impact of key factors in 2023 and 2028
    • 5.5 Threat of substitutes
      • Exhibit 27: Threat of substitutes – Impact of key factors in 2023 and 2028
    • 5.6 Threat of rivalry
      • Exhibit 28: Threat of rivalry – Impact of key factors in 2023 and 2028
    • 5.7 Market condition
      • Exhibit 29: Chart on Market condition - Five forces 2023 and 2028

    6 Market Segmentation by Application

    • 6.1 Market segments
      • Exhibit 30: Chart on Application - Market share 2023-2028 (%)
      • Exhibit 31: Data Table on Application - Market share 2023-2028 (%)
    • 6.2 Comparison by Application
      • Exhibit 32: Chart on Comparison by Application
      • Exhibit 33: Data Table on Comparison by Application
    • 6.3 Cellular infrastructure - Market size and forecast 2023-2028
      • Exhibit 34: Chart on Cellular infrastructure - Market size and forecast 2023-2028 ($ million)
      • Exhibit 35: Data Table on Cellular infrastructure - Market size and forecast 2023-2028 ($ million)
      • Exhibit 36: Chart on Cellular infrastructure - Year-over-year growth 2023-2028 (%)
      • Exhibit 37: Data Table on Cellular infrastructure - Year-over-year growth 2023-2028 (%)
    • 6.4 Defense and military - Market size and forecast 2023-2028
      • Exhibit 38: Chart on Defense and military - Market size and forecast 2023-2028 ($ million)
      • Exhibit 39: Data Table on Defense and military - Market size and forecast 2023-2028 ($ million)
      • Exhibit 40: Chart on Defense and military - Year-over-year growth 2023-2028 (%)
      • Exhibit 41: Data Table on Defense and military - Year-over-year growth 2023-2028 (%)
    • 6.5 CATV - Market size and forecast 2023-2028
      • Exhibit 42: Chart on CATV - Market size and forecast 2023-2028 ($ million)
      • Exhibit 43: Data Table on CATV - Market size and forecast 2023-2028 ($ million)
      • Exhibit 44: Chart on CATV - Year-over-year growth 2023-2028 (%)
      • Exhibit 45: Data Table on CATV - Year-over-year growth 2023-2028 (%)
    • 6.6 Others - Market size and forecast 2023-2028
      • Exhibit 46: Chart on Others - Market size and forecast 2023-2028 ($ million)
      • Exhibit 47: Data Table on Others - Market size and forecast 2023-2028 ($ million)
      • Exhibit 48: Chart on Others - Year-over-year growth 2023-2028 (%)
      • Exhibit 49: Data Table on Others - Year-over-year growth 2023-2028 (%)
    • 6.7 Market opportunity by Application
      • Exhibit 50: Market opportunity by Application ($ million)
      • Exhibit 51: Data Table on Market opportunity by Application ($ million)

    7 Market Segmentation by Material

    • 7.1 Market segments
      • Exhibit 52: Chart on Material - Market share 2023-2028 (%)
      • Exhibit 53: Data Table on Material - Market share 2023-2028 (%)
    • 7.2 Comparison by Material
      • Exhibit 54: Chart on Comparison by Material
      • Exhibit 55: Data Table on Comparison by Material
    • 7.3 GaN-on-Si - Market size and forecast 2023-2028
      • Exhibit 56: Chart on GaN-on-Si - Market size and forecast 2023-2028 ($ million)
      • Exhibit 57: Data Table on GaN-on-Si - Market size and forecast 2023-2028 ($ million)
      • Exhibit 58: Chart on GaN-on-Si - Year-over-year growth 2023-2028 (%)
      • Exhibit 59: Data Table on GaN-on-Si - Year-over-year growth 2023-2028 (%)
    • 7.4 GaN-on-SiC - Market size and forecast 2023-2028
      • Exhibit 60: Chart on GaN-on-SiC - Market size and forecast 2023-2028 ($ million)
      • Exhibit 61: Data Table on GaN-on-SiC - Market size and forecast 2023-2028 ($ million)
      • Exhibit 62: Chart on GaN-on-SiC - Year-over-year growth 2023-2028 (%)
      • Exhibit 63: Data Table on GaN-on-SiC - Year-over-year growth 2023-2028 (%)
    • 7.5 GaN-on-Diamond - Market size and forecast 2023-2028
      • Exhibit 64: Chart on GaN-on-Diamond - Market size and forecast 2023-2028 ($ million)
      • Exhibit 65: Data Table on GaN-on-Diamond - Market size and forecast 2023-2028 ($ million)
      • Exhibit 66: Chart on GaN-on-Diamond - Year-over-year growth 2023-2028 (%)
      • Exhibit 67: Data Table on GaN-on-Diamond - Year-over-year growth 2023-2028 (%)
    • 7.6 Market opportunity by Material
      • Exhibit 68: Market opportunity by Material ($ million)
      • Exhibit 69: Data Table on Market opportunity by Material ($ million)

    8 Customer Landscape

    • 8.1 Customer landscape overview
      • Exhibit 70: Analysis of price sensitivity, lifecycle, customer purchase basket, adoption rates, and purchase criteria

    9 Geographic Landscape

    • 9.1 Geographic segmentation
      • Exhibit 71: Chart on Market share by geography 2023-2028 (%)
      • Exhibit 72: Data Table on Market share by geography 2023-2028 (%)
    • 9.2 Geographic comparison
      • Exhibit 73: Chart on Geographic comparison
      • Exhibit 74: Data Table on Geographic comparison
    • 9.3 APAC - Market size and forecast 2023-2028
      • Exhibit 75: Chart on APAC - Market size and forecast 2023-2028 ($ million)
      • Exhibit 76: Data Table on APAC - Market size and forecast 2023-2028 ($ million)
      • Exhibit 77: Chart on APAC - Year-over-year growth 2023-2028 (%)
      • Exhibit 78: Data Table on APAC - Year-over-year growth 2023-2028 (%)
    • 9.4 Europe - Market size and forecast 2023-2028
      • Exhibit 79: Chart on Europe - Market size and forecast 2023-2028 ($ million)
      • Exhibit 80: Data Table on Europe - Market size and forecast 2023-2028 ($ million)
      • Exhibit 81: Chart on Europe - Year-over-year growth 2023-2028 (%)
      • Exhibit 82: Data Table on Europe - Year-over-year growth 2023-2028 (%)
    • 9.5 North America - Market size and forecast 2023-2028
      • Exhibit 83: Chart on North America - Market size and forecast 2023-2028 ($ million)
      • Exhibit 84: Data Table on North America - Market size and forecast 2023-2028 ($ million)
      • Exhibit 85: Chart on North America - Year-over-year growth 2023-2028 (%)
      • Exhibit 86: Data Table on North America - Year-over-year growth 2023-2028 (%)
    • 9.6 South America - Market size and forecast 2023-2028
      • Exhibit 87: Chart on South America - Market size and forecast 2023-2028 ($ million)
      • Exhibit 88: Data Table on South America - Market size and forecast 2023-2028 ($ million)
      • Exhibit 89: Chart on South America - Year-over-year growth 2023-2028 (%)
      • Exhibit 90: Data Table on South America - Year-over-year growth 2023-2028 (%)
    • 9.7 Middle East and Africa - Market size and forecast 2023-2028
      • Exhibit 91: Chart on Middle East and Africa - Market size and forecast 2023-2028 ($ million)
      • Exhibit 92: Data Table on Middle East and Africa - Market size and forecast 2023-2028 ($ million)
      • Exhibit 93: Chart on Middle East and Africa - Year-over-year growth 2023-2028 (%)
      • Exhibit 94: Data Table on Middle East and Africa - Year-over-year growth 2023-2028 (%)
    • 9.8 China - Market size and forecast 2023-2028
      • Exhibit 95: Chart on China - Market size and forecast 2023-2028 ($ million)
      • Exhibit 96: Data Table on China - Market size and forecast 2023-2028 ($ million)
      • Exhibit 97: Chart on China - Year-over-year growth 2023-2028 (%)
      • Exhibit 98: Data Table on China - Year-over-year growth 2023-2028 (%)
    • 9.9 US - Market size and forecast 2023-2028
      • Exhibit 99: Chart on US - Market size and forecast 2023-2028 ($ million)
      • Exhibit 100: Data Table on US - Market size and forecast 2023-2028 ($ million)
      • Exhibit 101: Chart on US - Year-over-year growth 2023-2028 (%)
      • Exhibit 102: Data Table on US - Year-over-year growth 2023-2028 (%)
    • 9.10 Japan - Market size and forecast 2023-2028
      • Exhibit 103: Chart on Japan - Market size and forecast 2023-2028 ($ million)
      • Exhibit 104: Data Table on Japan - Market size and forecast 2023-2028 ($ million)
      • Exhibit 105: Chart on Japan - Year-over-year growth 2023-2028 (%)
      • Exhibit 106: Data Table on Japan - Year-over-year growth 2023-2028 (%)
    • 9.11 South Korea - Market size and forecast 2023-2028
      • Exhibit 107: Chart on South Korea - Market size and forecast 2023-2028 ($ million)
      • Exhibit 108: Data Table on South Korea - Market size and forecast 2023-2028 ($ million)
      • Exhibit 109: Chart on South Korea - Year-over-year growth 2023-2028 (%)
      • Exhibit 110: Data Table on South Korea - Year-over-year growth 2023-2028 (%)
    • 9.12 Germany - Market size and forecast 2023-2028
      • Exhibit 111: Chart on Germany - Market size and forecast 2023-2028 ($ million)
      • Exhibit 112: Data Table on Germany - Market size and forecast 2023-2028 ($ million)
      • Exhibit 113: Chart on Germany - Year-over-year growth 2023-2028 (%)
      • Exhibit 114: Data Table on Germany - Year-over-year growth 2023-2028 (%)
    • 9.13 Market opportunity by geography
      • Exhibit 115: Market opportunity by geography ($ million)
      • Exhibit 116: Data Tables on Market opportunity by geography ($ million)

    10 Drivers, Challenges, and Trends

    • 10.1 Market drivers
      • 10.2 Market challenges
        • 10.3 Impact of drivers and challenges
          • Exhibit 117: Impact of drivers and challenges in 2023 and 2028
        • 10.4 Market trends

          11 Vendor Landscape

          • 11.1 Overview
            • 11.2 Vendor landscape
              • Exhibit 118: Overview on Criticality of inputs and Factors of differentiation
            • 11.3 Landscape disruption
              • Exhibit 119: Overview on factors of disruption
            • 11.4 Industry risks
              • Exhibit 120: Impact of key risks on business

            12 Vendor Analysis

            • 12.1 Vendors covered
              • Exhibit 121: Vendors covered
            • 12.2 Market positioning of vendors
              • Exhibit 122: Matrix on vendor position and classification
            • 12.3 Ampleon Netherlands BV
              • Exhibit 123: Ampleon Netherlands BV - Overview
              • Exhibit 124: Ampleon Netherlands BV - Product / Service
              • Exhibit 125: Ampleon Netherlands BV - Key offerings
            • 12.4 Broadcom Inc.
              • Exhibit 126: Broadcom Inc. - Overview
              • Exhibit 127: Broadcom Inc. - Business segments
              • Exhibit 128: Broadcom Inc. - Key news
              • Exhibit 129: Broadcom Inc. - Key offerings
              • Exhibit 130: Broadcom Inc. - Segment focus
            • 12.5 Fujitsu Ltd.
              • Exhibit 131: Fujitsu Ltd. - Overview
              • Exhibit 132: Fujitsu Ltd. - Business segments
              • Exhibit 133: Fujitsu Ltd. - Key news
              • Exhibit 134: Fujitsu Ltd. - Key offerings
              • Exhibit 135: Fujitsu Ltd. - Segment focus
            • 12.6 GaN Systems
              • Exhibit 136: GaN Systems - Overview
              • Exhibit 137: GaN Systems - Product / Service
              • Exhibit 138: GaN Systems - Key offerings
            • 12.7 Infineon Technologies AG
              • Exhibit 139: Infineon Technologies AG - Overview
              • Exhibit 140: Infineon Technologies AG - Business segments
              • Exhibit 141: Infineon Technologies AG - Key news
              • Exhibit 142: Infineon Technologies AG - Key offerings
              • Exhibit 143: Infineon Technologies AG - Segment focus
            • 12.8 Integra Technologies Inc.
              • Exhibit 144: Integra Technologies Inc. - Overview
              • Exhibit 145: Integra Technologies Inc. - Product / Service
              • Exhibit 146: Integra Technologies Inc. - Key offerings
            • 12.9 MACOM Technology Solutions Inc.
              • Exhibit 147: MACOM Technology Solutions Inc. - Overview
              • Exhibit 148: MACOM Technology Solutions Inc. - Product / Service
              • Exhibit 149: MACOM Technology Solutions Inc. - Key news
              • Exhibit 150: MACOM Technology Solutions Inc. - Key offerings
            • 12.10 Microchip Technology Inc.
              • Exhibit 151: Microchip Technology Inc. - Overview
              • Exhibit 152: Microchip Technology Inc. - Business segments
              • Exhibit 153: Microchip Technology Inc. - Key offerings
              • Exhibit 154: Microchip Technology Inc. - Segment focus
            • 12.11 NXP Semiconductors NV
              • Exhibit 155: NXP Semiconductors NV - Overview
              • Exhibit 156: NXP Semiconductors NV - Product / Service
              • Exhibit 157: NXP Semiconductors NV - Key news
              • Exhibit 158: NXP Semiconductors NV - Key offerings
            • 12.12 Qorvo Inc.
              • Exhibit 159: Qorvo Inc. - Overview
              • Exhibit 160: Qorvo Inc. - Business segments
              • Exhibit 161: Qorvo Inc. - Key news
              • Exhibit 162: Qorvo Inc. - Key offerings
              • Exhibit 163: Qorvo Inc. - Segment focus
            • 12.13 RFHIC Corp.
              • Exhibit 164: RFHIC Corp. - Overview
              • Exhibit 165: RFHIC Corp. - Product / Service
              • Exhibit 166: RFHIC Corp. - Key offerings
            • 12.14 Sumitomo Electric Industries Ltd.
              • Exhibit 167: Sumitomo Electric Industries Ltd. - Overview
              • Exhibit 168: Sumitomo Electric Industries Ltd. - Business segments
              • Exhibit 169: Sumitomo Electric Industries Ltd. - Key news
              • Exhibit 170: Sumitomo Electric Industries Ltd. - Key offerings
              • Exhibit 171: Sumitomo Electric Industries Ltd. - Segment focus
            • 12.15 Texas Instruments Inc.
              • Exhibit 172: Texas Instruments Inc. - Overview
              • Exhibit 173: Texas Instruments Inc. - Business segments
              • Exhibit 174: Texas Instruments Inc. - Key news
              • Exhibit 175: Texas Instruments Inc. - Key offerings
              • Exhibit 176: Texas Instruments Inc. - Segment focus
            • 12.16 Toshiba Corp.
              • Exhibit 177: Toshiba Corp. - Overview
              • Exhibit 178: Toshiba Corp. - Business segments
              • Exhibit 179: Toshiba Corp. - Key news
              • Exhibit 180: Toshiba Corp. - Key offerings
              • Exhibit 181: Toshiba Corp. - Segment focus
            • 12.17 United Monolithic Semiconductors Holding SAS
              • Exhibit 182: United Monolithic Semiconductors Holding SAS - Overview
              • Exhibit 183: United Monolithic Semiconductors Holding SAS - Product / Service
              • Exhibit 184: United Monolithic Semiconductors Holding SAS - Key offerings

            13 Appendix

            • 13.1 Scope of the report
              • 13.2 Inclusions and exclusions checklist
                • Exhibit 185: Inclusions checklist
                • Exhibit 186: Exclusions checklist
              • 13.3 Currency conversion rates for US$
                • Exhibit 187: Currency conversion rates for US$
              • 13.4 Research methodology
                • Exhibit 188: Research methodology
                • Exhibit 189: Validation techniques employed for market sizing
                • Exhibit 190: Information sources
              • 13.5 List of abbreviations
                • Exhibit 191: List of abbreviations

              Research Methodology

              Technavio presents a detailed picture of the market by way of study, synthesis, and summation of data from multiple sources. The analysts have presented the various facets of the market with a particular focus on identifying the key industry influencers. The data thus presented is comprehensive, reliable, and the result of extensive research, both primary and secondary.

              INFORMATION SOURCES

              Primary sources

              • Manufacturers and suppliers
              • Channel partners
              • Industry experts
              • Strategic decision makers

              Secondary sources

              • Industry journals and periodicals
              • Government data
              • Financial reports of key industry players
              • Historical data
              • Press releases

              DATA ANALYSIS

              Data Synthesis

              • Collation of data
              • Estimation of key figures
              • Analysis of derived insights

              Data Validation

              • Triangulation with data models
              • Reference against proprietary databases
              • Corroboration with industry experts

              REPORT WRITING

              Qualitative

              • Market drivers
              • Market challenges
              • Market trends
              • Five forces analysis

              Quantitative

              • Market size and forecast
              • Market segmentation
              • Geographical insights
              • Competitive landscape

              Interested in this report?

              Get your sample now to see our research methodology and insights!

              Download Now

              Frequently Asked Questions

              GaN RF Devices market growth will increase by $ 1610 mn during 2024-2028 .

              The GaN RF Devices market is expected to grow at a CAGR of 17.42% during 2024-2028 .

              GaN RF Devices market is segmented by Application( Cellular infrastructure, Defense and military, CATV, Others) Material( GaN-on-Si, GaN-on-SiC, GaN-on-Diamond)

              Ampleon Netherlands BV, Broadcom Inc., Fujitsu Ltd., GaN Systems, Infineon Technologies AG, Integra Technologies Inc., MACOM Technology Solutions Inc., Microchip Technology Inc., Mitsubishi Electric Corp., Northrop Grumman Corp., NXP Semiconductors NV, Qorvo Inc., Raytheon Technologies Corp., RFHIC Corp., STMicroelectronics International N.V., Sumitomo Electric Industries Ltd., Texas Instruments Inc., Toshiba Corp., United Monolithic Semiconductors Holding SAS, NTT Advanced Technology Corp. are a few of the key vendors in the GaN RF Devices market.

              APAC will register the highest growth rate of 57% among the other regions. Therefore, the GaN RF Devices market in APAC is expected to garner significant business opportunities for the vendors during the forecast period.

              US, China, Japan, South Korea, Germany

              • Increasing use in broadcasting applicationsThe increased applications of GaN RF devices will be among the primary drivers of market growth. GaN RF devices are commonly used for military communication systems and cellular infrastructure. These devices will find applications across other sectors is the driving factor this market.
              • such as mobile radio is the driving factor this market.
              • CATV is the driving factor this market.
              • and broadcast. GaN is a technology that has been finding its applications in commercial applications owing to its unique material properties. GaN RF transistors have superior power output as compared to GaAs or silicon transistors. Good thermal conductivity is the driving factor this market.
              • along with its high cut-off frequency is the driving factor this market.
              • adds to the unique characteristics of GaN transistors. GaN devices offer the best solution for simultaneous high-power is the driving factor this market.
              • high-frequency is the driving factor this market.
              • and high-temperature operation. GaN RF finds applications in broadcasting and industrial is the driving factor this market.
              • scientific is the driving factor this market.
              • and medical (ISM). Several vendors are widening their product portfolio and offering GaN RF devices that are used for these applications. One such vendor is Ampleon Netherlands BV is the driving factor this market.
              • offering devices for broadcasting is the driving factor this market.
              • ISM is the driving factor this market.
              • and RF energy. Ampleon offers a range of RF transistors and evaluation kits for RF instrumentation applications. Its wideband amplifiers feature low noise and are exceedingly linear is the driving factor this market.
              • making them particularly suitable for feedback channels in a wide range of measuring equipment is the driving factor this market.
              • including vector signal transceivers is the driving factor this market.
              • signal generators is the driving factor this market.
              • and RF power meters. Thus is the driving factor this market.
              • the increasing use of GaN RF in broadcasting applications will boost the growth of the global GaN RF devices market during the forecast period. is the driving factor this market.

              The GaN RF Devices market vendors should focus on grabbing business opportunities from the Cellular infrastructure segment as it accounted for the largest market share in the base year.