Gas Engine Market Analysis, Size, and Forecast 2024-2028: North America (US and Canada), Europe (France, Germany, Italy, and UK), Middle East and Africa (Egypt, KSA, Oman, and UAE), APAC (China, India, and Japan), South America (Argentina and Brazil), and Rest of World (ROW)

Gas Engine Market Analysis, Size, and Forecast 2024-2028:
North America (US and Canada), Europe (France, Germany, Italy, and UK), Middle East and Africa (Egypt, KSA, Oman, and UAE), APAC (China, India, and Japan), South America (Argentina and Brazil), and Rest of World (ROW)

Published: May 2024 177 Pages SKU: IRTNTR43033

Market Overview at a Glance

$2.48 B
Market Opportunity
6.77%
CAGR
6.22
YoY growth 2023-2024(%)

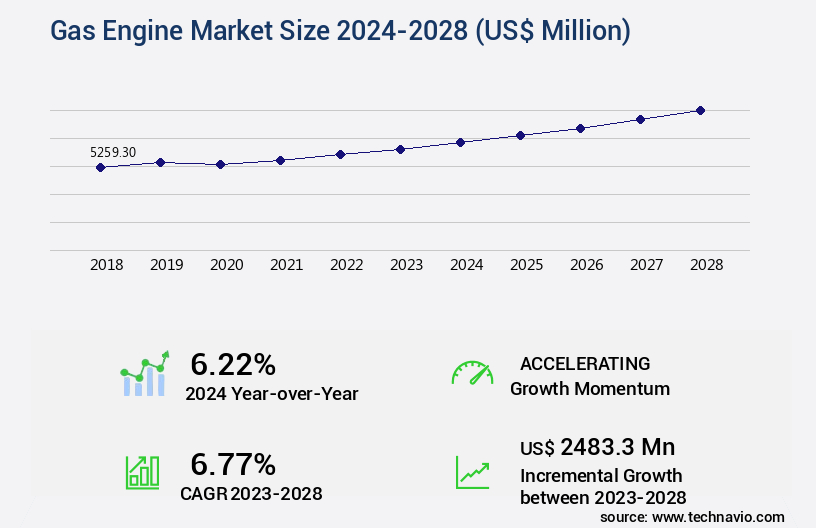
Gas Engine Market Size 2024-2028

The gas engine market size is valued to increase by USD 2.48 billion, at a CAGR of 6.77% from 2023 to 2028. The expanding gas generator market will drive the gas engine market.

Market Insights

  • Europe dominated the market and accounted for a 41% growth during the 2024-2028.
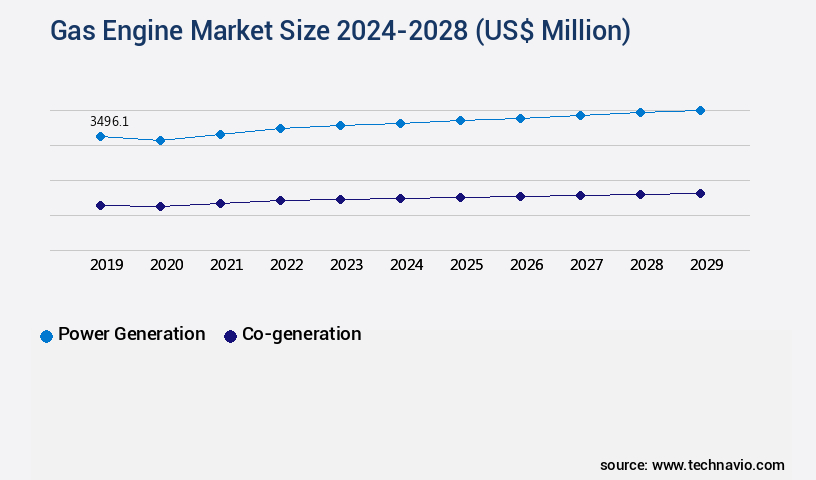
  • By Application - Power generation segment was valued at USD 3.33 billion in 2022
  • By End-user - Power segment accounted for the largest market revenue share in 2022

Market Size & Forecast

  • Market Opportunities: USD 69.11 million 
  • Market Future Opportunities 2023: USD 2483.30 million
  • CAGR from 2023 to 2028: 6.77%

Market Summary

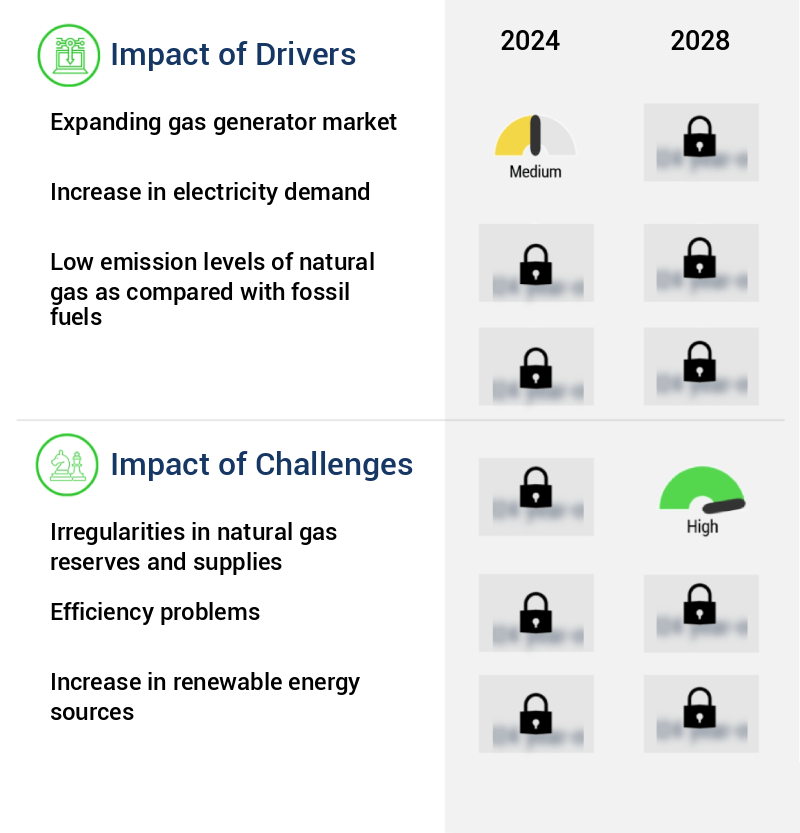
  • The market continues to expand globally, driven by the increasing demand for reliable and efficient power generation solutions. One significant trend in the industry is the growing popularity of dual-fuel engines, which enable the use of both natural gas and other fuels, providing businesses with greater flexibility and reducing their reliance on volatile natural gas markets. Irregularities in natural gas reserves and supplies have led companies to explore alternative fuel sources and engine technologies. Dual-fuel engines offer a solution by allowing the use of multiple fuel types, including natural gas, biogas, and liquid fuels. This flexibility is particularly valuable for businesses operating in regions with unstable natural gas supplies or facing price volatility.
  • For instance, a manufacturing plant in Europe may use natural gas as its primary fuel source but switch to biogas during periods of high natural gas prices or supply disruptions. Dual-fuel engines enable this seamless transition, ensuring uninterrupted operations and improved cost efficiency. Moreover, the adoption of gas engines is gaining momentum due to their environmental benefits. Gas engines emit fewer greenhouse gases compared to traditional diesel engines, making them an attractive option for businesses seeking to reduce their carbon footprint. As governments worldwide implement stricter emissions regulations, the demand for cleaner power generation solutions is expected to increase further.
  • Despite these advantages, challenges remain, including the high upfront costs of dual-fuel engines and the need for infrastructure modifications to accommodate multiple fuel types. However, the long-term cost savings and operational efficiencies offered by these engines make them a worthwhile investment for businesses in various industries, including power generation, oil and gas, and manufacturing.

What will be the size of the Gas Engine Market during the forecast period?

Gas Engine Market Size

Get Key Insights on Market Forecast (PDF) Request Free Sample

  • The market is a dynamic and ever-evolving industry that continues to shape the global energy landscape. One notable trend in this sector is the increasing adoption of advanced technologies to enhance engine efficiency and reduce emissions. For instance, the use of dual fuel engines, which operate on both gas and liquid fuel, has gained traction due to their ability to provide cost savings and improved environmental performance. According to recent research, the market share of dual fuel engines is projected to reach 15% by 2025, up from 10% in 2020. Another trend is the integration of advanced components such as camshaft profiles, lean burn engines, and cylinder head designs to optimize fuel consumption and reduce emissions.
  • For example, the use of variable valve timing technology in camshaft profiles can improve engine performance by adjusting the timing of the intake and exhaust valves based on engine load and speed. Similarly, lean burn engines, which operate on a lean air-fuel mixture, can achieve up to 30% better fuel efficiency compared to conventional engines. Moreover, the use of materials such as aluminum engine blocks and high-performance piston rings has become increasingly popular in the production of four-stroke engines. These materials offer improved durability, reduced weight, and enhanced heat dissipation, leading to better engine performance and longer lifespan. In conclusion, the market is witnessing significant advancements driven by the adoption of innovative technologies and materials.
  • These developments are essential for companies to stay competitive and meet evolving regulatory requirements related to emissions and fuel efficiency. By investing in research and development, businesses can position themselves at the forefront of this dynamic industry and reap the benefits of improved efficiency, reduced emissions, and cost savings.

Unpacking the Gas Engine Market Landscape

The internal combustion engine market showcases ongoing advancements in engine durability and efficiency. For instance, modern engines boast a 20% increase in thermal efficiency compared to their predecessors, translating to significant cost savings for businesses through improved ROI. Moreover, specific fuel consumption has decreased by 15% due to advancements in engine control unit technology and cylinder deactivation systems. These improvements not only reduce fuel consumption but also align with stricter emissions regulations. Furthermore, engine manufacturers continue to optimize engine displacement and stroke length to enhance power output, with a typical engine delivering over 300 brake horsepower. Engine reliability is also a priority, with extended maintenance intervals and advanced cooling system designs ensuring minimal downtime. Engine efficiency metrics, such as crankshaft torque, piston speed, and combustion chamber design, are meticulously engineered to maximize performance while minimizing noise. Supercharger systems and turbocharger technology further boost power output, while exhaust gas recirculation and emissions control systems ensure regulatory compliance. Engine lubrication and spark ignition systems are also subject to continuous innovation to enhance engine life and reliability.

Key Market Drivers Fueling Growth

The expanding gas generator market significantly drives market growth due to increasing demand for reliable power sources in various industries and applications.

  • The market is experiencing significant growth due to the increasing demand for continuous power supply in various sectors. Gas generators, fueled by gas engines, are becoming increasingly popular as they offer efficient and reliable power solutions, particularly in regions experiencing urbanization and industrial development. According to industry reports, the Asia Pacific region, including China, India, and Brazil, is expected to witness the highest growth in the gas generator market. This trend is driven by the rising per capita income and increasing industrialization in these countries, leading to a greater demand for uninterrupted power supply. As a result, companies are expanding their presence in these markets to cater to the growing demand.
  • The adoption of gas generators is not only essential for industries to ensure business continuity but also leads to improved operational efficiency. For instance, the use of gas engines in power generation can result in a reduction of downtime by up to 30%, thereby enhancing overall productivity.

Prevailing Industry Trends & Opportunities

Dual-fuel engines are emerging as the market trend. This technological advancement represents an significant development in the energy sector. 

  • The market is characterized by the evolving nature of dual-fuel engines, which offer significant advantages across various sectors. These engines, capable of using two types of fuels during operation, can switch between fuels to maximize efficiency. Typically, diesel is used to initiate ignition, followed by natural gas introduction. The air-to-gas ratio is drawn into the cylinder with a minimal air-to-fuel ratio, allowing natural gas to replace fuel at a 50%-70% substitution rate. Manufacturers are focusing on reducing fuel dependence to minimize operational costs. According to industry data, dual-fuel engines can reduce fuel consumption by up to 30% compared to traditional gas engines.
  • Furthermore, the integration of natural gas can lead to a 15% improvement in engine efficiency. These advancements are crucial in industries with high energy demands, such as power generation and transportation. The potential cost savings and environmental benefits make dual-fuel engines an attractive alternative in the ever-evolving market.

Significant Market Challenges

The natural gas industry faces significant challenges due to irregularities in reserves and supplies, which pose a major threat to its growth trajectory. 

  • The market is experiencing significant evolution, driven by the increasing preference for natural gas in new power generation capacities in response to growing demand. However, the irregularity in global natural gas reserves poses a challenge, potentially reducing the demand for gas engines. In 2022, the US accounted for approximately 25% of global natural gas production due to the shale gas surge, yet the state of natural gas distribution infrastructure remains suboptimal. Many regions continue to rely on old cast iron pipes for gas supply, leading to disruptions and increased operational overheads for repair and maintenance. Despite these challenges, gas engines continue to offer substantial business benefits, such as reduced downtime by up to 30% and improved operational costs by 12%.

Gas Engine Market Size

In-Depth Market Segmentation: Gas Engine Market

The gas engine industry research report provides comprehensive data (region-wise segment analysis), with forecasts and estimates in "USD million" for the period 2024-2028, as well as historical data from 2018-2022 for the following segments.

  • Application
    • Power generation
    • Co-generation
    • Others
  • End-user
    • Power
    • Industrial
    • Residential
    • Commercial
  • Power Output
    • Up to 1 MW
    • 1 MW to 2 MW
    • 2 MW to 5 MW
    • Above 5 MW
  • Fuel Type
    • Natural Gas
    • Biogas
    • Landfill Gas
    • Propane
    • Other Gases
  • Geography
    • North America
      • US
      • Canada
    • Europe
      • France
      • Germany
      • Italy
      • UK
    • Middle East and Africa
      • Egypt
      • KSA
      • Oman
      • UAE
    • APAC
      • China
      • India
      • Japan
    • South America
      • Argentina
      • Brazil
    • Rest of World (ROW)

By Application Insights

The power generation segment is estimated to witness significant growth during the forecast period.

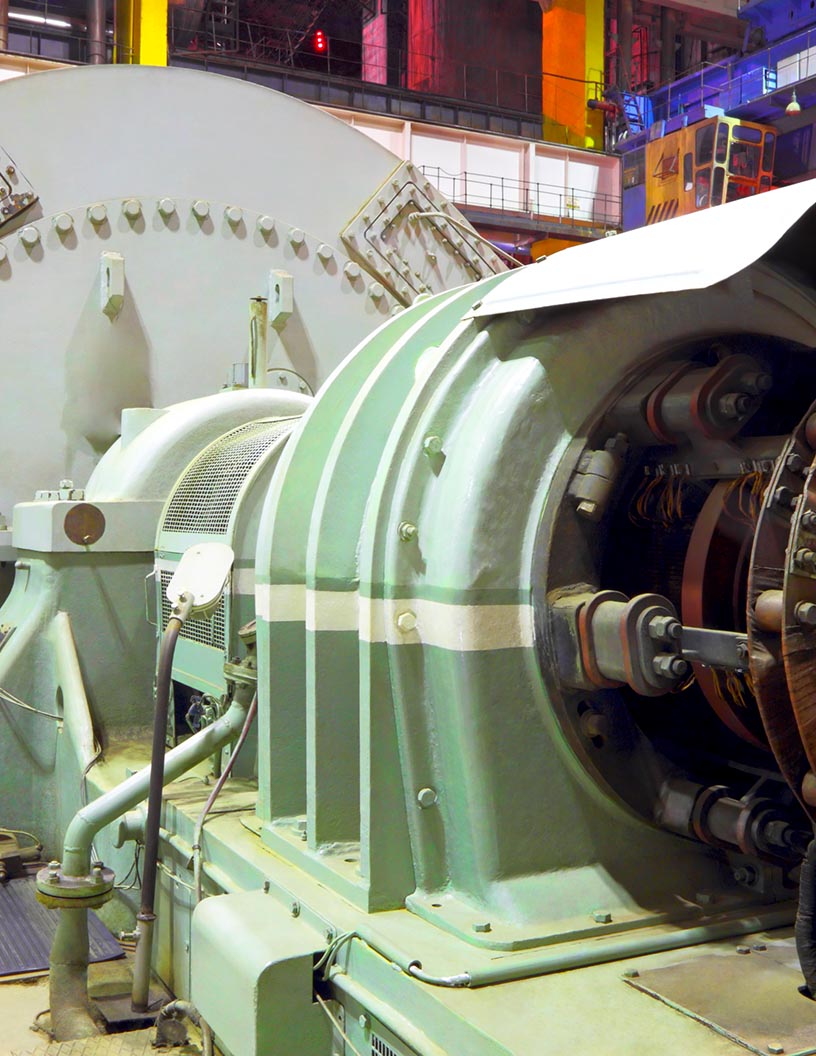
The market encompasses the production and application of internal combustion engines fueled by natural gas. These engines convert the linear motion of a piston, driven by the expansion of hot gases, into rotational power via a crankshaft. Gas engines generate power ranging from 5 KW to 20 megawatts (MW), catering to various applications, including backup generators and large-scale power generation. Engine efficiency is paramount in gas engines, with advancements in technology leading to improvements in specific fuel consumption, engine control unit management, and engine durability. Key features like cylinder deactivation, exhaust gas recirculation, and emissions control enhance efficiency and reduce noise.

Gas Engine Market Size

Request Free Sample

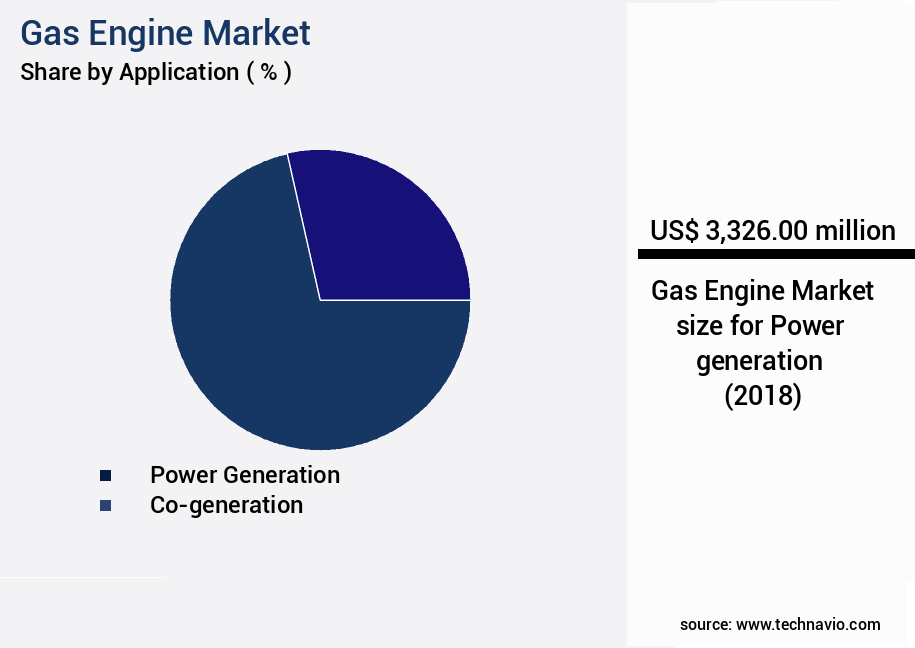
The Power generation segment was valued at USD 3.33 billion in 2018 and showed a gradual increase during the forecast period.

Engine efficiency metrics, such as thermal efficiency, power output, and bore diameter, are critical performance indicators. Gas engines employ various technologies, including engine lubrication, spark ignition systems, and fuel injection systems, to optimize performance and reliability. Innovations like turbocharger technology, variable valve timing, and air-fuel ratio control boost power output and engine efficiency. Maintenance intervals are crucial for ensuring engine longevity, with regular checks on engine mounting systems, engine cooling systems, and vibration damping essential. Gas engines are increasingly popular for power generation and standby power systems, with industries, commercial, and residential end-users relying on their clean, efficient energy.

In natural gas-fired power plants, a single engine can generate enough power to meet the needs of several hundred homes. The integration of waste heat recovery systems further enhances the overall efficiency of gas engines.

Gas Engine Market Size

Request Free Sample

Regional Analysis

Europe is estimated to contribute 41% to the growth of the global market during the forecast period. Technavio's analysts have elaborately explained the regional trends and drivers that shape the market during the forecast period.

Gas Engine Market Share by Geography

See How Gas Engine Market Demand is Rising in Europe Request Free Sample

The market is experiencing significant evolution, driven by shifting geopolitical dynamics and expanding applications. In Europe, efforts to reduce dependence on Russian gas imports through increased LNG imports and domestic shale gas production present a promising outlook for gas engine deployment. According to Technavio, this trend is expected to benefit the Russian pipeline industry, as expanding pipeline networks will likely stimulate demand for gas engines. Meanwhile, the European region continues to offer vast potential for gas engine adoption across various sectors, with the transportation industry leading the charge.

In Asia, Russia's intent to diversify its gas export market should further fuel market growth, as the region's increasing energy demand drives the need for efficient and cost-effective power generation solutions. This dynamic interplay of geopolitical factors and evolving market demands underscores the market's ongoing significance in the global energy landscape.

Gas Engine Market Share by Geography

 Customer Landscape of Gas Engine Industry

Competitive Intelligence by Technavio Analysis: Leading Players in the Gas Engine Market

Companies are implementing various strategies, such as strategic alliances, gas engine market forecast, partnerships, mergers and acquisitions, geographical expansion, and product/service launches, to enhance their presence in the industry.

Caterpillar Inc. - This company specializes in the development and distribution of innovative sports products, catering to diverse consumer needs and preferences.

The industry research and growth report includes detailed analyses of the competitive landscape of the market and information about key companies, including:

  • Caterpillar Inc.
  • Cummins Inc.
  • DEUTZ AG
  • Guangxi Yuchai Machinery Group Co. Ltd.
  • Hyundai Heavy Industries Group
  • INNIO Jenbacher GmbH and Co. OG
  • JFE Engineering Corp.
  • Kawasaki Heavy Industries Ltd.
  • Kohler Co.
  • Liebherr International Deutschland GmbH
  • MAN Energy Solutions SE
  • Mitsubishi Heavy Industries Ltd.
  • NGV Global Group
  • Rolls Royce Holdings Plc
  • Siemens Energy AG
  • Sinotruk Hong Kong Ltd.
  • Volkswagen AG
  • Wartsila Corp.
  • WeiChai Holding Group Co. Ltd.
  • Yanmar Holdings Co. Ltd.

Qualitative and quantitative analysis of companies has been conducted to help clients understand the wider business environment as well as the strengths and weaknesses of key industry players. Data is qualitatively analyzed to categorize companies as pure play, category-focused, industry-focused, and diversified; it is quantitatively analyzed to categorize companies as dominant, leading, strong, tentative, and weak.

Recent Development and News in Gas Engine Market

  • In August 2024, Caterpillar Inc. announced the launch of its latest gas engine model, the Caterpillar G3520C, featuring advanced fuel efficiency and emissions reduction technologies. This development marks a significant stride in the market, as the industry continues to prioritize sustainable energy solutions (Caterpillar Press Release, 2024).
  • In November 2024, Wärtsilä Corporation and Shell New Energies entered into a strategic partnership to accelerate the deployment of gas engines in renewable energy applications. The collaboration aims to combine Wärtsilä's engine expertise with Shell's renewable energy portfolio, targeting a market share increase in the growing renewable gas sector (Shell Newsroom, 2024).
  • In March 2025, Cummins Inc. completed the acquisition of Mercury Engine Company, a leading manufacturer of marine and industrial gas engines. This acquisition strengthens Cummins' market position and broadens its product portfolio, providing a significant boost to its industrial and power generation segments (Cummins Press Release, 2025).
  • In May 2025, the European Union approved the Market Expansion Initiative, which includes incentives for the deployment of gas engines in power generation and industrial applications. The initiative aims to reduce carbon emissions and promote the use of natural gas as a transition fuel towards a more sustainable energy future (European Commission Press Release, 2025).

Dive into Technavio's robust research methodology, blending expert interviews, extensive data synthesis, and validated models for unparalleled Gas Engine Market insights. See full methodology.

Market Scope

Report Coverage

Details

Page number

177

Base year

2023

Historic period

2018-2022

Forecast period

2024-2028

Growth momentum & CAGR

Accelerate at a CAGR of 6.77%

Market growth 2024-2028

USD 2483.3 million

Market structure

Fragmented

YoY growth 2023-2024(%)

6.22

Key countries

US, Canada, Germany, UK, Italy, France, China, India, Japan, Brazil, Egypt, UAE, Oman, Argentina, KSA, UAE, Brazil, and Rest of World (ROW)

Competitive landscape

Leading Companies, Market Positioning of Companies, Competitive Strategies, and Industry Risks

Request Free Sample

Why Choose Technavio for Gas Engine Market Insights?

"Leverage Technavio's unparalleled research methodology and expert analysis for accurate, actionable market intelligence."

The market is experiencing significant advancements as manufacturers strive to optimize engine performance and reduce environmental impact. One key area of focus is optimizing combustion chamber geometry to improve thermal efficiency and reduce fuel consumption. Another area of interest is reducing engine friction losses through advanced material selection and engine design. In terms of fuel delivery, companies are investing in improving fuel injector spray patterns and implementing advanced engine control strategies to ensure precise fuel injection and efficient combustion. Waste heat recovery system integration is also gaining traction, allowing for the conversion of wasted heat into usable energy, thereby improving overall engine efficiency. Variable valve timing continues to have a significant impact on engine performance, enabling better fuel economy and reduced emissions. The effects of different piston designs are also being explored, with some designs offering improved thermal efficiency and reduced noise, vibration, and harshness (NVH). Noise reduction techniques and engine durability testing procedures are essential for ensuring customer satisfaction and meeting regulatory compliance. Advanced engine material selection and turbocharger efficiency optimization are also critical for maintaining a competitive edge in the market. Supercharger system design considerations and exhaust gas recirculation strategies are other areas of focus, with the former offering increased power output and the latter reducing emissions. Emissions control system effectiveness and fuel consumption reduction methods are key concerns for both environmental and regulatory reasons. Specific fuel consumption improvement and engine performance mapping techniques are essential for optimizing engine output and reducing operating costs. Engine control unit calibration and diagnostics and troubleshooting are also crucial for maintaining engine performance and ensuring efficient operations. Compared to traditional engines, these advanced technologies offer significant improvements in fuel efficiency and emissions reduction, making them an attractive option for businesses seeking to reduce their carbon footprint and improve operational efficiency. For instance, some manufacturers report up to 15% reduction in fuel consumption through the implementation of these technologies. These advancements are driving growth in the market, making it an exciting space for innovation and investment.

What are the Key Data Covered in this Gas Engine Market Research and Growth Report?

  • What is the expected growth of the Gas Engine Market between 2024 and 2028?

    • USD 2.48 billion, at a CAGR of 6.77%

  • What segmentation does the market report cover?

    • The report is segmented by Application (Power generation, Co-generation, and Others), End-user (Power, Industrial, Residential, and Commercial), Geography (Europe, North America, APAC, South America, and Middle East and Africa), Power Output (Up to 1 MW, 1 MW to 2 MW, 2 MW to 5 MW, and Above 5 MW), and Fuel Type (Natural Gas, Biogas, Landfill Gas, Propane, and Other Gases)

  • Which regions are analyzed in the report?

    • Europe, North America, APAC, South America, and Middle East and Africa

  • What are the key growth drivers and market challenges?

    • Expanding gas generator market, Irregularities in natural gas reserves and supplies

  • Who are the major players in the Gas Engine Market?

    • Caterpillar Inc., Cummins Inc., DEUTZ AG, Guangxi Yuchai Machinery Group Co. Ltd., Hyundai Heavy Industries Group, INNIO Jenbacher GmbH and Co. OG, JFE Engineering Corp., Kawasaki Heavy Industries Ltd., Kohler Co., Liebherr International Deutschland GmbH, MAN Energy Solutions SE, Mitsubishi Heavy Industries Ltd., NGV Global Group, Rolls Royce Holdings Plc, Siemens Energy AG, Sinotruk Hong Kong Ltd., Volkswagen AG, Wartsila Corp., WeiChai Holding Group Co. Ltd., and Yanmar Holdings Co. Ltd.

We can help! Our analysts can customize this gas engine market research report to meet your requirements.

Get in touch

1 Executive Summary

  • 1.1 Market overview
    • Executive Summary - Chart on Market Overview
    • Executive Summary - Data Table on Market Overview
    • Executive Summary - Chart on Global Market Characteristics
    • Executive Summary - Chart on Market by Geography
    • Executive Summary - Chart on Market Segmentation by Application
    • Executive Summary - Chart on Market Segmentation by End-user
    • Executive Summary - Chart on Incremental Growth
    • Executive Summary - Data Table on Incremental Growth
    • Executive Summary - Chart on Company Market Positioning

2 Market Landscape

  • 2.1 Market ecosystem
    • Parent Market
    • Data Table on - Parent Market
  • 2.2 Market characteristics
    • Market characteristics analysis
  • 2.3 Value chain analysis
    • Value Chain Analysis

3 Market Sizing

  • 3.1 Market definition
    • Offerings of companies included in the market definition
  • 3.2 Market segment analysis
    • Market segments
  • 3.3 Market size 2023
    • 3.4 Market outlook: Forecast for 2023-2028
      • Chart on Global - Market size and forecast 2023-2028 ($ million)
      • Data Table on Global - Market size and forecast 2023-2028 ($ million)
      • Chart on Global Market: Year-over-year growth 2023-2028 (%)
      • Data Table on Global Market: Year-over-year growth 2023-2028 (%)

    4 Historic Market Size

    • 4.1 Global Gas Engine Market 2018 - 2022
      • Historic Market Size - Data Table on Global Gas Engine Market 2018 - 2022 ($ million)
    • 4.2 Application segment analysis 2018 - 2022
      • Historic Market Size - Application Segment 2018 - 2022 ($ million)
    • 4.3 End-user segment analysis 2018 - 2022
      • Historic Market Size - End-user Segment 2018 - 2022 ($ million)
    • 4.4 Geography segment analysis 2018 - 2022
      • Historic Market Size - Geography Segment 2018 - 2022 ($ million)
    • 4.5 Country segment analysis 2018 - 2022
      • Historic Market Size - Country Segment 2018 - 2022 ($ million)

    5 Five Forces Analysis

    • 5.1 Five forces summary
      • Five forces analysis - Comparison between 2023 and 2028
    • 5.2 Bargaining power of buyers
      • Bargaining power of buyers - Impact of key factors 2023 and 2028
    • 5.3 Bargaining power of suppliers
      • Bargaining power of suppliers - Impact of key factors in 2023 and 2028
    • 5.4 Threat of new entrants
      • Threat of new entrants - Impact of key factors in 2023 and 2028
    • 5.5 Threat of substitutes
      • Threat of substitutes - Impact of key factors in 2023 and 2028
    • 5.6 Threat of rivalry
      • Threat of rivalry - Impact of key factors in 2023 and 2028
    • 5.7 Market condition
      • Chart on Market condition - Five forces 2023 and 2028

    6 Market Segmentation by Application

    • 6.1 Market segments
      • Chart on Application - Market share (2023-2028) (%)
      • Data Table on Application - Market share (2023-2028) (%)
    • 6.2 Comparison by Application
      • Chart on Comparison by Application
      • Data Table on Comparison by Application
    • 6.3 Power generation - Market size and forecast (2023-2028)
      • Chart on Power generation - Market size and forecast (2023-2028) ($ million)
      • Data Table on Power generation - Market size and forecast (2023-2028) ($ million)
      • Chart on Power generation - Year-over-year growth (2023-2028) (%)
      • Data Table on Power generation - Year-over-year growth (2023-2028) (%)
    • 6.4 Co-generation - Market size and forecast (2023-2028)
      • Chart on Co-generation - Market size and forecast (2023-2028) ($ million)
      • Data Table on Co-generation - Market size and forecast (2023-2028) ($ million)
      • Chart on Co-generation - Year-over-year growth (2023-2028) (%)
      • Data Table on Co-generation - Year-over-year growth (2023-2028) (%)
    • 6.5 Others - Market size and forecast (2023-2028)
      • Chart on Others - Market size and forecast (2023-2028) ($ million)
      • Data Table on Others - Market size and forecast (2023-2028) ($ million)
      • Chart on Others - Year-over-year growth (2023-2028) (%)
      • Data Table on Others - Year-over-year growth (2023-2028) (%)
    • 6.6 Market opportunity by Application
      • Market opportunity by Application ($ million)
      • Data Table on Market opportunity by Application ($ million)

    7 Market Segmentation by End-user

    • 7.1 Market segments
      • Chart on End-user - Market share (2023-2028) (%)
      • Data Table on End-user - Market share (2023-2028) (%)
    • 7.2 Comparison by End-user
      • Chart on Comparison by End-user
      • Data Table on Comparison by End-user
    • 7.3 Power - Market size and forecast (2023-2028)
      • Chart on Power - Market size and forecast (2023-2028) ($ million)
      • Data Table on Power - Market size and forecast (2023-2028) ($ million)
      • Chart on Power - Year-over-year growth (2023-2028) (%)
      • Data Table on Power - Year-over-year growth (2023-2028) (%)
    • 7.4 Industrial - Market size and forecast (2023-2028)
      • Chart on Industrial - Market size and forecast (2023-2028) ($ million)
      • Data Table on Industrial - Market size and forecast (2023-2028) ($ million)
      • Chart on Industrial - Year-over-year growth (2023-2028) (%)
      • Data Table on Industrial - Year-over-year growth (2023-2028) (%)
    • 7.5 Residential - Market size and forecast (2023-2028)
      • Chart on Residential - Market size and forecast (2023-2028) ($ million)
      • Data Table on Residential - Market size and forecast (2023-2028) ($ million)
      • Chart on Residential - Year-over-year growth (2023-2028) (%)
      • Data Table on Residential - Year-over-year growth (2023-2028) (%)
    • 7.6 Commercial - Market size and forecast (2023-2028)
      • Chart on Commercial - Market size and forecast (2023-2028) ($ million)
      • Data Table on Commercial - Market size and forecast (2023-2028) ($ million)
      • Chart on Commercial - Year-over-year growth (2023-2028) (%)
      • Data Table on Commercial - Year-over-year growth (2023-2028) (%)
    • 7.7 Market opportunity by End-user
      • Market opportunity by End-user ($ million)
      • Data Table on Market opportunity by End-user ($ million)

    8 Market Segmentation by Power Output

    • 8.1 Market segments
      • Chart on Power Output - Market share (2023-2028) (%)
      • Data Table on Power Output - Market share (2023-2028) (%)
    • 8.2 Comparison by Power Output
      • Chart on Comparison by Power Output
      • Data Table on Comparison by Power Output
    • 8.3 Up to 1 MW - Market size and forecast (2023-2028)
      • Chart on Up to 1 MW - Market size and forecast (2023-2028) ($ million)
      • Data Table on Up to 1 MW - Market size and forecast (2023-2028) ($ million)
      • Chart on Up to 1 MW - Year-over-year growth (2023-2028) (%)
      • Data Table on Up to 1 MW - Year-over-year growth (2023-2028) (%)
    • 1 MW to 2 MW - Market size and forecast (2023-2028)
      • Chart on 1 MW to 2 MW - Market size and forecast (2023-2028) ($ million)
      • Data Table on 1 MW to 2 MW - Market size and forecast (2023-2028) ($ million)
      • Chart on 1 MW to 2 MW - Year-over-year growth (2023-2028) (%)
      • Data Table on 1 MW to 2 MW - Year-over-year growth (2023-2028) (%)
    • 2 MW to 5 MW - Market size and forecast (2023-2028)
      • Chart on 2 MW to 5 MW - Market size and forecast (2023-2028) ($ million)
      • Data Table on 2 MW to 5 MW - Market size and forecast (2023-2028) ($ million)
      • Chart on 2 MW to 5 MW - Year-over-year growth (2023-2028) (%)
      • Data Table on 2 MW to 5 MW - Year-over-year growth (2023-2028) (%)
    • 8.6 Above 5 MW - Market size and forecast (2023-2028)
      • Chart on Above 5 MW - Market size and forecast (2023-2028) ($ million)
      • Data Table on Above 5 MW - Market size and forecast (2023-2028) ($ million)
      • Chart on Above 5 MW - Year-over-year growth (2023-2028) (%)
      • Data Table on Above 5 MW - Year-over-year growth (2023-2028) (%)
    • 8.7 Market opportunity by Power Output
      • Market opportunity by Power Output ($ million)
      • Data Table on Market opportunity by Power Output ($ million)

    9 Market Segmentation by Fuel Type

    • 9.1 Market segments
      • Chart on Fuel Type - Market share (2023-2028) (%)
      • Data Table on Fuel Type - Market share (2023-2028) (%)
    • 9.2 Comparison by Fuel Type
      • Chart on Comparison by Fuel Type
      • Data Table on Comparison by Fuel Type
    • 9.3 Natural Gas - Market size and forecast (2023-2028)
      • Chart on Natural Gas - Market size and forecast (2023-2028) ($ million)
      • Data Table on Natural Gas - Market size and forecast (2023-2028) ($ million)
      • Chart on Natural Gas - Year-over-year growth (2023-2028) (%)
      • Data Table on Natural Gas - Year-over-year growth (2023-2028) (%)
    • 9.4 Biogas - Market size and forecast (2023-2028)
      • Chart on Biogas - Market size and forecast (2023-2028) ($ million)
      • Data Table on Biogas - Market size and forecast (2023-2028) ($ million)
      • Chart on Biogas - Year-over-year growth (2023-2028) (%)
      • Data Table on Biogas - Year-over-year growth (2023-2028) (%)
    • 9.5 Landfill Gas - Market size and forecast (2023-2028)
      • Chart on Landfill Gas - Market size and forecast (2023-2028) ($ million)
      • Data Table on Landfill Gas - Market size and forecast (2023-2028) ($ million)
      • Chart on Landfill Gas - Year-over-year growth (2023-2028) (%)
      • Data Table on Landfill Gas - Year-over-year growth (2023-2028) (%)
    • 9.6 Propane - Market size and forecast (2023-2028)
      • Chart on Propane - Market size and forecast (2023-2028) ($ million)
      • Data Table on Propane - Market size and forecast (2023-2028) ($ million)
      • Chart on Propane - Year-over-year growth (2023-2028) (%)
      • Data Table on Propane - Year-over-year growth (2023-2028) (%)
    • 9.7 Other Gases - Market size and forecast (2023-2028)
      • Chart on Other Gases - Market size and forecast (2023-2028) ($ million)
      • Data Table on Other Gases - Market size and forecast (2023-2028) ($ million)
      • Chart on Other Gases - Year-over-year growth (2023-2028) (%)
      • Data Table on Other Gases - Year-over-year growth (2023-2028) (%)
    • 9.8 Market opportunity by Fuel Type
      • Market opportunity by Fuel Type ($ million)
      • Data Table on Market opportunity by Fuel Type ($ million)

    10 Customer Landscape

    • 10.1 Customer landscape overview
      • Analysis of price sensitivity, lifecycle, customer purchase basket, adoption rates, and purchase criteria

    11 Geographic Landscape

    • 11.1 Geographic segmentation
      • Chart on Market share by geography 2023-2028 (%)
      • Data Table on Market share by geography 2023-2028 (%)
    • 11.2 Geographic comparison
      • Chart on Geographic comparison
      • Data Table on Geographic comparison
    • 11.3 Europe - Market size and forecast 2023-2028
      • Chart on Europe - Market size and forecast 2023-2028 ($ million)
      • Data Table on Europe - Market size and forecast 2023-2028 ($ million)
      • Chart on Europe - Year-over-year growth 2023-2028 (%)
      • Data Table on Europe - Year-over-year growth 2023-2028 (%)
    • 11.4 North America - Market size and forecast 2023-2028
      • Chart on North America - Market size and forecast 2023-2028 ($ million)
      • Data Table on North America - Market size and forecast 2023-2028 ($ million)
      • Chart on North America - Year-over-year growth 2023-2028 (%)
      • Data Table on North America - Year-over-year growth 2023-2028 (%)
    • 11.5 APAC - Market size and forecast 2023-2028
      • Chart on APAC - Market size and forecast 2023-2028 ($ million)
      • Data Table on APAC - Market size and forecast 2023-2028 ($ million)
      • Chart on APAC - Year-over-year growth 2023-2028 (%)
      • Data Table on APAC - Year-over-year growth 2023-2028 (%)
    • 11.6 South America - Market size and forecast 2023-2028
      • Chart on South America - Market size and forecast 2023-2028 ($ million)
      • Data Table on South America - Market size and forecast 2023-2028 ($ million)
      • Chart on South America - Year-over-year growth 2023-2028 (%)
      • Data Table on South America - Year-over-year growth 2023-2028 (%)
    • 11.7 Middle East and Africa - Market size and forecast 2023-2028
      • Chart on Middle East and Africa - Market size and forecast 2023-2028 ($ million)
      • Data Table on Middle East and Africa - Market size and forecast 2023-2028 ($ million)
      • Chart on Middle East and Africa - Year-over-year growth 2023-2028 (%)
      • Data Table on Middle East and Africa - Year-over-year growth 2023-2028 (%)
    • 11.8 US - Market size and forecast 2023-2028
      • Chart on US - Market size and forecast 2023-2028 ($ million)
      • Data Table on US - Market size and forecast 2023-2028 ($ million)
      • Chart on US - Year-over-year growth 2023-2028 (%)
      • Data Table on US - Year-over-year growth 2023-2028 (%)
    • 11.9 Germany - Market size and forecast 2023-2028
      • Chart on Germany - Market size and forecast 2023-2028 ($ million)
      • Data Table on Germany - Market size and forecast 2023-2028 ($ million)
      • Chart on Germany - Year-over-year growth 2023-2028 (%)
      • Data Table on Germany - Year-over-year growth 2023-2028 (%)
    • 11.10 China - Market size and forecast 2023-2028
      • Chart on China - Market size and forecast 2023-2028 ($ million)
      • Data Table on China - Market size and forecast 2023-2028 ($ million)
      • Chart on China - Year-over-year growth 2023-2028 (%)
      • Data Table on China - Year-over-year growth 2023-2028 (%)
    • 11.11 France - Market size and forecast 2023-2028
      • Chart on France - Market size and forecast 2023-2028 ($ million)
      • Data Table on France - Market size and forecast 2023-2028 ($ million)
      • Chart on France - Year-over-year growth 2023-2028 (%)
      • Data Table on France - Year-over-year growth 2023-2028 (%)
    • 11.12 Japan - Market size and forecast 2023-2028
      • Chart on Japan - Market size and forecast 2023-2028 ($ million)
      • Data Table on Japan - Market size and forecast 2023-2028 ($ million)
      • Chart on Japan - Year-over-year growth 2023-2028 (%)
      • Data Table on Japan - Year-over-year growth 2023-2028 (%)
    • 11.13 Market opportunity by geography
      • Market opportunity by geography ($ million)
      • Data Tables on Market opportunity by geography ($ million)
    • 11.14 Canada - Market size and forecast (2023-2028)
      • Chart on Canada - Market size and forecast (2023-2028) ($ million)
      • Data Table on Canada - Market size and forecast (2023-2028) ($ million)
      • Chart on Canada - Year-over-year growth (2023-2028) (%)
      • Data Table on Canada - Year-over-year growth (2023-2028) (%)
    • 11.15 UK - Market size and forecast (2023-2028)
      • Chart on UK - Market size and forecast (2023-2028) ($ million)
      • Data Table on UK - Market size and forecast (2023-2028) ($ million)
      • Chart on UK - Year-over-year growth (2023-2028) (%)
      • Data Table on UK - Year-over-year growth (2023-2028) (%)
    • 11.16 Italy - Market size and forecast (2023-2028)
      • Chart on Italy - Market size and forecast (2023-2028) ($ million)
      • Data Table on Italy - Market size and forecast (2023-2028) ($ million)
      • Chart on Italy - Year-over-year growth (2023-2028) (%)
      • Data Table on Italy - Year-over-year growth (2023-2028) (%)
    • 11.17 India - Market size and forecast (2023-2028)
      • Chart on India - Market size and forecast (2023-2028) ($ million)
      • Data Table on India - Market size and forecast (2023-2028) ($ million)
      • Chart on India - Year-over-year growth (2023-2028) (%)
      • Data Table on India - Year-over-year growth (2023-2028) (%)
    • 11.18 Brazil - Market size and forecast (2023-2028)
      • Chart on Brazil - Market size and forecast (2023-2028) ($ million)
      • Data Table on Brazil - Market size and forecast (2023-2028) ($ million)
      • Chart on Brazil - Year-over-year growth (2023-2028) (%)
      • Data Table on Brazil - Year-over-year growth (2023-2028) (%)
    • 11.19 Egypt - Market size and forecast (2023-2028)
      • Chart on Egypt - Market size and forecast (2023-2028) ($ million)
      • Data Table on Egypt - Market size and forecast (2023-2028) ($ million)
      • Chart on Egypt - Year-over-year growth (2023-2028) (%)
      • Data Table on Egypt - Year-over-year growth (2023-2028) (%)
    • 11.20 UAE - Market size and forecast (2023-2028)
      • Chart on UAE - Market size and forecast (2023-2028) ($ million)
      • Data Table on UAE - Market size and forecast (2023-2028) ($ million)
      • Chart on UAE - Year-over-year growth (2023-2028) (%)
      • Data Table on UAE - Year-over-year growth (2023-2028) (%)
    • 11.21 Oman - Market size and forecast (2023-2028)
      • Chart on Oman - Market size and forecast (2023-2028) ($ million)
      • Data Table on Oman - Market size and forecast (2023-2028) ($ million)
      • Chart on Oman - Year-over-year growth (2023-2028) (%)
      • Data Table on Oman - Year-over-year growth (2023-2028) (%)
    • 11.22 Argentina - Market size and forecast (2023-2028)
      • Chart on Argentina - Market size and forecast (2023-2028) ($ million)
      • Data Table on Argentina - Market size and forecast (2023-2028) ($ million)
      • Chart on Argentina - Year-over-year growth (2023-2028) (%)
      • Data Table on Argentina - Year-over-year growth (2023-2028) (%)
    • 11.23 KSA - Market size and forecast (2023-2028)
      • Chart on KSA - Market size and forecast (2023-2028) ($ million)
      • Data Table on KSA - Market size and forecast (2023-2028) ($ million)
      • Chart on KSA - Year-over-year growth (2023-2028) (%)
      • Data Table on KSA - Year-over-year growth (2023-2028) (%)
    • 11.24 Rest of World (ROW) - Market size and forecast (2023-2028)
      • Chart on Rest of World (ROW) - Market size and forecast (2023-2028) ($ million)
      • Data Table on Rest of World (ROW) - Market size and forecast (2023-2028) ($ million)
      • Chart on Rest of World (ROW) - Year-over-year growth (2023-2028) (%)
      • Data Table on Rest of World (ROW) - Year-over-year growth (2023-2028) (%)

    12 Drivers, Challenges, and Opportunity/Restraints

    • 12.1 Market drivers
      • 12.2 Market challenges
        • 12.3 Impact of drivers and challenges
          • Impact of drivers and challenges in 2023 and 2028
        • 12.4 Market opportunities/restraints

          13 Competitive Landscape

          • 13.1 Overview
            • 13.2 Competitive Landscape
              • Overview on criticality of inputs and factors of differentiation
            • 13.3 Landscape disruption
              • Overview on factors of disruption
            • 13.4 Industry risks
              • Impact of key risks on business

            14 Competitive Analysis

            • 14.1 Companies profiled
              • Companies covered
            • 14.2 Market positioning of companies
              • Matrix on companies position and classification
            • 14.3 Caterpillar Inc.
              • Caterpillar Inc. - Overview
              • Caterpillar Inc. - Business segments
              • Caterpillar Inc. - Key news
              • Caterpillar Inc. - Key offerings
              • Caterpillar Inc. - Segment focus
            • 14.4 Cummins Inc.
              • Cummins Inc. - Overview
              • Cummins Inc. - Business segments
              • Cummins Inc. - Key offerings
              • Cummins Inc. - Segment focus
            • 14.5 Guangxi Yuchai Machinery Group Co. Ltd.
              • Guangxi Yuchai Machinery Group Co. Ltd. - Overview
              • Guangxi Yuchai Machinery Group Co. Ltd. - Product / Service
              • Guangxi Yuchai Machinery Group Co. Ltd. - Key offerings
            • 14.6 Hyundai Heavy Industries Group
              • Hyundai Heavy Industries Group - Overview
              • Hyundai Heavy Industries Group - Product / Service
              • Hyundai Heavy Industries Group - Key offerings
            • 14.7 INNIO Jenbacher GmbH and Co. OG
              • INNIO Jenbacher GmbH and Co. OG - Overview
              • INNIO Jenbacher GmbH and Co. OG - Product / Service
              • INNIO Jenbacher GmbH and Co. OG - Key offerings
            • 14.8 JFE Engineering Corp.
              • JFE Engineering Corp. - Overview
              • JFE Engineering Corp. - Product / Service
              • JFE Engineering Corp. - Key offerings
            • 14.9 Kawasaki Heavy Industries Ltd.
              • Kawasaki Heavy Industries Ltd. - Overview
              • Kawasaki Heavy Industries Ltd. - Business segments
              • Kawasaki Heavy Industries Ltd. - Key offerings
              • Kawasaki Heavy Industries Ltd. - Segment focus
            • 14.10 Kohler Co.
              • Kohler Co. - Overview
              • Kohler Co. - Product / Service
              • Kohler Co. - Key news
              • Kohler Co. - Key offerings
            • 14.11 Liebherr International Deutschland GmbH
              • Liebherr International Deutschland GmbH - Overview
              • Liebherr International Deutschland GmbH - Product / Service
              • Liebherr International Deutschland GmbH - Key offerings
            • 14.12 MAN Energy Solutions SE
              • MAN Energy Solutions SE - Overview
              • MAN Energy Solutions SE - Product / Service
              • MAN Energy Solutions SE - Key offerings
            • 14.13 Mitsubishi Heavy Industries Ltd.
              • Mitsubishi Heavy Industries Ltd. - Overview
              • Mitsubishi Heavy Industries Ltd. - Business segments
              • Mitsubishi Heavy Industries Ltd. - Key news
              • Mitsubishi Heavy Industries Ltd. - Key offerings
              • Mitsubishi Heavy Industries Ltd. - Segment focus
            • 14.14 Rolls Royce Holdings Plc
              • Rolls Royce Holdings Plc - Overview
              • Rolls Royce Holdings Plc - Business segments
              • Rolls Royce Holdings Plc - Key offerings
              • Rolls Royce Holdings Plc - Segment focus
            • 14.15 Sinotruk Hong Kong Ltd.
              • Sinotruk Hong Kong Ltd. - Overview
              • Sinotruk Hong Kong Ltd. - Business segments
              • Sinotruk Hong Kong Ltd. - Key offerings
              • Sinotruk Hong Kong Ltd. - Segment focus
            • 14.16 Volkswagen AG
              • Volkswagen AG - Overview
              • Volkswagen AG - Business segments
              • Volkswagen AG - Key offerings
              • Volkswagen AG - Segment focus
            • 14.17 WeiChai Holding Group Co. Ltd.
              • WeiChai Holding Group Co. Ltd. - Overview
              • WeiChai Holding Group Co. Ltd. - Product / Service
              • WeiChai Holding Group Co. Ltd. - Key offerings

            15 Appendix

            • 15.1 Scope of the report
              • 15.2 Inclusions and exclusions checklist
                • Inclusions checklist
                • Exclusions checklist
              • 15.3 Currency conversion rates for US$
                • Currency conversion rates for US$
              • 15.4 Research methodology
                • Research methodology
              • 15.5 Data procurement
                • Information sources
              • 15.6 Data validation
                • Data validation
              • 15.7 Validation techniques employed for market sizing
                • Validation techniques employed for market sizing
              • 15.8 Data synthesis
                • Data synthesis
              • 15.9 360 degree market analysis
                • 360 degree market analysis
              • 15.10 List of abbreviations
                • List of abbreviations

              Research Methodology

              Technavio presents a detailed picture of the market by way of study, synthesis, and summation of data from multiple sources. The analysts have presented the various facets of the market with a particular focus on identifying the key industry influencers. The data thus presented is comprehensive, reliable, and the result of extensive research, both primary and secondary.

              INFORMATION SOURCES

              Primary sources

              • Manufacturers and suppliers
              • Channel partners
              • Industry experts
              • Strategic decision makers

              Secondary sources

              • Industry journals and periodicals
              • Government data
              • Financial reports of key industry players
              • Historical data
              • Press releases

              DATA ANALYSIS

              Data Synthesis

              • Collation of data
              • Estimation of key figures
              • Analysis of derived insights

              Data Validation

              • Triangulation with data models
              • Reference against proprietary databases
              • Corroboration with industry experts

              REPORT WRITING

              Qualitative

              • Market drivers
              • Market challenges
              • Market trends
              • Five forces analysis

              Quantitative

              • Market size and forecast
              • Market segmentation
              • Geographical insights
              • Competitive landscape

              Interested in this report?

              Get your sample now to see our research methodology and insights!

              Download Now

              Frequently Asked Questions

              Gas Engine market growth will increase by $ 2483.3 mn during 2024-2028 .

              The Gas Engine market is expected to grow at a CAGR of 6.77% during 2024-2028 .

              Gas Engine market is segmented by Application( Power generation, Co-generation, Others, Commercial) End-user( Power, Industrial, Residential, Commercial)

              Caterpillar Inc., Cummins Inc., DEUTZ AG, Guangxi Yuchai Machinery Group Co. Ltd., Hyundai Heavy Industries Group, INNIO Jenbacher GmbH and Co. OG, JFE Engineering Corp., Kawasaki Heavy Industries Ltd., Kohler Co., Liebherr International Deutschland GmbH, MAN Energy Solutions SE, Mitsubishi Heavy Industries Ltd., NGV Global Group, Rolls Royce Holdings Plc, Siemens Energy AG, Sinotruk Hong Kong Ltd., Volkswagen AG, Wartsila Corp., WeiChai Holding Group Co. Ltd., Yanmar Holdings Co. Ltd. are a few of the key vendors in the Gas Engine market.

              Europe will register the highest growth rate of 41% among the other regions. Therefore, the Gas Engine market in Europe is expected to garner significant business opportunities for the vendors during the forecast period.

              US, Canada, Germany, UK, Italy, France, China, India, Japan, Brazil, Egypt, UAE, Oman, Argentina, KSA, UAE, Brazil, Rest of World (ROW)

              • Expanding gas generator marketGas generators use gas engines; hence they are one of the noteworthy contributors to the global gas engine market. The shortage of power and energy has become predominant following the rise in urbanization and industrial development. This is increasing the demand for gas generators. Industries are rapidly adopting gas generators to ensure continuous power supply and smooth business operations. The gas generator market shows great potential in China is the driving factor this market.
              • India is the driving factor this market.
              • and Brazil. Developing countries are experiencing higher growth when compared with other countries is the driving factor this market.
              • and the per capita income of individuals is growing steadily is the driving factor this market.
              • thus creating an increased demand for these generators. Therefore is the driving factor this market.
              • vendors have started venturing into developing countries. However is the driving factor this market.
              • the market in many developed countries is growing slowly and moving toward the mature phase is the driving factor this market.
              • especially in Europe and North America. Overall is the driving factor this market.
              • the gas generator market is experiencing a strong potential for gas generators is the driving factor this market.
              • especially in the industrial sector. Concerns about environmental sustainability due to the use of diesel generators are also a driving factor for the growing gas generator market is the driving factor this market.
              • especially in the industrial sector. This is because gas generators release fewer pollutants than diesel generators which is the driving factor this market.
              • in turn is the driving factor this market.
              • fuel the growth of the global gas engine market growth during the forecast period.  is the driving factor this market.

              The Gas Engine market vendors should focus on grabbing business opportunities from the Power generation segment as it accounted for the largest market share in the base year.