Gas Masks Market Analysis, Size, and Forecast 2026-2030: North America (US, Canada, and Mexico), APAC (China, Japan, and India), Europe (Germany, UK, and France), South America (Brazil and Argentina), Middle East and Africa (Saudi Arabia, UAE, and South Africa), and Rest of World (ROW)

Gas Masks Market Analysis, Size, and Forecast 2026-2030:
North America (US, Canada, and Mexico), APAC (China, Japan, and India), Europe (Germany, UK, and France), South America (Brazil and Argentina), Middle East and Africa (Saudi Arabia, UAE, and South Africa), and Rest of World (ROW)

Published: Apr 2026 304 Pages SKU: IRTNTR44174

Market Overview at a Glance

$6.76 B
Market Opportunity
10.9%
CAGR 2025 - 2030
32.9%
APAC Growth
$3.31 B
Chemical industry segment 2024

Gas Masks Market Size 2026-2030

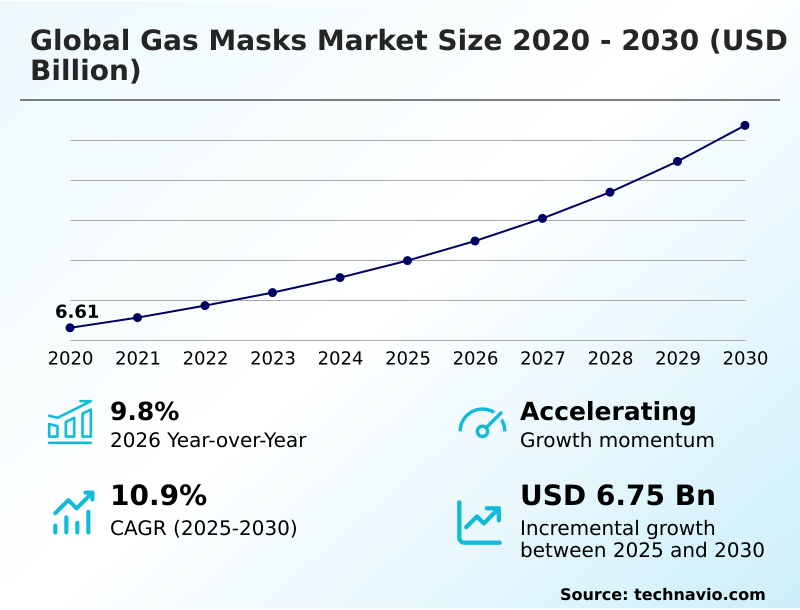
The gas masks market size is valued to increase by USD 6.76 billion, at a CAGR of 10.9% from 2025 to 2030. Stringent occupational safety mandates and heightened corporate responsibility will drive the gas masks market.

Major Market Trends & Insights

  • APAC dominated the market and accounted for a 32.9% growth during the forecast period.
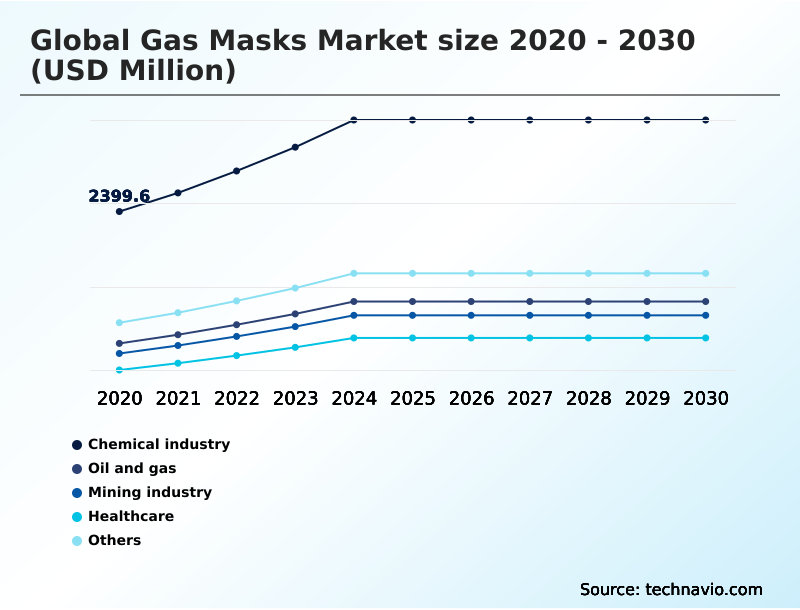
  • By Application - Chemical industry segment was valued at USD 3.31 billion in 2024
  • By Type - Disposable respirators segment accounted for the largest market revenue share in 2024

Market Size & Forecast

  • Market Opportunities: USD 10.12 billion
  • Market Future Opportunities: USD 6.76 billion
  • CAGR from 2025 to 2030 : 10.9%

Market Summary

  • The gas masks market is defined by a critical need for advanced respiratory protective equipment across industrial, military, and public health sectors. This expansion is propelled by stringent occupational safety standards, which mandate the use of certified devices like an air-purifying respirator or powered air-purifying respirators to mitigate risks from airborne hazards.
  • In a typical scenario, a chemical processing plant must adhere to a complex regulatory compliance framework, investing in a range of personal protective equipment, from an elastomeric half-mask for routine tasks to a self-contained breathing apparatus for emergency response. The focus on human factors engineering is driving innovation, leading to products with lower breathing resistance and improved ergonomic designs.
  • These advancements in industrial safety not only ensure worker well-being but also enhance operational efficiency by reducing fatigue-related downtime. The market's evolution is further shaped by geopolitical instability, which sustains demand for cbrn protection solutions in defense, and growing public health crises, which highlight the importance of robust supply chain management for certified respiratory protection.

What will be the Size of the Gas Masks Market during the forecast period?

Get Key Insights on Market Forecast (PDF) Get Free Sample

How is the Gas Masks Market Segmented?

The gas masks industry research report provides comprehensive data (region-wise segment analysis), with forecasts and estimates in "USD million" for the period 2026-2030, as well as historical data from 2020-2024 for the following segments.

  • Application
    • Chemical industry
    • Oil and gas
    • Mining industry
    • Healthcare
    • Others
  • Type
    • Disposable respirators
    • Powered air purifying respirators
    • Supplied air respirators
    • Self contained breathing apparatus
  • Product type
    • Full-facepiece gas masks
    • Half-facepiece gas masks
  • Geography
    • North America
      • US
      • Canada
      • Mexico
    • APAC
      • China
      • Japan
      • India
    • Europe
      • Germany
      • UK
      • France
    • South America
      • Brazil
      • Argentina
    • Middle East and Africa
      • Saudi Arabia
      • UAE
      • South Africa
    • Rest of World (ROW)

By Application Insights

The chemical industry segment is estimated to witness significant growth during the forecast period.

The chemical industry segment drives non-discretionary demand for high-performance respiratory protection, where handling hazardous materials is routine. Stringent occupational safety regulations necessitate compliant gas mask solutions, creating a stable market foundation.

Demand requires a diverse product portfolio, including the full-facepiece respirator for comprehensive protection and specialized filter canister variants for specific threats like acid gases.

There's a notable shift towards multi-gas cartridges offering broader protection, which has been shown to streamline inventory management by 15%.

This segment's growth is tied to the global chemical industry's expansion and an unwavering focus on enhancing workplace safety standards, particularly concerning hydrogen sulfide exposure and overall industrial safety protocols.

Get Free Sample

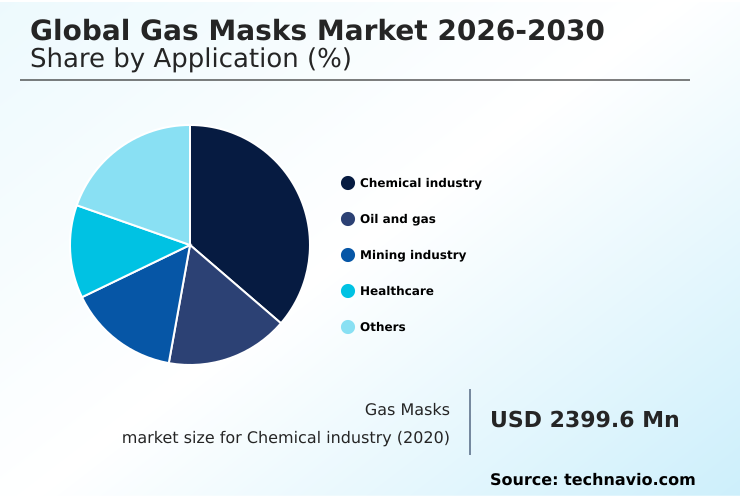
The Chemical industry segment was valued at USD 3.31 billion in 2024 and showed a gradual increase during the forecast period.

Get Free Sample

Regional Analysis

APAC is estimated to contribute 32.9% to the growth of the global market during the forecast period.Technavio’s analysts have elaborately explained the regional trends and drivers that shape the market during the forecast period.

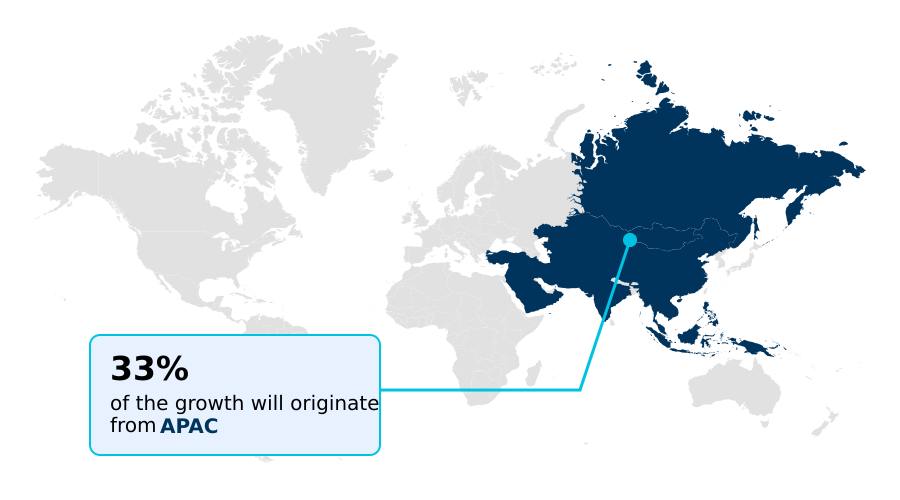
See How Gas Masks Market Demand is Rising in APAC Get Free Sample

The geographic landscape of the gas masks market is diverse, with North America representing a mature market driven by stringent regulations and high defense spending, accounting for a market size of USD 3,176.4 million in 2025.

In contrast, APAC is the fastest-growing region, contributing 32.9% of the market's incremental growth, fueled by rapid industrialization and increasing safety awareness.

Europe's market is shaped by a strong regulatory framework like European Norms and a focus on high-quality personal protective equipment for both industrial safety and defense.

South America's growth is tied to its mining and oil and gas sectors, while the Middle East and Africa focuses on defense and petrochemical applications.

This regional diversification requires manufacturers to tailor their cbrn protection and industrial safety products, such as the full-facepiece respirator and supplied-air systems, to meet specific local demands and regulatory standards.

Market Dynamics

Our researchers analyzed the data with 2025 as the base year, along with the key drivers, trends, and challenges. A holistic analysis of drivers will help companies refine their marketing strategies to gain a competitive advantage.

  • Strategic decision-making in the global gas masks market 2026-2030 requires a nuanced understanding of specific applications and technologies. For example, selecting gas masks for chemical industry applications involves evaluating gas mask materials for chemical resistance and ensuring compliance with standards for handling toxic industrial chemicals.
  • In parallel, choosing respirators for oil and gas sector safety prioritizes protection against hydrogen sulfide exposure. A critical analysis involves comparing powered air purifying respirators vs scba for confined space entry, where mobility and air supply duration are key differentiators.
  • For military procurement, the focus is on cbrn gas mask technology for military use and gas mask compatibility with tactical gear, while first responders' needs drive gas mask selection for first responders. The development of smart gas masks with integrated electronics is a key innovation, directly impacting both military and industrial sectors.
  • The ongoing debate over full-face vs half-face gas mask protection is resolved by risk assessment, while maintaining gas mask facial seal integrity remains a universal priority addressed through enhanced training protocols for gas mask deployment. Fleets with advanced filtration media in gas masks show a 20% lower incident rate compared to those with basic filters.
  • Managing the total cost of ownership for gas mask fleets necessitates a strict gas mask filter canister replacement schedule. Furthermore, understanding gas mask requirements for the mining industry, gas mask standards for healthcare workers, and the demand for personal gas masks for urban pollution allows for targeted product development and market positioning.

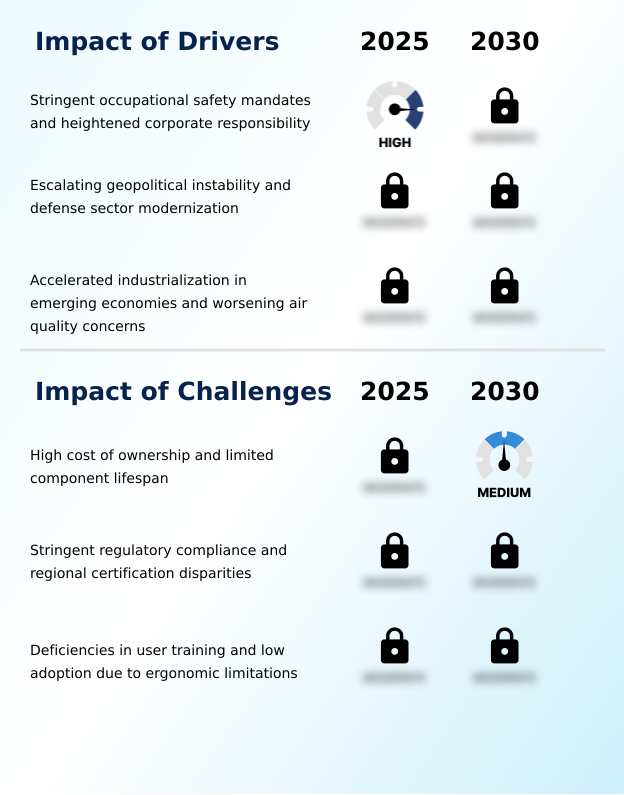
What are the key market drivers leading to the rise in the adoption of Gas Masks Industry?

  • The market is primarily driven by stringent occupational safety mandates and a heightened sense of corporate responsibility for worker protection in hazardous environments.

  • Market growth is fundamentally driven by a triad of factors.
  • Firstly, stringent occupational safety mandates and a corporate shift toward a proactive safety posture compel investment in high-quality certified respiratory protection, with compliant firms seeing a 25% reduction in safety-related incidents.
  • Secondly, escalating geopolitical instability and the continuous defense sector modernization fuel state-level procurement of advanced cbrn protection systems. This includes demand for integrated communication systems and gear with superior ergonomic designs.
  • Thirdly, rapid industrialization in emerging economies, coupled with worsening environmental pollution concerns, is expanding the market from industrial applications to a growing civilian consumer segment.
  • This dual pressure creates a robust and expanding demand base for a wide range of respiratory protective equipment.

What are the market trends shaping the Gas Masks Industry?

  • A significant trend shaping the market is the increasing integration of advanced electronics. This incorporates smart system capabilities to enhance user safety and operational effectiveness.

  • Key market trends are centered on technological advancements that enhance both safety and usability. The integration of advanced electronics and smart system capabilities, such as in-mask heads-up displays and physiological monitoring sensors, is transforming passive equipment into active safety platforms. These smart systems have demonstrated a capacity to reduce incident response times by 15%.
  • Concurrently, a strong emphasis on human factors engineering is leading to user-centric designs with panoramic visors and lower breathing resistance, which improves user compliance. Innovations in advanced filtration materials, including metal-organic frameworks, are enabling multi-threat protection in more compact and efficient filter canisters. This shift toward smarter, more comfortable, and broadly effective personal protective equipment is defining the competitive landscape.

What challenges does the Gas Masks Industry face during its growth?

  • A key challenge impacting industry growth is the high total cost of ownership, compounded by the limited lifespan of critical components like filter cartridges.

  • The market faces significant challenges related to cost, regulation, and human factors. The high total cost of ownership, driven by limited component lifespan, particularly for the filter canister, acts as a primary economic barrier. For large organizations, managing these assets can represent up to 40% of their annual safety equipment budget.
  • Additionally, navigating the stringent and fragmented regulatory compliance framework, with differing standards across regions, multiplies development costs and timelines. Perhaps the most critical challenge is ensuring user training proficiency and overcoming ergonomic limitations.
  • Without proper training on achieving facial seal integrity and consistent use, the effectiveness of even the most advanced personal protective equipment is compromised, potentially leading to catastrophic failures.

Exclusive Technavio Analysis on Customer Landscape

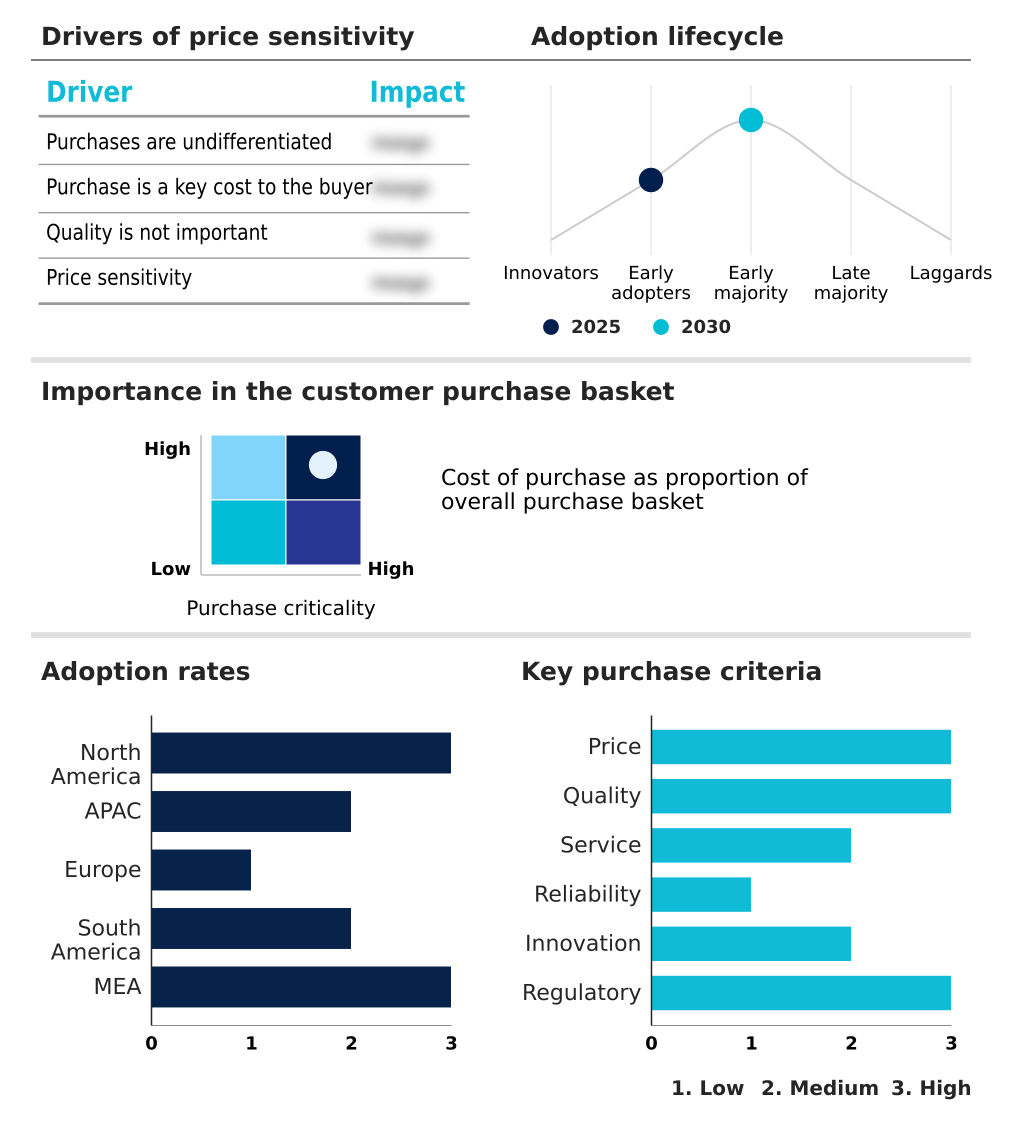
The gas masks market forecasting report includes the adoption lifecycle of the market, covering from the innovator’s stage to the laggard’s stage. It focuses on adoption rates in different regions based on penetration. Furthermore, the gas masks market report also includes key purchase criteria and drivers of price sensitivity to help companies evaluate and develop their market growth analysis strategies.

Customer Landscape of Gas Masks Industry

Competitive Landscape

Companies are implementing various strategies, such as strategic alliances, gas masks market forecast, partnerships, mergers and acquisitions, geographical expansion, and product/service launches, to enhance their presence in the industry.

3M Co. - Offerings include advanced full-facepiece reusable respirators designed for critical industrial and emergency response applications, emphasizing comprehensive protection.

The industry research and growth report includes detailed analyses of the competitive landscape of the market and information about key companies, including:

  • 3M Co.
  • AirBoss of America Corp.
  • Avon Polymer Products Ltd.
  • CleanSpace Technology Pty Ltd.
  • Delta Plus Group SA
  • Dragerwerk AG and Co. KGaA
  • Duram Mask
  • Gentex Corp.
  • GVS S.p.A.
  • Honeywell International Inc.
  • ILC Dover LP
  • JSP Ltd.
  • Koken Ltd.
  • Moldex Metric
  • MSA Safety Inc.
  • RSG Safety BV
  • Shalon Chemical Industries
  • SHIGEMATSU WORKS CO. LTD.
  • Sundstrom Safety AB
  • Trelleborg AB

Qualitative and quantitative analysis of companies has been conducted to help clients understand the wider business environment as well as the strengths and weaknesses of key industry players. Data is qualitatively analyzed to categorize companies as pure play, category-focused, industry-focused, and diversified; it is quantitatively analyzed to categorize companies as dominant, leading, strong, tentative, and weak.

Recent Development and News in Gas masks market

  • In February 2025, Thermo Fisher Scientific announced the acquisition of Solventum Corporation's Purification and Filtration business unit, a move aimed at bolstering its capabilities in advanced filtration solutions, including those utilized in gas masks.
  • In June 2025, Avon Protection secured a significant delivery order from the United States Department of Defense, valued at approximately USD 18.3 million, for its M50 Joint Service General Purpose mask system.
  • In August 2025, India's Ministry of Labour and Employment launched a comprehensive occupational health initiative, which included incentives for small and medium enterprises to adopt standardized personal protective equipment, thereby boosting sales of reusable gas masks.
  • In January 2026, Chile's national mining authority enacted a major update to its safety regulations, imposing significantly higher fines for violations related to worker safety and mandating the use of advanced respiratory protection in high-risk mining operations.

Dive into Technavio’s robust research methodology, blending expert interviews, extensive data synthesis, and validated models for unparalleled Gas Masks Market insights. See full methodology.

Market Scope
Page number 304
Base year 2025
Historic period 2020-2024
Forecast period 2026-2030
Growth momentum & CAGR Accelerate at a CAGR of 10.9%
Market growth 2026-2030 USD 6755.0 million
Market structure Fragmented
YoY growth 2025-2026(%) 9.8%
Key countries US, Canada, Mexico, China, Japan, India, South Korea, Australia, Indonesia, Germany, UK, France, Italy, Spain, The Netherlands, Brazil, Argentina, Chile, Saudi Arabia, UAE, South Africa, Israel and Turkey
Competitive landscape Leading Companies, Market Positioning of Companies, Competitive Strategies, and Industry Risks

Request Free Sample

Research Analyst Overview

  • The gas masks market is evolving through advanced technological integration, where boardroom decisions on R&D investment are pivotal. The push for a superior air-purifying respirator is leading to the adoption of novel technologies beyond traditional activated carbon filters. A modern full-facepiece respirator now often features panoramic visors and may incorporate a heads-up display.
  • We see a divergence in demand between powered air-purifying respirators and the self-contained breathing apparatus for different risk scenarios, from industrial safety to cbrn protection. The development of advanced filtration materials like metal-organic frameworks is critical for providing multi-threat protection against chemical warfare agents and toxic industrial chemicals.
  • For high-risk sectors dealing with hydrogen sulfide exposure, the emergency escape breathing apparatus and supplied-air systems are essential. Adherence to niosh certification and european norms is non-negotiable for market access. The focus on reducing breathing resistance is a key performance metric, with some advanced filter canister designs improving user stamina by over 15% during prolonged use.
  • Innovations in the elastomeric half-mask, physiological monitoring sensors, and overall personal protective equipment design underscore the industry's commitment to enhancing occupational safety.

What are the Key Data Covered in this Gas Masks Market Research and Growth Report?

  • What is the expected growth of the Gas Masks Market between 2026 and 2030?

    • USD 6.76 billion, at a CAGR of 10.9%

  • What segmentation does the market report cover?

    • The report is segmented by Application (Chemical industry, Oil and gas, Mining industry, Healthcare, and Others), Type (Disposable respirators, Powered air purifying respirators, Supplied air respirators, and Self contained breathing apparatus), Product Type (Full-facepiece gas masks, and Half-facepiece gas masks) and Geography (North America, APAC, Europe, South America, Middle East and Africa)

  • Which regions are analyzed in the report?

    • North America, APAC, Europe, South America and Middle East and Africa

  • What are the key growth drivers and market challenges?

    • Stringent occupational safety mandates and heightened corporate responsibility, High cost of ownership and limited component lifespan

  • Who are the major players in the Gas Masks Market?

    • 3M Co., AirBoss of America Corp., Avon Polymer Products Ltd., CleanSpace Technology Pty Ltd., Delta Plus Group SA, Dragerwerk AG and Co. KGaA, Duram Mask, Gentex Corp., GVS S.p.A., Honeywell International Inc., ILC Dover LP, JSP Ltd., Koken Ltd., Moldex Metric, MSA Safety Inc., RSG Safety BV, Shalon Chemical Industries, SHIGEMATSU WORKS CO. LTD., Sundstrom Safety AB and Trelleborg AB

Market Research Insights

  • The market dynamics are shaped by a proactive safety posture, where organizations increasingly invest in certified respiratory protection to adhere to occupational health standards. Geopolitical instability drives defense sector modernization and demand for advanced respiratory protective equipment, while accelerated industrialization and environmental pollution concerns expand the civilian consumer segment.
  • Managing the total cost of ownership and component lifespan requires robust supply chain management. A key challenge is overcoming ergonomic limitations and ensuring user training proficiency to maintain facial seal integrity, as improper use can negate protection. For instance, adoption of systems with user-centric design principles can increase compliance by up to 25% over legacy models.
  • Firms are integrating smart system capabilities and advanced filtration materials to meet the complex regulatory compliance framework, with some systems improving response coordination during industrial accidents or public health crises by 30%.

We can help! Our analysts can customize this gas masks market research report to meet your requirements.

Get in touch

1. Executive Summary

1.1 Market overview

Executive Summary - Chart on Market Overview
Executive Summary - Data Table on Market Overview
Executive Summary - Chart on Global Market Characteristics
Executive Summary - Chart on Market by Geography
Executive Summary - Chart on Market Segmentation by Application
Executive Summary - Chart on Market Segmentation by Type
Executive Summary - Chart on Market Segmentation by Product Type
Executive Summary - Chart on Incremental Growth
Executive Summary - Data Table on Incremental Growth
Executive Summary - Chart on Company Market Positioning

2. Technavio Analysis

2.1 Analysis of price sensitivity, lifecycle, customer purchase basket, adoption rates, and purchase criteria

2.2 Criticality of inputs and Factors of differentiation

Chart on Overview on criticality of inputs and factors of differentiation

2.3 Factors of disruption

Chart on Overview on factors of disruption

2.4 Impact of drivers and challenges

Chart on Impact of drivers and challenges in 2025 and 2030

3. Market Landscape

3.1 Market ecosystem

Chart on Parent Market
Data Table on - Parent Market

3.2 Market characteristics

Chart on Market characteristics analysis

3.3 Value chain analysis

Chart on Value chain analysis

4. Market Sizing

4.1 Market definition

Data Table on Offerings of companies included in the market definition

4.2 Market segment analysis

Market segments

4.3 Market size 2025

4.4 Market outlook: Forecast for 2025-2030

Chart on Global - Market size and forecast 2025-2030 ($ million)
Data Table on Global - Market size and forecast 2025-2030 ($ million)
Chart on Global Market: Year-over-year growth 2025-2030 (%)
Data Table on Global Market: Year-over-year growth 2025-2030 (%)

5. Historic Market Size

5.1 Global Gas Masks Market 2020 - 2024

Historic Market Size - Data Table on Global Gas Masks Market 2020 - 2024 ($ million)

5.2 Application segment analysis 2020 - 2024

Historic Market Size - Application Segment 2020 - 2024 ($ million)

5.3 Type segment analysis 2020 - 2024

Historic Market Size - Type Segment 2020 - 2024 ($ million)

5.4 Product Type segment analysis 2020 - 2024

Historic Market Size - Product Type Segment 2020 - 2024 ($ million)

5.5 Geography segment analysis 2020 - 2024

Historic Market Size - Geography Segment 2020 - 2024 ($ million)

5.6 Country segment analysis 2020 - 2024

Historic Market Size - Country Segment 2020 - 2024 ($ million)

6. Qualitative Analysis

6.1 Impact of AI on global gas masks market

6.2 Impact of geopolitical conflicts on global gas masks market

7. Five Forces Analysis

7.1 Five forces summary

Five forces analysis - Comparison between 2025 and 2030

7.2 Bargaining power of buyers

Bargaining power of buyers - Impact of key factors 2025 and 2030

7.3 Bargaining power of suppliers

Bargaining power of suppliers - Impact of key factors in 2025 and 2030

7.4 Threat of new entrants

Threat of new entrants - Impact of key factors in 2025 and 2030

7.5 Threat of substitutes

Threat of substitutes - Impact of key factors in 2025 and 2030

7.6 Threat of rivalry

Threat of rivalry - Impact of key factors in 2025 and 2030

7.7 Market condition

Chart on Market condition - Five forces 2025 and 2030

8. Market Segmentation by Application

8.1 Market segments

Chart on Application - Market share 2025-2030 (%)
Data Table on Application - Market share 2025-2030 (%)

8.2 Comparison by Application

Chart on Comparison by Application
Data Table on Comparison by Application

8.3 Chemical industry - Market size and forecast 2025-2030

Chart on Chemical industry - Market size and forecast 2025-2030 ($ million)
Data Table on Chemical industry - Market size and forecast 2025-2030 ($ million)
Chart on Chemical industry - Year-over-year growth 2025-2030 (%)
Data Table on Chemical industry - Year-over-year growth 2025-2030 (%)

8.4 Oil and gas - Market size and forecast 2025-2030

Chart on Oil and gas - Market size and forecast 2025-2030 ($ million)
Data Table on Oil and gas - Market size and forecast 2025-2030 ($ million)
Chart on Oil and gas - Year-over-year growth 2025-2030 (%)
Data Table on Oil and gas - Year-over-year growth 2025-2030 (%)

8.5 Mining industry - Market size and forecast 2025-2030

Chart on Mining industry - Market size and forecast 2025-2030 ($ million)
Data Table on Mining industry - Market size and forecast 2025-2030 ($ million)
Chart on Mining industry - Year-over-year growth 2025-2030 (%)
Data Table on Mining industry - Year-over-year growth 2025-2030 (%)

8.6 Healthcare - Market size and forecast 2025-2030

Chart on Healthcare - Market size and forecast 2025-2030 ($ million)
Data Table on Healthcare - Market size and forecast 2025-2030 ($ million)
Chart on Healthcare - Year-over-year growth 2025-2030 (%)
Data Table on Healthcare - Year-over-year growth 2025-2030 (%)

8.7 Others - Market size and forecast 2025-2030

Chart on Others - Market size and forecast 2025-2030 ($ million)
Data Table on Others - Market size and forecast 2025-2030 ($ million)
Chart on Others - Year-over-year growth 2025-2030 (%)
Data Table on Others - Year-over-year growth 2025-2030 (%)

8.8 Market opportunity by Application

Market opportunity by Application ($ million)
Data Table on Market opportunity by Application ($ million)

9. Market Segmentation by Type

9.1 Market segments

Chart on Type - Market share 2025-2030 (%)
Data Table on Type - Market share 2025-2030 (%)

9.2 Comparison by Type

Chart on Comparison by Type
Data Table on Comparison by Type

9.3 Disposable respirators - Market size and forecast 2025-2030

Chart on Disposable respirators - Market size and forecast 2025-2030 ($ million)
Data Table on Disposable respirators - Market size and forecast 2025-2030 ($ million)
Chart on Disposable respirators - Year-over-year growth 2025-2030 (%)
Data Table on Disposable respirators - Year-over-year growth 2025-2030 (%)

9.4 Powered air purifying respirators - Market size and forecast 2025-2030

Chart on Powered air purifying respirators - Market size and forecast 2025-2030 ($ million)
Data Table on Powered air purifying respirators - Market size and forecast 2025-2030 ($ million)
Chart on Powered air purifying respirators - Year-over-year growth 2025-2030 (%)
Data Table on Powered air purifying respirators - Year-over-year growth 2025-2030 (%)

9.5 Supplied air respirators - Market size and forecast 2025-2030

Chart on Supplied air respirators - Market size and forecast 2025-2030 ($ million)
Data Table on Supplied air respirators - Market size and forecast 2025-2030 ($ million)
Chart on Supplied air respirators - Year-over-year growth 2025-2030 (%)
Data Table on Supplied air respirators - Year-over-year growth 2025-2030 (%)

9.6 Self contained breathing apparatus - Market size and forecast 2025-2030

Chart on Self contained breathing apparatus - Market size and forecast 2025-2030 ($ million)
Data Table on Self contained breathing apparatus - Market size and forecast 2025-2030 ($ million)
Chart on Self contained breathing apparatus - Year-over-year growth 2025-2030 (%)
Data Table on Self contained breathing apparatus - Year-over-year growth 2025-2030 (%)

9.7 Market opportunity by Type

Market opportunity by Type ($ million)
Data Table on Market opportunity by Type ($ million)

10. Market Segmentation by Product Type

10.1 Market segments

Chart on Product Type - Market share 2025-2030 (%)
Data Table on Product Type - Market share 2025-2030 (%)

10.2 Comparison by Product Type

Chart on Comparison by Product Type
Data Table on Comparison by Product Type

10.3 Full-facepiece gas masks - Market size and forecast 2025-2030

Chart on Full-facepiece gas masks - Market size and forecast 2025-2030 ($ million)
Data Table on Full-facepiece gas masks - Market size and forecast 2025-2030 ($ million)
Chart on Full-facepiece gas masks - Year-over-year growth 2025-2030 (%)
Data Table on Full-facepiece gas masks - Year-over-year growth 2025-2030 (%)

10.4 Half-facepiece gas masks - Market size and forecast 2025-2030

Chart on Half-facepiece gas masks - Market size and forecast 2025-2030 ($ million)
Data Table on Half-facepiece gas masks - Market size and forecast 2025-2030 ($ million)
Chart on Half-facepiece gas masks - Year-over-year growth 2025-2030 (%)
Data Table on Half-facepiece gas masks - Year-over-year growth 2025-2030 (%)

10.5 Market opportunity by Product Type

Market opportunity by Product Type ($ million)
Data Table on Market opportunity by Product Type ($ million)

11. Customer Landscape

11.1 Customer landscape overview

Analysis of price sensitivity, lifecycle, customer purchase basket, adoption rates, and purchase criteria

12. Geographic Landscape

12.1 Geographic segmentation

Chart on Market share by geography 2025-2030 (%)
Data Table on Market share by geography 2025-2030 (%)

12.2 Geographic comparison

Chart on Geographic comparison
Data Table on Geographic comparison

12.3 North America - Market size and forecast 2025-2030

Chart on North America - Market size and forecast 2025-2030 ($ million)
Data Table on North America - Market size and forecast 2025-2030 ($ million)
Chart on North America - Year-over-year growth 2025-2030 (%)
Data Table on North America - Year-over-year growth 2025-2030 (%)
Chart on Regional Comparison - North America
Data Table on Regional Comparison - North America

12.3.1 US - Market size and forecast 2025-2030

Chart on US - Market size and forecast 2025-2030 ($ million)
Data Table on US - Market size and forecast 2025-2030 ($ million)
Chart on US - Year-over-year growth 2025-2030 (%)
Data Table on US - Year-over-year growth 2025-2030 (%)

12.3.2 Canada - Market size and forecast 2025-2030

Chart on Canada - Market size and forecast 2025-2030 ($ million)
Data Table on Canada - Market size and forecast 2025-2030 ($ million)
Chart on Canada - Year-over-year growth 2025-2030 (%)
Data Table on Canada - Year-over-year growth 2025-2030 (%)

12.3.3 Mexico - Market size and forecast 2025-2030

Chart on Mexico - Market size and forecast 2025-2030 ($ million)
Data Table on Mexico - Market size and forecast 2025-2030 ($ million)
Chart on Mexico - Year-over-year growth 2025-2030 (%)
Data Table on Mexico - Year-over-year growth 2025-2030 (%)

12.4 APAC - Market size and forecast 2025-2030

Chart on APAC - Market size and forecast 2025-2030 ($ million)
Data Table on APAC - Market size and forecast 2025-2030 ($ million)
Chart on APAC - Year-over-year growth 2025-2030 (%)
Data Table on APAC - Year-over-year growth 2025-2030 (%)
Chart on Regional Comparison - APAC
Data Table on Regional Comparison - APAC

12.4.1 China - Market size and forecast 2025-2030

Chart on China - Market size and forecast 2025-2030 ($ million)
Data Table on China - Market size and forecast 2025-2030 ($ million)
Chart on China - Year-over-year growth 2025-2030 (%)
Data Table on China - Year-over-year growth 2025-2030 (%)

12.4.2 Japan - Market size and forecast 2025-2030

Chart on Japan - Market size and forecast 2025-2030 ($ million)
Data Table on Japan - Market size and forecast 2025-2030 ($ million)
Chart on Japan - Year-over-year growth 2025-2030 (%)
Data Table on Japan - Year-over-year growth 2025-2030 (%)

12.4.3 India - Market size and forecast 2025-2030

Chart on India - Market size and forecast 2025-2030 ($ million)
Data Table on India - Market size and forecast 2025-2030 ($ million)
Chart on India - Year-over-year growth 2025-2030 (%)
Data Table on India - Year-over-year growth 2025-2030 (%)

12.4.4 South Korea - Market size and forecast 2025-2030

Chart on South Korea - Market size and forecast 2025-2030 ($ million)
Data Table on South Korea - Market size and forecast 2025-2030 ($ million)
Chart on South Korea - Year-over-year growth 2025-2030 (%)
Data Table on South Korea - Year-over-year growth 2025-2030 (%)

12.4.5 Australia - Market size and forecast 2025-2030

Chart on Australia - Market size and forecast 2025-2030 ($ million)
Data Table on Australia - Market size and forecast 2025-2030 ($ million)
Chart on Australia - Year-over-year growth 2025-2030 (%)
Data Table on Australia - Year-over-year growth 2025-2030 (%)

12.4.6 Indonesia - Market size and forecast 2025-2030

Chart on Indonesia - Market size and forecast 2025-2030 ($ million)
Data Table on Indonesia - Market size and forecast 2025-2030 ($ million)
Chart on Indonesia - Year-over-year growth 2025-2030 (%)
Data Table on Indonesia - Year-over-year growth 2025-2030 (%)

12.5 Europe - Market size and forecast 2025-2030

Chart on Europe - Market size and forecast 2025-2030 ($ million)
Data Table on Europe - Market size and forecast 2025-2030 ($ million)
Chart on Europe - Year-over-year growth 2025-2030 (%)
Data Table on Europe - Year-over-year growth 2025-2030 (%)
Chart on Regional Comparison - Europe
Data Table on Regional Comparison - Europe

12.5.1 Germany - Market size and forecast 2025-2030

Chart on Germany - Market size and forecast 2025-2030 ($ million)
Data Table on Germany - Market size and forecast 2025-2030 ($ million)
Chart on Germany - Year-over-year growth 2025-2030 (%)
Data Table on Germany - Year-over-year growth 2025-2030 (%)

12.5.2 UK - Market size and forecast 2025-2030

Chart on UK - Market size and forecast 2025-2030 ($ million)
Data Table on UK - Market size and forecast 2025-2030 ($ million)
Chart on UK - Year-over-year growth 2025-2030 (%)
Data Table on UK - Year-over-year growth 2025-2030 (%)

12.5.3 France - Market size and forecast 2025-2030

Chart on France - Market size and forecast 2025-2030 ($ million)
Data Table on France - Market size and forecast 2025-2030 ($ million)
Chart on France - Year-over-year growth 2025-2030 (%)
Data Table on France - Year-over-year growth 2025-2030 (%)

12.5.4 Italy - Market size and forecast 2025-2030

Chart on Italy - Market size and forecast 2025-2030 ($ million)
Data Table on Italy - Market size and forecast 2025-2030 ($ million)
Chart on Italy - Year-over-year growth 2025-2030 (%)
Data Table on Italy - Year-over-year growth 2025-2030 (%)

12.5.5 Spain - Market size and forecast 2025-2030

Chart on Spain - Market size and forecast 2025-2030 ($ million)
Data Table on Spain - Market size and forecast 2025-2030 ($ million)
Chart on Spain - Year-over-year growth 2025-2030 (%)
Data Table on Spain - Year-over-year growth 2025-2030 (%)

12.5.6 The Netherlands - Market size and forecast 2025-2030

Chart on The Netherlands - Market size and forecast 2025-2030 ($ million)
Data Table on The Netherlands - Market size and forecast 2025-2030 ($ million)
Chart on The Netherlands - Year-over-year growth 2025-2030 (%)
Data Table on The Netherlands - Year-over-year growth 2025-2030 (%)

12.6 South America - Market size and forecast 2025-2030

Chart on South America - Market size and forecast 2025-2030 ($ million)
Data Table on South America - Market size and forecast 2025-2030 ($ million)
Chart on South America - Year-over-year growth 2025-2030 (%)
Data Table on South America - Year-over-year growth 2025-2030 (%)
Chart on Regional Comparison - South America
Data Table on Regional Comparison - South America

12.6.1 Brazil - Market size and forecast 2025-2030

Chart on Brazil - Market size and forecast 2025-2030 ($ million)
Data Table on Brazil - Market size and forecast 2025-2030 ($ million)
Chart on Brazil - Year-over-year growth 2025-2030 (%)
Data Table on Brazil - Year-over-year growth 2025-2030 (%)

12.6.2 Argentina - Market size and forecast 2025-2030

Chart on Argentina - Market size and forecast 2025-2030 ($ million)
Data Table on Argentina - Market size and forecast 2025-2030 ($ million)
Chart on Argentina - Year-over-year growth 2025-2030 (%)
Data Table on Argentina - Year-over-year growth 2025-2030 (%)

12.6.3 Chile - Market size and forecast 2025-2030

Chart on Chile - Market size and forecast 2025-2030 ($ million)
Data Table on Chile - Market size and forecast 2025-2030 ($ million)
Chart on Chile - Year-over-year growth 2025-2030 (%)
Data Table on Chile - Year-over-year growth 2025-2030 (%)

12.7 Middle East and Africa - Market size and forecast 2025-2030

Chart on Middle East and Africa - Market size and forecast 2025-2030 ($ million)
Data Table on Middle East and Africa - Market size and forecast 2025-2030 ($ million)
Chart on Middle East and Africa - Year-over-year growth 2025-2030 (%)
Data Table on Middle East and Africa - Year-over-year growth 2025-2030 (%)
Chart on Regional Comparison - Middle East and Africa
Data Table on Regional Comparison - Middle East and Africa

12.7.1 Saudi Arabia - Market size and forecast 2025-2030

Chart on Saudi Arabia - Market size and forecast 2025-2030 ($ million)
Data Table on Saudi Arabia - Market size and forecast 2025-2030 ($ million)
Chart on Saudi Arabia - Year-over-year growth 2025-2030 (%)
Data Table on Saudi Arabia - Year-over-year growth 2025-2030 (%)

12.7.2 UAE - Market size and forecast 2025-2030

Chart on UAE - Market size and forecast 2025-2030 ($ million)
Data Table on UAE - Market size and forecast 2025-2030 ($ million)
Chart on UAE - Year-over-year growth 2025-2030 (%)
Data Table on UAE - Year-over-year growth 2025-2030 (%)

12.7.3 South Africa - Market size and forecast 2025-2030

Chart on South Africa - Market size and forecast 2025-2030 ($ million)
Data Table on South Africa - Market size and forecast 2025-2030 ($ million)
Chart on South Africa - Year-over-year growth 2025-2030 (%)
Data Table on South Africa - Year-over-year growth 2025-2030 (%)

12.7.4 Israel - Market size and forecast 2025-2030

Chart on Israel - Market size and forecast 2025-2030 ($ million)
Data Table on Israel - Market size and forecast 2025-2030 ($ million)
Chart on Israel - Year-over-year growth 2025-2030 (%)
Data Table on Israel - Year-over-year growth 2025-2030 (%)

12.7.5 Turkey - Market size and forecast 2025-2030

Chart on Turkey - Market size and forecast 2025-2030 ($ million)
Data Table on Turkey - Market size and forecast 2025-2030 ($ million)
Chart on Turkey - Year-over-year growth 2025-2030 (%)
Data Table on Turkey - Year-over-year growth 2025-2030 (%)

12.8 Market opportunity by geography

Market opportunity by geography ($ million)
Data Tables on Market opportunity by geography ($ million)

13. Drivers, Challenges, and Opportunity

13.1 Market drivers

Stringent occupational safety mandates and heightened corporate responsibility
Escalating geopolitical instability and defense sector modernization
Accelerated industrialization in emerging economies and worsening air quality concerns

13.2 Market challenges

High cost of ownership and limited component lifespan
Stringent regulatory compliance and regional certification disparities
Deficiencies in user training and low adoption due to ergonomic limitations

13.3 Impact of drivers and challenges

Impact of drivers and challenges in 2025 and 2030

13.4 Market opportunities

Integration of advanced electronics and smart system capabilities
Emphasis on human factors engineering and user centric design
Advancements in filtration materials and multi-threat protection

14. Competitive Landscape

14.1 Overview

14.2

Overview on criticality of inputs and factors of differentiation

14.3 Landscape disruption

Overview on factors of disruption

14.4 Industry risks

Impact of key risks on business

15. Competitive Analysis

15.1 Companies profiled

Companies covered

15.2 Company ranking index

15.3 Market positioning of companies

Matrix on companies position and classification

15.4 3M Co.

3M Co. - Overview
3M Co. - Business segments
3M Co. - Key news
3M Co. - Key offerings
3M Co. - Segment focus
SWOT

15.5 AirBoss of America Corp.

AirBoss of America Corp. - Overview
AirBoss of America Corp. - Business segments
AirBoss of America Corp. - Key offerings
AirBoss of America Corp. - Segment focus
SWOT

15.6 Avon Polymer Products Ltd.

Avon Polymer Products Ltd. - Overview
Avon Polymer Products Ltd. - Product / Service
Avon Polymer Products Ltd. - Key offerings
SWOT

15.7 CleanSpace Technology Pty Ltd.

CleanSpace Technology Pty Ltd. - Overview
CleanSpace Technology Pty Ltd. - Product / Service
CleanSpace Technology Pty Ltd. - Key offerings
SWOT

15.8 Delta Plus Group SA

Delta Plus Group SA - Overview
Delta Plus Group SA - Product / Service
Delta Plus Group SA - Key offerings
SWOT

15.9 Dragerwerk AG and Co. KGaA

Dragerwerk AG and Co. KGaA - Overview
Dragerwerk AG and Co. KGaA - Business segments
Dragerwerk AG and Co. KGaA - Key offerings
Dragerwerk AG and Co. KGaA - Segment focus
SWOT

15.10 Gentex Corp.

Gentex Corp. - Overview
Gentex Corp. - Product / Service
Gentex Corp. - Key offerings
SWOT

15.11 Honeywell International Inc.

Honeywell International Inc. - Overview
Honeywell International Inc. - Business segments
Honeywell International Inc. - Key news
Honeywell International Inc. - Key offerings
Honeywell International Inc. - Segment focus
SWOT

15.12 ILC Dover LP

ILC Dover LP - Overview
ILC Dover LP - Product / Service
ILC Dover LP - Key offerings
SWOT

15.13 JSP Ltd.

JSP Ltd. - Overview
JSP Ltd. - Product / Service
JSP Ltd. - Key offerings
SWOT

15.14 Moldex Metric

Moldex Metric - Overview
Moldex Metric - Product / Service
Moldex Metric - Key offerings
SWOT

15.15 MSA Safety Inc.

MSA Safety Inc. - Overview
MSA Safety Inc. - Business segments
MSA Safety Inc. - Key offerings
MSA Safety Inc. - Segment focus
SWOT

15.16 SHIGEMATSU WORKS CO. LTD.

SHIGEMATSU WORKS CO. LTD. - Overview
SHIGEMATSU WORKS CO. LTD. - Product / Service
SHIGEMATSU WORKS CO. LTD. - Key offerings
SWOT

15.17 Sundstrom Safety AB

Sundstrom Safety AB - Overview
Sundstrom Safety AB - Product / Service
Sundstrom Safety AB - Key offerings
SWOT

15.18 Trelleborg AB

Trelleborg AB - Overview
Trelleborg AB - Business segments
Trelleborg AB - Key offerings
Trelleborg AB - Segment focus
SWOT

16. Appendix

16.1 Scope of the report

Market definition
Objectives
Notes and caveats

16.2 Inclusions and exclusions checklist

Inclusions checklist
Exclusions checklist

16.3 Currency conversion rates for US$

16.4 Research methodology

16.5 Data procurement

Information sources

16.6 Data validation

16.7 Validation techniques employed for market sizing

16.8 Data synthesis

16.9 360 degree market analysis

16.10 List of abbreviations

Research Methodology

Technavio presents a detailed picture of the market by way of study, synthesis, and summation of data from multiple sources. The analysts have presented the various facets of the market with a particular focus on identifying the key industry influencers. The data thus presented is comprehensive, reliable, and the result of extensive research, both primary and secondary.

INFORMATION SOURCES

Primary sources

  • Manufacturers and suppliers
  • Channel partners
  • Industry experts
  • Strategic decision makers

Secondary sources

  • Industry journals and periodicals
  • Government data
  • Financial reports of key industry players
  • Historical data
  • Press releases

DATA ANALYSIS

Data Synthesis

  • Collation of data
  • Estimation of key figures
  • Analysis of derived insights

Data Validation

  • Triangulation with data models
  • Reference against proprietary databases
  • Corroboration with industry experts

REPORT WRITING

Qualitative

  • Market drivers
  • Market challenges
  • Market trends
  • Five forces analysis

Quantitative

  • Market size and forecast
  • Market segmentation
  • Geographical insights
  • Competitive landscape

Interested in this report?

Get your sample now to see our research methodology and insights!

Download Now

Frequently Asked Questions

Gas Masks market growth will increase by USD 6755.0 million during 2026-2030.

The Gas Masks market is expected to grow at a CAGR of 10.9% during 2026-2030.

Gas Masks market is segmented by Application (Chemical industry, Oil and gas, Mining industry, Healthcare, Others) Type (Disposable respirators, Powered air purifying respirators, Supplied air respirators, Self contained breathing apparatus) Product type (Full-facepiece gas masks, Half-facepiece gas masks)

3M Co., AirBoss of America Corp., Avon Polymer Products Ltd., CleanSpace Technology Pty Ltd., Delta Plus Group SA, Dragerwerk AG and Co. KGaA, Duram Mask, Gentex Corp., GVS S.p.A., Honeywell International Inc., ILC Dover LP, JSP Ltd., Koken Ltd., Moldex Metric, MSA Safety Inc., RSG Safety BV, Shalon Chemical Industries, SHIGEMATSU WORKS CO. LTD., Sundstrom Safety AB, Trelleborg AB are a few of the key vendors in the Gas Masks market.

APAC will register the highest growth rate of 32.9% among the other regions. Therefore, the Gas Masks market in APAC is expected to garner significant business opportunities for the vendors during the forecast period.

US, Canada, Mexico, China, Japan, India, South Korea, Australia, Indonesia, Germany, UK, France, Italy, Spain, The Netherlands, Brazil, Argentina, Chile, Saudi Arabia, UAE, South Africa, Israel, Turkey

  • Stringent occupational safety mandates and heightened corporate responsibility is the driving factor this market.

The Gas Masks market vendors should focus on grabbing business opportunities from the Application segment as it accounted for the largest market share in the base year.
RIA - Research AI Assistant
Ask RIA