Gas Utilities Market Analysis Europe, North America, APAC, South America, Middle East and Africa - US, Germany, Russia, China, France - Size and Forecast 2024-2028

Gas Utilities Market Analysis Europe, North America, APAC, South America, Middle East and Africa - US, Germany, Russia, China, France - Size and Forecast 2024-2028

Published: Jul 2024 183 Pages SKU: IRTNTR70420

Market Overview at a Glance

$475.8 B
Market Opportunity
5.35%
CAGR
4.78
YoY growth 2023-2024(%)

Gas Utilities Market Size 2024-2028 

The gas utilities market size is forecast to increase by USD 475.8 billion at a CAGR of 5.35% between 2023 and 2028.

  • The market is experiencing significant growth, driven by the increasing global demand for natural gas and the development of gas supply and distribution infrastructure. Inorganic strategies, such as mergers and acquisitions, are a popular approach for market expansion among institutional sector players, including integrated energy firms and pipeline operators. A notable trend is the shift towards hydrogen production as a means of emissions reduction, with Project Centurion being a prime example. Volatility in oil and gas prices continues to impact the market, necessitating adaptability and resilience from industry players. To stay competitive, companies must navigate these challenges and leverage emerging opportunities to maintain their market position.

What will be the Size of the Gas Utilities Market During the Forecast Period?

Gas Utilities Market Size

 Request Free Sample

  • The market is a significant sector in the energy industry, providing essential energy services to residential users and commercial businesses. This market encompasses various applications, including power generation, industrial processes, and LNG imports. In recent years, the industry has witnessed several trends driven by the need for energy efficiency, sustainability, and geopolitical considerations. Methane, a primary component of natural gas, is a crucial focus in the market. While methane is a potent greenhouse gas, it is also a valuable energy resource. The shift towards Renewable Natural Gas (RNG) is gaining momentum as an alternative to traditional natural gas, offering reduced greenhouse gas emissions and increased sustainability.
  • Energy efficiency programs are essential for gas utilities to reduce their environmental footprint and improve overall efficiency. Residential and commercial users can benefit from these initiatives, which may include energy audits, rebates for energy-efficient appliances, and educational resources. Power plants are a significant consumer of gas in the utilities sector. Transitioning these plants to cleaner energy sources, such as RNG and hydrogen, is a key focus for reducing carbon emissions. Coal and oil, historically dominant energy sources, face increasing pressure to adapt or phase out due to their high carbon emissions and geopolitical dependence. Geopolitical tensions, conflicts, and national security concerns have highlighted the importance of energy independence and diversification. Methane, energy efficiency programs, RNG, renewable energy resources, and technology are key drivers of this transformation.

How is this market segmented and which is the largest segment?

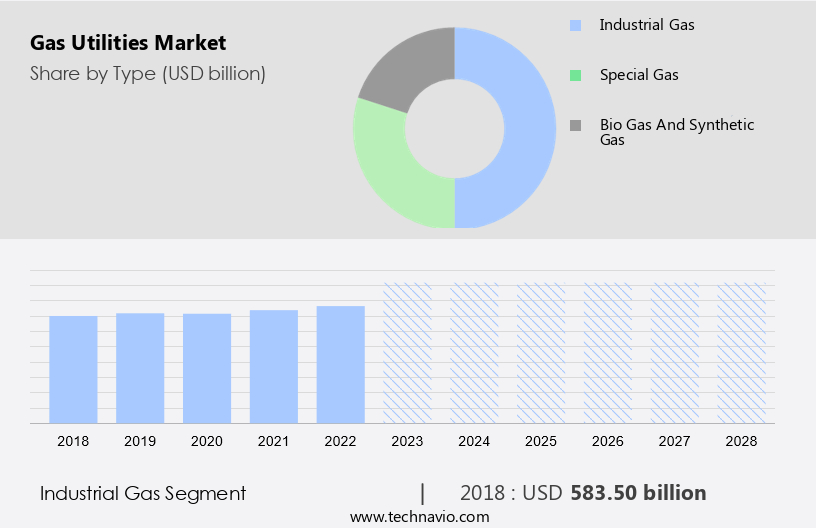
The market research report provides comprehensive data (region-wise segment analysis), with forecasts and estimates in "USD billion" for the period 2024-2028, as well as historical data from 2017-2022 for the following segments.

  • Type
    • Industrial gas
    • Special gas
    • Bio gas and synthetic gas
  • End-user
    • Residential and commercial
    • Power generation
    • Industrial
    • Others
  • Geography
    • Europe
      • Germany
      • France
    • North America
      • US
    • APAC
      • China
    • South America
    • Middle East and Africa

By Type Insights

  • The industrial gas segment is estimated to witness significant growth during the forecast period.

Industrial gases play a crucial role in powering various industries, with applications ranging from energy production to manufacturing processes. These gases can be categorized as fuel gases, inert gases, specialty gases, and medical gases based on their unique properties. Notable fuel gases include methane and renewable natural gas (RNG), which are increasingly gaining traction due to their potential to reduce greenhouse gas emissions. Industrial gas market offerings encompass a spectrum of products, including hydrogen, oxygen, nitrogen, argon, carbon dioxide, helium, and other rare gases. These gases are predominantly sold in bulk to industrial clients, who utilize them for diverse applications such as power generation, refrigeration, welding, and manufacturing processes.

Furthermore, the manufacturing sector is the primary driver of demand for Industrial gases, with extensive usage in industries like steel production, chemical manufacturing, and electronics manufacturing. As the US economy continues to grow, the demand for industrial gases is expected to follow suit, underpinned by the ongoing expansion of manufacturing industries. Energy efficiency programs and the adoption of renewable natural gas are emerging trends in the industrial gas market, as industries seek to minimize their carbon footprint and contribute to a more sustainable energy landscape. These trends are anticipated to shape the market dynamics and growth trajectory in the coming years.

Gas Utilities Market Size

Get a glance at the market report of share of various segments Request Free Sample

The industrial gas segment was valued at USD 583.50 billion in 2018 and showed a gradual increase during the forecast period.

Regional Analysis

  • Europe is estimated to contribute 42% to the growth of the global market during the forecast period.

Technavio's analysts have elaborately explained the regional trends and drivers that shape the market during the forecast period.

Gas Utilities Market Share by Geography

For more insights on the market share of various regions, Request Free Sample

The European market is experiencing significant growth due to the region's large population and increasing shift towards clean energy sources. With the phasing out of coal and nuclear power plants in Europe, natural gas is becoming an increasingly popular choice for power generation. For instance, Germany has announced plans to decommission all coal-fired power plants by 2038, while France aims to completely phase out coal-based power generation by the end of 2023. This transition presents a substantial opportunity for natural gas as a fuel source in power generation. Moreover, the advancement of technologies such as electrolysis and methanation is paving the way for the commercialization of MW-size projects in the gas utilities sector.

Industrial end-users are also showing a growing interest in these technologies for their energy needs. Hydrogenics, a leading company in hydrogen generation and energy solutions, is at the forefront of this trend, providing innovative solutions for the production and utilization of hydrogen and methane. As the European market continues to evolve, it is expected to witness continued growth and innovation in the coming years.

Market Dynamics

Our gas utilities market researchers analyzed the data with 2023 as the base year, along with the key drivers, trends, and challenges. A holistic analysis of drivers will help companies refine their marketing strategies to gain a competitive advantage.

What are the key market drivers leading to the rise in the adoption of the Gas Utilities Market?

Growth in global natural gas demand is the key driver of the market.

  • The market experiences continuous expansion due to the escalating demand for natural gas in the global energy sector. Natural gas is favored for its environmental advantages, such as reduced carbon emissions, and its cost-effective and dependable nature compared to other fossil fuels. Consequently, gas utility companies are investing substantially in technology and infrastructure to amplify their production and distribution capacities.
  • Moreover, governments are advocating for the utilization of natural gas as a clean energy source through incentives and regulatory measures. The increasing global energy demand is also influenced by extreme weather conditions, with some countries experiencing record-breaking winter and summer temperatures.

What are the market trends shaping the Gas Utilities Market?

The development of gas supply and distribution infrastructure is the upcoming trend in the market.

  • One significant trend in the international gas utilities sector is the expansion of gas infrastructure. This development is driven by various factors, including the rising demand for natural gas as a cleaner and more economical substitute for traditional fossil fuels like coal and oil. Additionally, the requirement for energy security and diversification, as well as government initiatives to decrease carbon emissions and encourage natural gas usage, are driving this trend. In numerous regions, particularly in developing economies, there is a pressing need to construct new gas pipelines and distribution networks to link newly discovered natural gas sources to consumers. Another crucial aspect of the market is the integration of renewable energy sources, energy efficiency, alternative fuels, green hydrogen production, carbon capture, and storage.
  • Renewable energy sources are becoming increasingly important as countries transition to cleaner energy sources. Energy efficiency is a key concern as the world strives to reduce its carbon footprint. Alternative fuels, such as biogas and shale gas, are gaining popularity due to their environmental benefits and affordability. Green hydrogen production, which uses renewable energy to generate hydrogen, is an emerging technology that could revolutionize the energy sector. Carbon capture, storage, and utilization are also essential components of the market as governments and companies seek to reduce greenhouse gas emissions. In conclusion, The market is witnessing significant growth due to the increasing demand for natural gas, the need for energy security and diversification, and government policies aimed at reducing carbon emissions.

What challenges does the Gas Utilities Market face during the growth?

Volatility in oil and gas prices is a key challenge affecting the market growth.

  • The market faces significant challenges due to the volatility in oil and gas prices. Price fluctuations can impact the demand for natural gas, as consumers may opt for alternative energy sources or reduce consumption during periods of high prices. This can negatively affect the revenue of gas utility companies and increase their operating costs as they adjust to changes in demand.
  • Moreover, the cost of producing and delivering natural gas can be influenced by oil and gas price movements. An increase in production costs due to higher oil and gas prices may necessitate passing on these costs to consumers, potentially decreasing demand further. Inorganic growth strategies, such as mergers and acquisitions, are being employed by institutional sector players, including integrated energy firms and pipeline operators, to mitigate these challenges and expand their market presence. Hydrogen production, as a potential solution to emissions reduction, is also gaining traction in the industry.

Exclusive Customer Landscape

The gas utilities market forecasting report includes the adoption lifecycle of the market, covering from the innovator's stage to the laggard's stage. It focuses on adoption rates in different regions based on penetration. Furthermore, the market report also includes key purchase criteria and drivers of price sensitivity to help companies evaluate and develop their market growth analysis strategies.
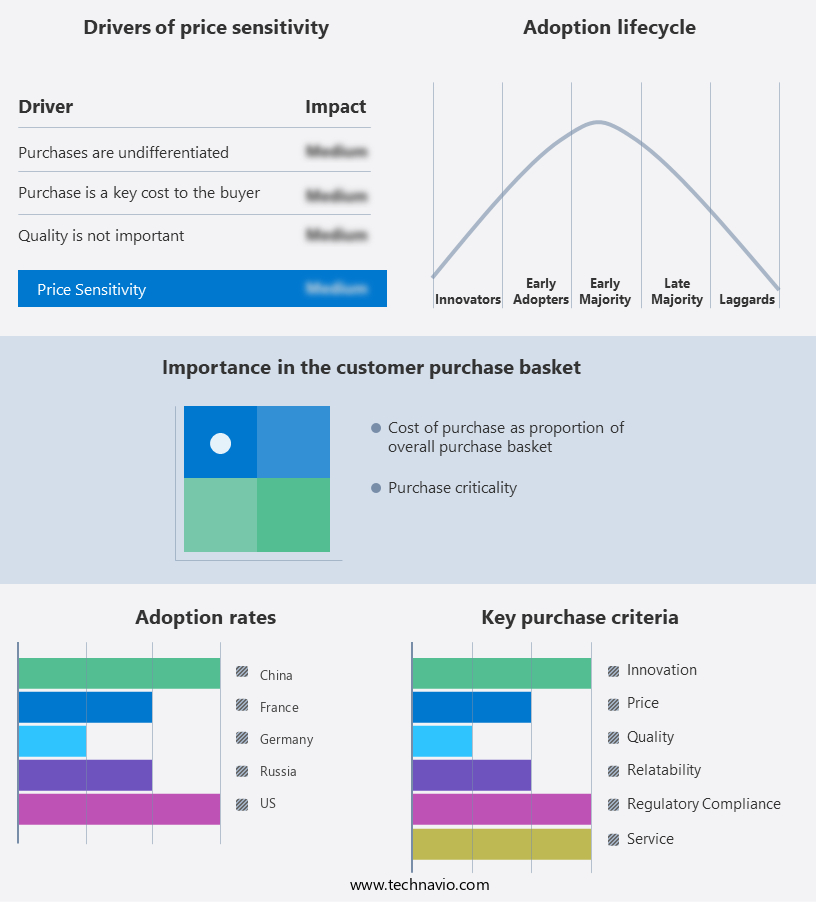
Gas Utilities Market Share by Geography

 Customer Landscape

Key Companies & Market Insights

Companies are implementing various strategies, such as strategic alliances, market forecast, partnerships, mergers and acquisitions, geographical expansion, and product/service launches, to enhance their presence in the market. The gas utilities market research and growth report includes detailed analyses of the competitive landscape of the market and information about key companies, including:

  • Atmos Energy Corp.
  • Bharat Petroleum Corp. Ltd.
  • China Gas Holdings Ltd.
  • China National Petroleum Corp.
  • CMS Energy Corp
  • Duke Energy Corp.
  • E.ON SE
  • Electricite de France SA
  • Enel Spa
  • ENGIE SA
  • ENN Energy Holdings Ltd.
  • Gazprom International Ltd.
  • Iberdrola SA
  • National Grid plc
  • Nextera Energy Inc.
  • Origin Energy Ltd.
  • PG and E Corp.
  • Southern Co.
  • The Hong Kong and China Gas Co. Ltd.
  • Tokyo Gas Co. Ltd

Qualitative and quantitative analysis of companies has been conducted to help clients understand the wider business environment as well as the strengths and weaknesses of key market players. Data is qualitatively analyzed to categorize companies as pure play, category-focused, industry-focused, and diversified; it is quantitatively analyzed to categorize companies as dominant, leading, strong, tentative, and weak.

Research Analyst Overview

The market is witnessing significant growth due to the increasing demand for cleaner energy sources and the shift towards renewable natural gas (RNG) and hydrogen as alternative fuels. Methane, a primary component of natural gas, is under scrutiny due to its contribution to greenhouse gas emissions. However, RNG produced from biomethane and landfills offers a sustainable solution with lower carbon emissions. Energy efficiency programs are a key focus area for residential users and commercial businesses, driving the adoption of gas utilities. Power plants are transitioning from coal and oil to gas, owing to its cleaner burn and lower carbon emissions.

Furthermore, LNG imports are also on the rise to meet the increasing demand for gas in power generation. Geopolitical dependence, political tensions, conflicts, and national security concerns are pushing utilities toward diversifying their energy sources. Renewable energy resources such as wind, solar, and hydro are being integrated into the grid, reducing the reliance on traditional fuels. Technological advancements in hydrogen production through electrolysis, methanation, and carbon capture and storage are paving the way for the commercialization of large-scale MW-size projects. Integrated energy firms and pipeline operators are investing in storage facilities to ensure energy security and stability. The institutional sector, including industrial end-users, is also adopting inorganic strategies to reduce carbon emissions through green hydrogen production.

Gas Utilities Market Scope

Report Coverage

Details

Page number

183

Base year

2023

Historic period

2017-2022

Forecast period

2024-2028

Growth momentum & CAGR

Accelerate at a CAGR of 5.35%

Market growth 2024-2028

USD 475.8 billion

Market structure

Fragmented

YoY growth 2023-2024(%)

4.78

Key countries

US, Germany, Russia, China, and France

Competitive landscape

Leading Companies, Market Positioning of Companies, Competitive Strategies, and Industry Risks

Request Free Sample

What are the Key Data Covered in this Market Research and Growth Report?

  • CAGR of the market during the forecast period
  • Detailed information on factors that will drive the market growth and forecasting between 2024 and 2028
  • Precise estimation of the size of the market  and its contribution of the market in focus to the parent market
  • Accurate predictions about upcoming market growth and trends and changes in consumer behaviour
  • Growth of the market across Europe, North America, APAC, South America, and Middle East and Africa
  • Thorough analysis of the market's competitive landscape and detailed information about companies
  • Comprehensive analysis of factors that will challenge the growth of market companies

We can help! Our analysts can customize this market research report to meet your requirements. Get in touch

1 Executive Summary

  • 1.1 Market overview
    • Executive Summary - Chart on Market Overview
    • Executive Summary - Data Table on Market Overview
    • Executive Summary - Chart on Global Market Characteristics
    • Executive Summary - Chart on Market by Geography
    • Executive Summary - Chart on Market Segmentation by Type
    • Executive Summary - Chart on Market Segmentation by End-user
    • Executive Summary - Chart on Incremental Growth
    • Executive Summary - Data Table on Incremental Growth
    • Executive Summary - Chart on Company Market Positioning

2 Market Landscape

  • 2.1 Market ecosystem
    • Parent Market
    • Data Table on - Parent Market
  • 2.2 Market characteristics
    • Market characteristics analysis
  • 2.3 Value chain analysis
    • Value Chain Analysis

3 Market Sizing

  • 3.1 Market definition
    • Offerings of companies included in the market definition
  • 3.2 Market segment analysis
    • Market segments
  • 3.3 Market size 2023
    • 3.4 Market outlook: Forecast for 2023-2028
      • Chart on Global - Market size and forecast 2023-2028 ($ billion)
      • Data Table on Global - Market size and forecast 2023-2028 ($ billion)
      • Chart on Global Market: Year-over-year growth 2023-2028 (%)
      • Data Table on Global Market: Year-over-year growth 2023-2028 (%)

    4 Historic Market Size

    • 4.1 Global Gas Utilities Market 2018 - 2022
      • Historic Market Size - Data Table on Global Gas Utilities Market 2018 - 2022 ($ billion)
    • 4.2 Type segment analysis 2018 - 2022
      • Historic Market Size - Type Segment 2018 - 2022 ($ billion)
    • 4.3 End-user segment analysis 2018 - 2022
      • Historic Market Size - End-user Segment 2018 - 2022 ($ billion)
    • 4.4 Geography segment analysis 2018 - 2022
      • Historic Market Size - Geography Segment 2018 - 2022 ($ billion)
    • 4.5 Country segment analysis 2018 - 2022
      • Historic Market Size - Country Segment 2018 - 2022 ($ billion)

    5 Five Forces Analysis

    • 5.1 Five forces summary
      • Five forces analysis - Comparison between 2023 and 2028
    • 5.2 Bargaining power of buyers
      • Bargaining power of buyers - Impact of key factors 2023 and 2028
    • 5.3 Bargaining power of suppliers
      • Bargaining power of suppliers - Impact of key factors in 2023 and 2028
    • 5.4 Threat of new entrants
      • Threat of new entrants - Impact of key factors in 2023 and 2028
    • 5.5 Threat of substitutes
      • Threat of substitutes - Impact of key factors in 2023 and 2028
    • 5.6 Threat of rivalry
      • Threat of rivalry - Impact of key factors in 2023 and 2028
    • 5.7 Market condition
      • Chart on Market condition - Five forces 2023 and 2028

    6 Market Segmentation by Type

    • 6.1 Market segments
      • Chart on Type - Market share 2023-2028 (%)
      • Data Table on Type - Market share 2023-2028 (%)
    • 6.2 Comparison by Type
      • Chart on Comparison by Type
      • Data Table on Comparison by Type
    • 6.3 Industrial gas - Market size and forecast 2023-2028
      • Chart on Industrial gas - Market size and forecast 2023-2028 ($ billion)
      • Data Table on Industrial gas - Market size and forecast 2023-2028 ($ billion)
      • Chart on Industrial gas - Year-over-year growth 2023-2028 (%)
      • Data Table on Industrial gas - Year-over-year growth 2023-2028 (%)
    • 6.4 Special gas - Market size and forecast 2023-2028
      • Chart on Special gas - Market size and forecast 2023-2028 ($ billion)
      • Data Table on Special gas - Market size and forecast 2023-2028 ($ billion)
      • Chart on Special gas - Year-over-year growth 2023-2028 (%)
      • Data Table on Special gas - Year-over-year growth 2023-2028 (%)
    • 6.5 Bio gas and synthetic gas - Market size and forecast 2023-2028
      • Chart on Bio gas and synthetic gas - Market size and forecast 2023-2028 ($ billion)
      • Data Table on Bio gas and synthetic gas - Market size and forecast 2023-2028 ($ billion)
      • Chart on Bio gas and synthetic gas - Year-over-year growth 2023-2028 (%)
      • Data Table on Bio gas and synthetic gas - Year-over-year growth 2023-2028 (%)
    • 6.6 Market opportunity by Type
      • Market opportunity by Type ($ billion)
      • Data Table on Market opportunity by Type ($ billion)

    7 Market Segmentation by End-user

    • 7.1 Market segments
      • Chart on End-user - Market share 2023-2028 (%)
      • Data Table on End-user - Market share 2023-2028 (%)
    • 7.2 Comparison by End-user
      • Chart on Comparison by End-user
      • Data Table on Comparison by End-user
    • 7.3 Residential and commercial - Market size and forecast 2023-2028
      • Chart on Residential and commercial - Market size and forecast 2023-2028 ($ billion)
      • Data Table on Residential and commercial - Market size and forecast 2023-2028 ($ billion)
      • Chart on Residential and commercial - Year-over-year growth 2023-2028 (%)
      • Data Table on Residential and commercial - Year-over-year growth 2023-2028 (%)
    • 7.4 Power generation - Market size and forecast 2023-2028
      • Chart on Power generation - Market size and forecast 2023-2028 ($ billion)
      • Data Table on Power generation - Market size and forecast 2023-2028 ($ billion)
      • Chart on Power generation - Year-over-year growth 2023-2028 (%)
      • Data Table on Power generation - Year-over-year growth 2023-2028 (%)
    • 7.5 Industrial - Market size and forecast 2023-2028
      • Chart on Industrial - Market size and forecast 2023-2028 ($ billion)
      • Data Table on Industrial - Market size and forecast 2023-2028 ($ billion)
      • Chart on Industrial - Year-over-year growth 2023-2028 (%)
      • Data Table on Industrial - Year-over-year growth 2023-2028 (%)
    • 7.6 Others - Market size and forecast 2023-2028
      • Chart on Others - Market size and forecast 2023-2028 ($ billion)
      • Data Table on Others - Market size and forecast 2023-2028 ($ billion)
      • Chart on Others - Year-over-year growth 2023-2028 (%)
      • Data Table on Others - Year-over-year growth 2023-2028 (%)
    • 7.7 Market opportunity by End-user
      • Market opportunity by End-user ($ billion)
      • Data Table on Market opportunity by End-user ($ billion)

    8 Customer Landscape

    • 8.1 Customer landscape overview
      • Analysis of price sensitivity, lifecycle, customer purchase basket, adoption rates, and purchase criteria

    9 Geographic Landscape

    • 9.1 Geographic segmentation
      • Chart on Market share by geography 2023-2028 (%)
      • Data Table on Market share by geography 2023-2028 (%)
    • 9.2 Geographic comparison
      • Chart on Geographic comparison
      • Data Table on Geographic comparison
    • 9.3 Europe - Market size and forecast 2023-2028
      • Chart on Europe - Market size and forecast 2023-2028 ($ billion)
      • Data Table on Europe - Market size and forecast 2023-2028 ($ billion)
      • Chart on Europe - Year-over-year growth 2023-2028 (%)
      • Data Table on Europe - Year-over-year growth 2023-2028 (%)
    • 9.4 North America - Market size and forecast 2023-2028
      • Chart on North America - Market size and forecast 2023-2028 ($ billion)
      • Data Table on North America - Market size and forecast 2023-2028 ($ billion)
      • Chart on North America - Year-over-year growth 2023-2028 (%)
      • Data Table on North America - Year-over-year growth 2023-2028 (%)
    • 9.5 APAC - Market size and forecast 2023-2028
      • Chart on APAC - Market size and forecast 2023-2028 ($ billion)
      • Data Table on APAC - Market size and forecast 2023-2028 ($ billion)
      • Chart on APAC - Year-over-year growth 2023-2028 (%)
      • Data Table on APAC - Year-over-year growth 2023-2028 (%)
    • 9.6 South America - Market size and forecast 2023-2028
      • Chart on South America - Market size and forecast 2023-2028 ($ billion)
      • Data Table on South America - Market size and forecast 2023-2028 ($ billion)
      • Chart on South America - Year-over-year growth 2023-2028 (%)
      • Data Table on South America - Year-over-year growth 2023-2028 (%)
    • 9.7 Middle East and Africa - Market size and forecast 2023-2028
      • Chart on Middle East and Africa - Market size and forecast 2023-2028 ($ billion)
      • Data Table on Middle East and Africa - Market size and forecast 2023-2028 ($ billion)
      • Chart on Middle East and Africa - Year-over-year growth 2023-2028 (%)
      • Data Table on Middle East and Africa - Year-over-year growth 2023-2028 (%)
    • 9.8 US - Market size and forecast 2023-2028
      • Chart on US - Market size and forecast 2023-2028 ($ billion)
      • Data Table on US - Market size and forecast 2023-2028 ($ billion)
      • Chart on US - Year-over-year growth 2023-2028 (%)
      • Data Table on US - Year-over-year growth 2023-2028 (%)
    • 9.9 Germany - Market size and forecast 2023-2028
      • Chart on Germany - Market size and forecast 2023-2028 ($ billion)
      • Data Table on Germany - Market size and forecast 2023-2028 ($ billion)
      • Chart on Germany - Year-over-year growth 2023-2028 (%)
      • Data Table on Germany - Year-over-year growth 2023-2028 (%)
    • 9.10 China - Market size and forecast 2023-2028
      • Chart on China - Market size and forecast 2023-2028 ($ billion)
      • Data Table on China - Market size and forecast 2023-2028 ($ billion)
      • Chart on China - Year-over-year growth 2023-2028 (%)
      • Data Table on China - Year-over-year growth 2023-2028 (%)
    • 9.11 Russia - Market size and forecast 2023-2028
      • Chart on Russia - Market size and forecast 2023-2028 ($ billion)
      • Data Table on Russia - Market size and forecast 2023-2028 ($ billion)
      • Chart on Russia - Year-over-year growth 2023-2028 (%)
      • Data Table on Russia - Year-over-year growth 2023-2028 (%)
    • 9.12 France - Market size and forecast 2023-2028
      • Chart on France - Market size and forecast 2023-2028 ($ billion)
      • Data Table on France - Market size and forecast 2023-2028 ($ billion)
      • Chart on France - Year-over-year growth 2023-2028 (%)
      • Data Table on France - Year-over-year growth 2023-2028 (%)
    • 9.13 Market opportunity by geography
      • Market opportunity by geography ($ billion)
      • Data Tables on Market opportunity by geography ($ billion)

    10 Drivers, Challenges, and Opportunity/Restraints

    • 10.1 Market drivers
      • 10.2 Market challenges
        • 10.3 Impact of drivers and challenges
          • Impact of drivers and challenges in 2023 and 2028
        • 10.4 Market opportunities/restraints

          11 Competitive Landscape

          • 11.1 Overview
            • 11.2 Competitive Landscape
              • Overview on criticality of inputs and factors of differentiation
            • 11.3 Landscape disruption
              • Overview on factors of disruption
            • 11.4 Industry risks
              • Impact of key risks on business

            12 Competitive Analysis

            • 12.1 Companies profiled
              • Companies covered
            • 12.2 Market positioning of companies
              • Matrix on companies position and classification
            • 12.3 Atmos Energy Corp.
              • Atmos Energy Corp. - Overview
              • Atmos Energy Corp. - Business segments
              • Atmos Energy Corp. - Key offerings
              • Atmos Energy Corp. - Segment focus
            • 12.4 Bharat Petroleum Corp. Ltd.
              • Bharat Petroleum Corp. Ltd. - Overview
              • Bharat Petroleum Corp. Ltd. - Product / Service
              • Bharat Petroleum Corp. Ltd. - Key offerings
            • 12.5 China Gas Holdings Ltd.
              • China Gas Holdings Ltd. - Overview
              • China Gas Holdings Ltd. - Product / Service
              • China Gas Holdings Ltd. - Key offerings
            • 12.6 China National Petroleum Corp.
              • China National Petroleum Corp. - Overview
              • China National Petroleum Corp. - Product / Service
              • China National Petroleum Corp. - Key offerings
            • 12.7 CMS Energy Corp
              • CMS Energy Corp - Overview
              • CMS Energy Corp - Business segments
              • CMS Energy Corp - Key offerings
              • CMS Energy Corp - Segment focus
            • 12.8 Duke Energy Corp.
              • Duke Energy Corp. - Overview
              • Duke Energy Corp. - Business segments
              • Duke Energy Corp. - Key offerings
              • Duke Energy Corp. - Segment focus
            • 12.9 E.ON SE
              • E.ON SE - Overview
              • E.ON SE - Business segments
              • E.ON SE - Key offerings
              • E.ON SE - Segment focus
            • 12.10 Electricite de France SA
              • Electricite de France SA - Overview
              • Electricite de France SA - Business segments
              • Electricite de France SA - Key offerings
              • Electricite de France SA - Segment focus
            • 12.11 Enel Spa
              • Enel Spa - Overview
              • Enel Spa - Product / Service
              • Enel Spa - Key news
              • Enel Spa - Key offerings
            • 12.12 ENGIE SA
              • ENGIE SA - Overview
              • ENGIE SA - Business segments
              • ENGIE SA - Key news
              • ENGIE SA - Key offerings
              • ENGIE SA - Segment focus
            • 12.13 Gazprom International Ltd.
              • Gazprom International Ltd. - Overview
              • Gazprom International Ltd. - Product / Service
              • Gazprom International Ltd. - Key offerings
            • 12.14 Iberdrola SA
              • Iberdrola SA - Overview
              • Iberdrola SA - Business segments
              • Iberdrola SA - Key offerings
              • Iberdrola SA - Segment focus
            • 12.15 National Grid plc
              • National Grid plc - Overview
              • National Grid plc - Business segments
              • National Grid plc - Key offerings
              • National Grid plc - Segment focus
            • 12.16 Nextera Energy Inc.
              • Nextera Energy Inc. - Overview
              • Nextera Energy Inc. - Business segments
              • Nextera Energy Inc. - Key offerings
              • Nextera Energy Inc. - Segment focus
            • 12.17 Southern Co.
              • Southern Co. - Overview
              • Southern Co. - Business segments
              • Southern Co. - Key offerings
              • Southern Co. - Segment focus

            13 Appendix

            • 13.1 Scope of the report
              • 13.2 Inclusions and exclusions checklist
                • Inclusions checklist
                • Exclusions checklist
              • 13.3 Currency conversion rates for US$
                • Currency conversion rates for US$
              • 13.4 Research methodology
                • Research methodology
              • 13.5 Data procurement
                • Information sources
              • 13.6 Data validation
                • Data validation
              • 13.7 Validation techniques employed for market sizing
                • Validation techniques employed for market sizing
              • 13.8 Data synthesis
                • Data synthesis
              • 13.9 360 degree market analysis
                • 360 degree market analysis
              • 13.10 List of abbreviations
                • List of abbreviations

              Research Methodology

              Technavio presents a detailed picture of the market by way of study, synthesis, and summation of data from multiple sources. The analysts have presented the various facets of the market with a particular focus on identifying the key industry influencers. The data thus presented is comprehensive, reliable, and the result of extensive research, both primary and secondary.

              INFORMATION SOURCES

              Primary sources

              • Manufacturers and suppliers
              • Channel partners
              • Industry experts
              • Strategic decision makers

              Secondary sources

              • Industry journals and periodicals
              • Government data
              • Financial reports of key industry players
              • Historical data
              • Press releases

              DATA ANALYSIS

              Data Synthesis

              • Collation of data
              • Estimation of key figures
              • Analysis of derived insights

              Data Validation

              • Triangulation with data models
              • Reference against proprietary databases
              • Corroboration with industry experts

              REPORT WRITING

              Qualitative

              • Market drivers
              • Market challenges
              • Market trends
              • Five forces analysis

              Quantitative

              • Market size and forecast
              • Market segmentation
              • Geographical insights
              • Competitive landscape

              Interested in this report?

              Get your sample now to see our research methodology and insights!

              Download Now

              Frequently Asked Questions

              Gas Utilities market growth will increase by $ 475.8 bn during 2024-2028.

              The Gas Utilities market is expected to grow at a CAGR of 5.35% during 2024-2028.

              Gas Utilities market is segmented by Type( Industrial gas, Special gas, Bio gas and synthetic gas, Others) End-user( Residential and commercial, Power generation, Industrial, Others, MEA)

              Atmos Energy Corp., Bharat Petroleum Corp. Ltd., China Gas Holdings Ltd., China National Petroleum Corp., CMS Energy Corp, Duke Energy Corp., E.ON SE, Electricite de France SA, Enel Spa, ENGIE SA, ENN Energy Holdings Ltd., Gazprom International Ltd., Iberdrola SA, National Grid plc, Nextera Energy Inc., Origin Energy Ltd., PG and E Corp., Southern Co., The Hong Kong and China Gas Co. Ltd., Tokyo Gas Co. Ltd are a few of the key vendors in the Gas Utilities market.

              Europe will register the highest growth rate of 42% among the other regions. Therefore, the Gas Utilities market in Europe is expected to garner significant business opportunities for the vendors during the forecast period.

              US, Germany, Russia, China, France

              • Growth in global natural gas demandThe growth in global demand for natural gas is considered a major driver of the global gas utilities market. The demand for natural gas has been increasing due to its various benefits is the driving factor this market.
              • such as lower carbon emissions is the driving factor this market.
              • cost-effectiveness is the driving factor this market.
              • and reliability compared with other fossil fuels. As a result is the driving factor this market.
              • gas utilities companies are investing in infrastructure and technology to increase their production and distribution capabilities. Additionally is the driving factor this market.
              • governments are promoting the use of natural gas as a clean fuel by providing incentives and implementing regulations that encourage the adoption of natural gas. The global weather conditions also account for the rise in global energy demand as the average winter and summer temperatures in some countries approached and/or exceeded historical records. Cold weather conditions boost the demand for heating is the driving factor this market.
              • whereas hotter summer temperatures increase the demand for cooling. According to the IEA is the driving factor this market.
              • the industrial sector is expected to account for almost half of the increase in natural gas consumption globally is the driving factor this market.
              • owing to the need for energy in industrial processes and a feedstock for chemicals. The increasing demand for natural gas as a feedstock for the production of chemicals and fertilizers is also driving the growth of the gas utilities market. The growth in the chemical and fertilizer industries is expected to increase the demand for natural gas is the driving factor this market.
              • which will thereby fuel the growth of the global gas utilities market during the forecast period. is the driving factor this market.

              The Gas Utilities market vendors should focus on grabbing business opportunities from the Industrial gas segment as it accounted for the largest market share in the base year.
              RIA - Research AI Assistant
              Ask RIA