
Gel Documentation Systems Market Size 2024-2028
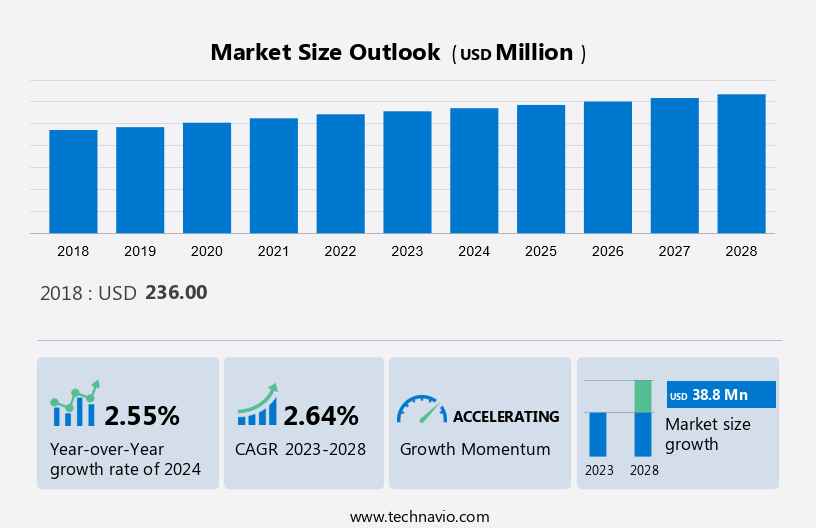
The gel documentation systems market size is forecast to increase by USD 38.8 million, at a CAGR of 2.64% between 2023 and 2028. The market's expansion hinges on several key factors, including the heightened adoption of molecular biology techniques in clinical settings, the boost in automation within the healthcare sector, and the continual growth of healthcare spending. The integration of molecular biology methods into clinical practice has enhanced diagnostic accuracy and treatment efficacy, driving market demand. Additionally, automation in healthcare operations streamlines processes reduces errors, and improves patient care outcomes. The upward trajectory of healthcare expenditure further propels market growth, enabling investment in advanced technologies and innovative healthcare solutions. These factors collectively contribute to the market's evolution and the delivery of enhanced healthcare services to meet the rising demands of patients and healthcare providers alike
What will be the size of the Market During the Forecast Period?
To learn more about this report, Report Sample PDF
Market Segmentation
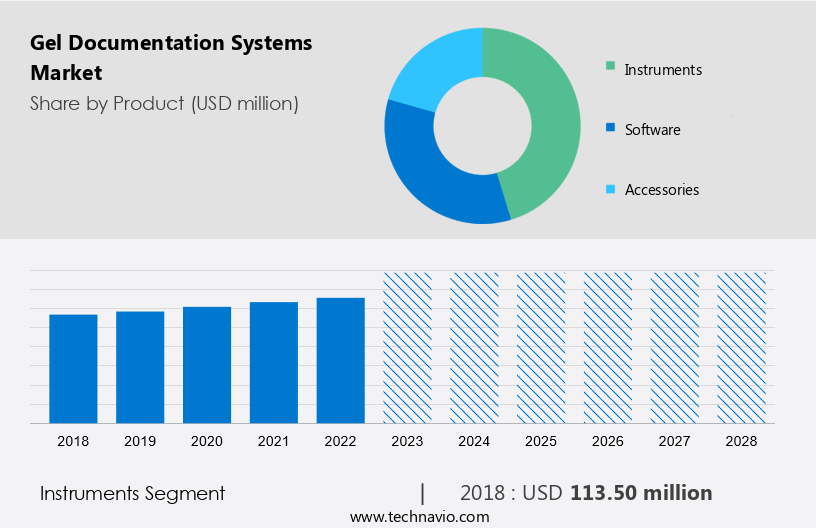
By Product
The market share growth by the instruments segment will be significant during the forecast period. Gel documentation systems or instruments serve as enclosed darkrooms to block external light from entering the inside. These instruments are used to image gels, tissues, arrays, and more.
Get a glance at the market contribution of various segments Request Report Sample PDF
The instruments segment showed a gradual increase in the market share of USD 113.5 million in 2018. Gel documentation systems or instruments are used for the detection, quantitation, and analysis of proteins and nucleic acids in gels and on membranes. Their increasing application in hospitals and diagnostic centers for various research procedures will drive the growth of the segment and, in turn, the market in focus during the forecast period.
By Region
For more insights on the market share of various regions Request Report Sample PDF
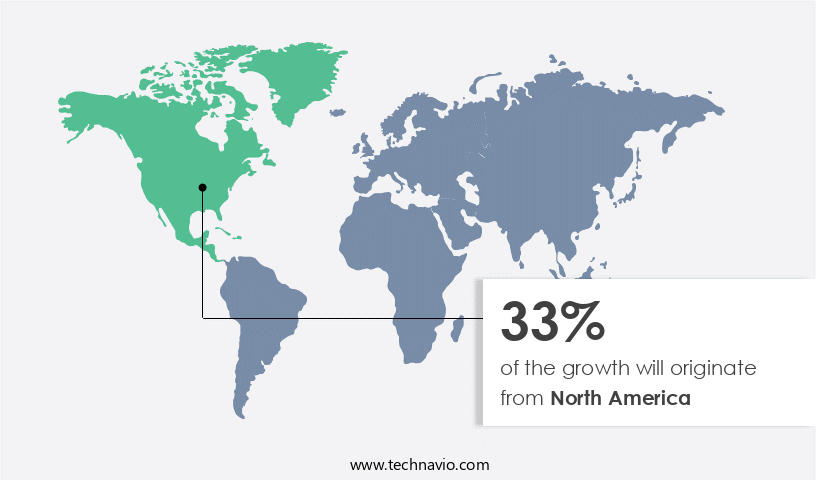
North America is estimated to contribute 33% to the growth of the global market during the forecast period. Technavio's analysts have elaborately explained the regional trends and drivers that shape the market during the forecast period. The molecular diagnostics market is growing at a steady rate in North America. The molecular diagnostics space in the region is generating huge interest from corporate giants, as these companies can expand their presence in the healthcare market through acquisitions or explore newer avenues for revenue generation.
Additionally, the large number of genetic tests that are available for a range of conditions and the high rate at which newer genetic tests are being developed in this region indicates that the market will continue to grow during the forecast period as most of these tests where DNA or protein analysis is required, a gel documentation system will be used.
Market Dynamics and Customer Landscape
The market is fueled by the increasing demand for imaging and recording of biological samples in various fields such as diagnostic laboratories, pharmaceutical corporations, and biotechnology corporations. These systems facilitate the visualization of nucleic acids and proteins separated on polyacrylamide and agarose gels, utilizing dyes like ethidium bromide and fluorophores such as SYBR Green. Advancements in computer vision techniques enable precise protein quantification and analysis. With the rise in research activities involving microscopy and cellular analysis, the demand for gel imaging and documentation systems, including those compatible with digital systems, continues to grow.
Key Market Driver
Increasing healthcare expenditure is notably driving market growth. The rising prevalence of infectious diseases and the growing disposable income of consumers have increased the spending on healthcare across the world. Besides, the growing awareness of the need for the early management of infectious and chronic diseases among people has made them look for timely medical help.
Moreover, the expenditure on healthcare is generally higher in developed countries. Emerging markets, such as China, India, and Brazil, are also witnessing a favorable increase in healthcare spending due to the rising disposable income of the people. Healthcare expenditure in China is expected to grow at an average of 8.4 % annually and reach USD 2,297.3 billion by 2035, from around USD 508.9 billion in 2014. In the US, the FY 2022 budget proposed USD 131.8 billion in discretionary budget authority and USD 1.5 trillion in mandatory funding. Such an increase in healthcare expenditure is expected to drive the market during the forecast period.
Significant Market Trends
Increasing patient awareness on the importance of early diagnosis is an emerging trend in the market. Many organizations across the world are developing initiatives to highlight the importance of early diagnosis along with key measures for a patient to opt for a successful diagnosis. For instance, the National Awareness and Early Diagnosis Initiative (NAEDI), led by Cancer Research UK and the Department of Health aims to provide local interventions to increase public awareness of the signs and symptoms of cancer and encourage patients to seek medical help early.
Moreover, such initiatives are encouraging many patients to undergo early diagnosis of diseases, which is pivotal for planning treatment and for the development of personalized medicine. All these factors are expected to have a positive impact on the growth of the global gel documentation systems market during the forecast period.
Major Market Challenge
The high cost of instruments is a major challenge impeding market growth. Gel documentation systems are expensive to procure and maintain. On average, the price of a gel documentation systems device ranges from USD 1000 - USD 4,000. For a standard gel documentation system, the cost of maintenance, service, and repair increases the total cost of ownership, making gel documentation system devices more expensive during their lifetime.
Moreover, the maintenance costs of these devices are high, as these devices experience changes in temperature and undergo mechanical stress. Regular maintenance of the instruments is a necessity, as they have specific performance criteria that deliver accurate results. In addition, these instruments must be used as per the guidelines provided to avoid any sort of contamination with microorganisms. Such challenges are hindering the growth of the market in focus.
Key Market Customer Landscape
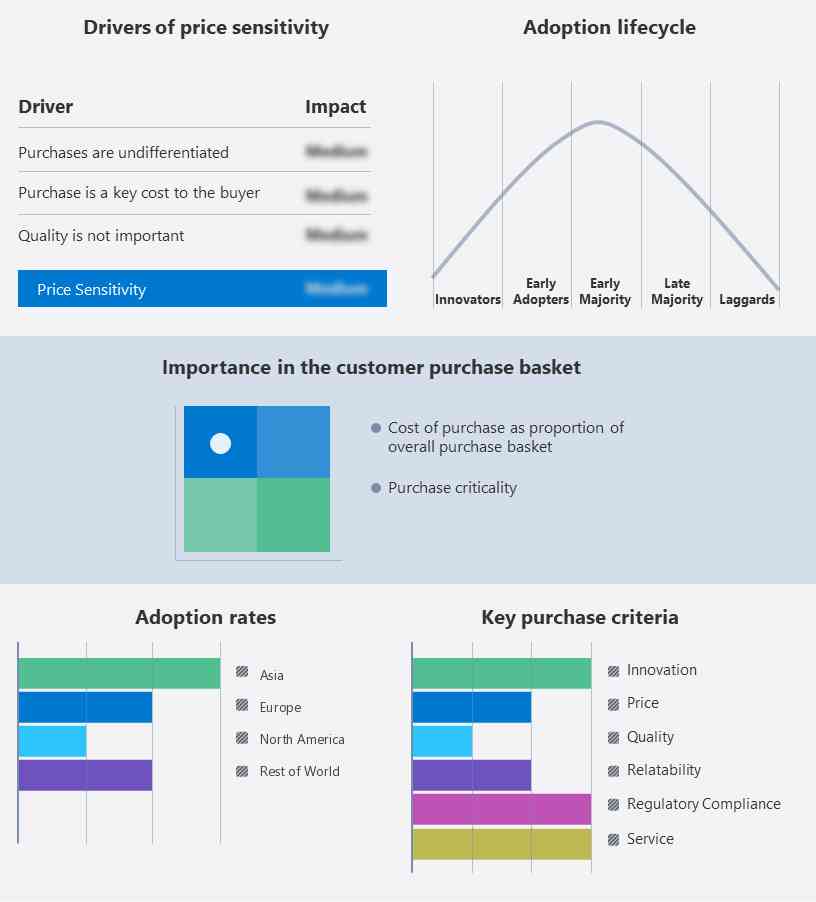
The market research report includes the adoption lifecycle of the market, covering from the innovator's stage to the laggard's stage. It focuses on adoption rates in different regions based on penetration. Furthermore, the report also includes key purchase criteria and drivers of price sensitivity to help companies evaluate and develop their growth strategies.
Global Market Customer Landscape
Who are the Major Market Companies?
Companies are implementing various strategies, such as strategic alliances, partnerships, mergers and acquisitions, geographical expansion, and product launches, to enhance their presence in the market.
- Azure Biosystems Inc.: The company offers gel documentation systems which is a method used to record and measure labeled nucleic acid and protein in various types of media, like acrylamide, agarose, or cellulose.
The market research report also includes detailed analyses of the competitive landscape of the market and information about 15 market companies, including:
- ATTO Corporation
- Bio Rad Laboratories Inc.
- Bio Techne Corp.
- Carestream Health Inc
- Cleaver Scientific Ltd.
- Clinx Science Instruments Co. Ltd.
- Corning Inc.
- Endress Hauser Group Services AG
- Gel Co. Inc
- General Electric Co.
- GOLD SIM International Group Co. Ltd.
- Isogen Life Science BV
- LI COR Inc.
- Royal Bio Tech
Qualitative and quantitative analysis of companies has been conducted to help clients understand the wider business environment as well as the strengths and weaknesses of key market players. Data is qualitatively analyzed to categorize companies as pure play, category-focused, industry-focused, and diversified; it is quantitatively analyzed to categorize companies as dominant, leading, strong, tentative, and weak.
Segment Overview
The market research report provides comprehensive data (region-wise segment analysis), with forecasts and estimates in "USD million" for the period 2024 to 2028, as well as historical data from 2018 to 2022 for the following segments.
- Product Outlook
- Instruments
- Software
- Accessories
- End-user Outlook
- Hospitals and diagnostic centers
- Pharma and biotech companies
- Academic and research institutes
- Region Outlook
- North America
- The U.S.
- Canada
- Europe
- The U.K.
- Germany
- France
- Rest of Europe
- Asia
- China
- India
- Rest of World (ROW)
- Argentina
- Australia
- Rest of the world
- North America
Market Analyst Overview
The market witnesses a growth in demand driven by the need for gel and blot imaging in various applications like immunoassay and 2D electrophoresis. These systems enable precise nucleic acid quantification and aid in the diagnosis and treatment of genetic disorders and cardiovascular disease. With advancements in digital gel documentation instruments and film gel documentation instruments, researchers benefit from enhanced imaging capabilities utilizing technologies such as ultraviolet, chemiluminescence, and fluorescence. Adoption is fueled by the versatility of these systems in molecular biology labs for tasks like DNA separation, sequencing, and preparation, complemented by features like Coomassie Brilliant Blue and Silver Staining for visualization.
Furthermore, the market is experiencing a significant growth driven by factors like the adoption of Plenity and advancements in biomedical movies for research and education. These systems play a crucial role in capturing images of cells and neutrophils immune cells, aiding in various research endeavors. With compatibility for both agarose gel and acrylamide gels, they facilitate the adoption of Gel documentation systems across diverse laboratory settings. Utilized in conjunction with techniques like polymerase chain reaction (PCR), they contribute to the diagnosis and detection of diseases and their subsequent treatment. Enhanced features such as Gel image system and Gel imager offer comprehensive solutions, complemented by all-in-one systems and sequencing technologies for genomic analysis software solutions.
|
Market Scope |
|
|
Report Coverage |
Details |
|
Page number |
171 |
|
Base year |
2023 |
|
Historic period |
2018 - 2022 |
|
Forecast period |
2024-2028 |
|
Growth momentum & CAGR |
Accelerate at a CAGR of 2.64% |
|
Market growth 2024-2028 |
USD 38.8 million |
|
Market structure |
Fragmented |
|
YoY growth 2023-2024(%) |
2.55 |
|
Regional analysis |
North America, Europe, Asia, and Rest of World (ROW) |
|
Performing market contribution |
North America at 33% |
|
Key countries |
US, China, UK, Canada, and Germany |
|
Competitive landscape |
Leading Companies, Market Positioning of Companies, Competitive Strategies, and Industry Risks |
|
Key companies profiled |
ATTO Corporation, Azure Biosystems Inc., Bio Rad Laboratories Inc., Bio Techne Corp., Carestream Health Inc., Cleaver Scientific Ltd., Clinx Science Instruments Co. Ltd., Corning Inc., Endress Hauser Group Services AG, Gel Co. Inc, General Electric Co., GOLD SIM International Group Co. Ltd., Isogen Life Science BV, LI COR Inc., Royal Bio Tech, SDI Group plc, Thermo Fisher Scientific Inc., Vilber Lourmat est une SAS, VWR International LLC, and Wealtec Corp. |
|
Market dynamics |
Parent market analysis, Market growth inducers and obstacles, Fast-growing and slow-growing segment analysis, Market growth and Forecasting, COVID 19 impact and recovery analysis and future consumer dynamics, Market condition analysis for market forecast period |
|
Customization purview |
If our market forecasting report has not included the data that you are looking for, you can reach out to our analysts and get segments customized. |
What are the Key Data Covered in this Market Report?
- CAGR of the market during the forecast period
- Detailed information on factors that will drive the market growth and forecasting of the market between 2024 and 2028
- Precise estimation of the size of the market size and its contribution to the parent market
- Accurate predictions about upcoming market trends and analysis and changes in consumer behavior
- Growth of the market industry across Europe, North America, APAC, South America, and Middle East and Africa
- Thorough market growth analysis of the market's competitive landscape and detailed information about companies
- Comprehensive market analysis and report on the factors that will challenge the market research and growth of market companies
We can help! Our analysts can customize this market research report to meet your requirements. Get in touch
 RIA -
RIA - 
