Generative AI In Pricing Market Analysis, Size, and Forecast 2025-2029: North America (US, Canada, and Mexico), Europe (Germany, UK, and France), APAC (China, Japan, and India), South America (Brazil, Argentina, and Colombia), Middle East and Africa (Saudi Arabia, UAE, and South Africa), and Rest of World (ROW)

Generative AI In Pricing Market Analysis, Size, and Forecast 2025-2029:
North America (US, Canada, and Mexico), Europe (Germany, UK, and France), APAC (China, Japan, and India), South America (Brazil, Argentina, and Colombia), Middle East and Africa (Saudi Arabia, UAE, and South Africa), and Rest of World (ROW)

Published: Dec 2025 301 Pages SKU: IRTNTR81018

Market Overview at a Glance

$314.1 Mn
Market Opportunity
16.6%
CAGR 2024 - 2029
45.1%
North America Growth
$151.5 Mn
Software segment 2023

Generative AI In Pricing Market Size 2025-2029

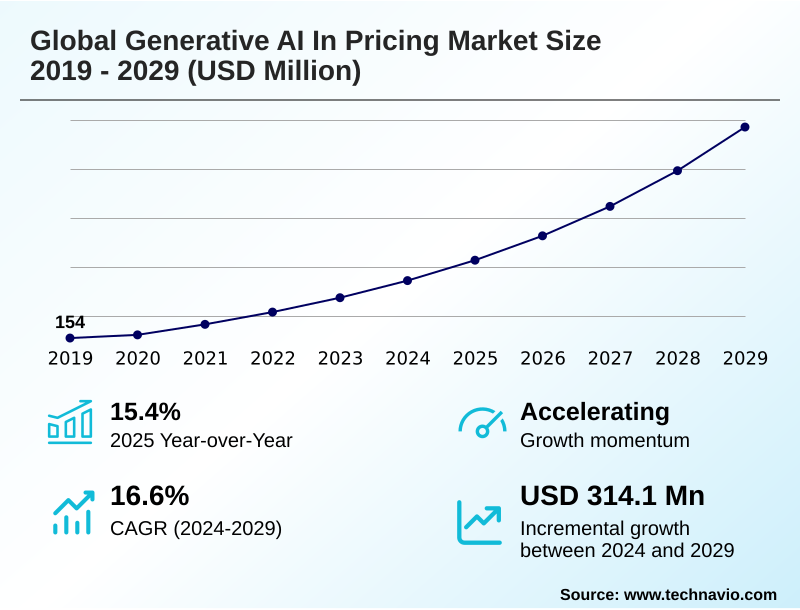
The generative ai in pricing market size is valued to increase by USD 314.1 million, at a CAGR of 16.6% from 2024 to 2029. Imperative for hyper-personalization and real-time dynamic pricing will drive the generative ai in pricing market.

Major Market Trends & Insights

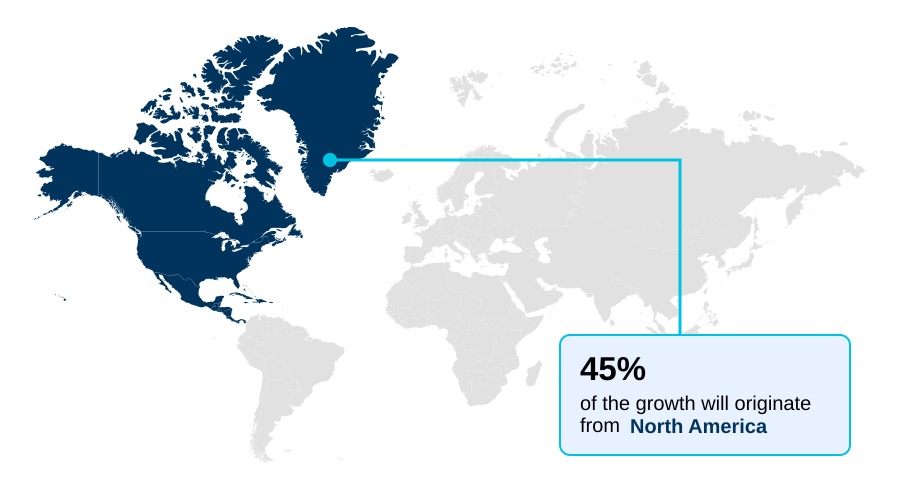
  • North America dominated the market and accounted for a 45.1% growth during the forecast period.
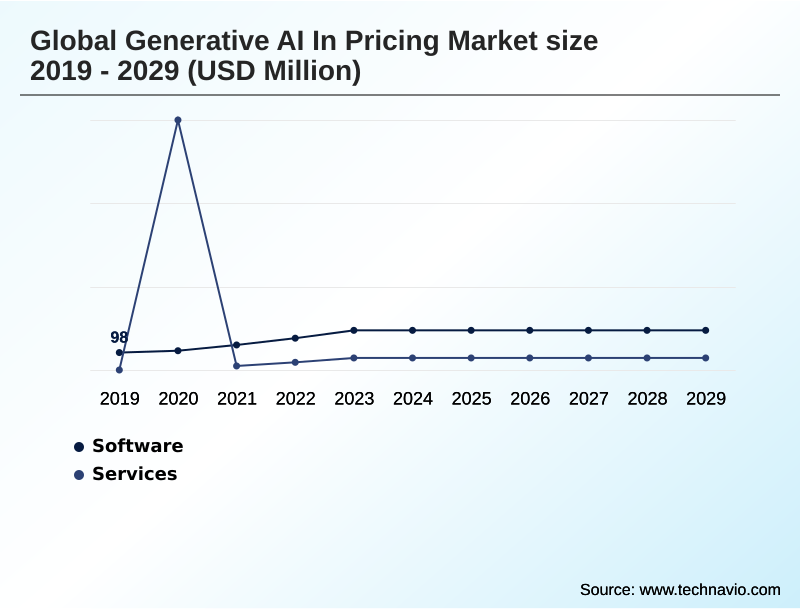
  • By Component - Software segment was valued at USD 151.5 million in 2023
  • By Deployment - Cloud segment accounted for the largest market revenue share in 2023

Market Size & Forecast

  • Market Opportunities: USD 431.6 million
  • Market Future Opportunities: USD 314.1 million
  • CAGR from 2024 to 2029 : 16.6%

Market Summary

  • The generative AI in pricing market is defined by a significant technological shift toward proactive and creative strategy formulation. This evolution is driven by the enterprise need for advanced tools that can manage market volatility and meet consumer demands for hyper-personalized engagement. Unlike traditional analytics, these systems synthesize novel outputs, enabling sophisticated functions like real-time context-aware pricing and strategic simulation.
  • For example, a global retail enterprise can utilize a generative model to analyze unstructured data from social media and news feeds to predict shifts in consumer sentiment. This allows the system to automatically generate and test thousands of promotional bundles and targeted discounts for different micro-segments, optimizing for margin improvement without direct human intervention.
  • The core innovation lies in moving beyond simple price adjustments to creating entire data-driven value propositions, a critical capability in the competitive landscape of the Global Generative AI In Pricing Market 2025-2029. This trend is further supported by the development of more accessible foundational models, though challenges related to data privacy and model explainability persist, influencing the pace of adoption.

What will be the Size of the Generative AI In Pricing Market during the forecast period?

Get Key Insights on Market Forecast (PDF) Request Free Sample

How is the Generative AI In Pricing Market Segmented?

The generative ai in pricing industry research report provides comprehensive data (region-wise segment analysis), with forecasts and estimates in "USD million" for the period 2025-2029, as well as historical data from 2019-2023 for the following segments.

  • Component
    • Software
    • Services
  • Deployment
    • Cloud
    • On premises
  • End-user
    • Retail
    • BFSI
    • Manufacturing
    • Healthcare
    • Others
  • Geography
    • North America
      • US
      • Canada
      • Mexico
    • Europe
      • Germany
      • UK
      • France
    • APAC
      • China
      • Japan
      • India
    • South America
      • Brazil
      • Argentina
      • Colombia
    • Middle East and Africa
      • Saudi Arabia
      • UAE
      • South Africa
    • Rest of World (ROW)

By Component Insights

The software segment is estimated to witness significant growth during the forecast period.

The software segment is central to market evolution, transitioning from analytical tools to dynamic solutions. These platforms increasingly leverage foundational models for sophisticated AI-powered competitive intelligence and automated quote generation.

Modern software provides comprehensive revenue management systems capable of complex scenario generation and price elasticity modeling. Cloud-native architecture facilitates integration with enterprise systems, enabling advanced customer segmentation for pricing and enhancing customer lifetime value calculation.

For instance, integrated tools have demonstrated the ability to improve data processing for pricing models by over 35%.

This evolution is critical for industries like travel and healthcare, enabling dynamic pricing for travel industry services and AI in value-based healthcare pricing, driven by AI-assisted negotiation tools and analysis for AI in financial instrument pricing.

Request Free Sample

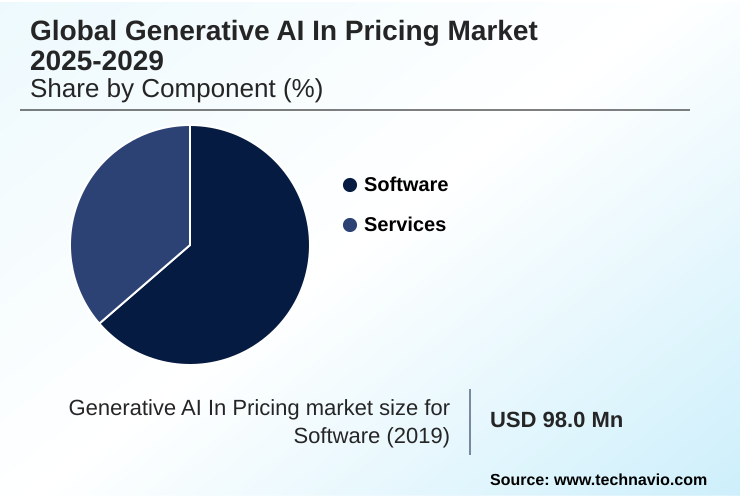
The Software segment was valued at USD 151.5 million in 2023 and showed a gradual increase during the forecast period.

Request Free Sample

Regional Analysis

North America is estimated to contribute 45.1% to the growth of the global market during the forecast period.Technavio’s analysts have elaborately explained the regional trends and drivers that shape the market during the forecast period.

See How Generative AI In Pricing Market Demand is Rising in North America Request Free Sample

The geographic landscape is led by North America, where the adoption of large language models (LLMs) and dynamic pricing models is most mature.

In this region, copilot assistants are being integrated into enterprise workflows, improving pricing analyst productivity by over 20%.

European markets are advancing with a strong focus on regulatory compliance, driving demand for solutions with robust predictive competitor behavior analysis and market scenario modeling.

The APAC region is the fastest-growing market, with a surge in cloud-based pricing engines and generative AI for B2B pricing, particularly within the manufacturing sector, where AI in manufacturing CPQ tools are seeing rapid deployment.

South America and the MEA region are leveraging these technologies to leapfrog legacy systems, focusing on real-time data ingestion to manage economic volatility. LLM applications in finance are a global phenomenon, with competitive pricing analysis tools becoming standard.

Market Dynamics

Our researchers analyzed the data with 2024 as the base year, along with the key drivers, trends, and challenges. A holistic analysis of drivers will help companies refine their marketing strategies to gain a competitive advantage.

  • Businesses are increasingly asking how to implement generative AI for dynamic pricing, seeking to understand the key differences between generative AI vs predictive AI in pricing strategies. The benefits of using LLMs for competitive price analysis are becoming clear, particularly in B2B contract negotiation where generative AI use cases are expanding.
  • However, the challenges of algorithmic bias in AI pricing models require careful consideration, making explainable AI (XAI) for regulatory compliance in pricing a critical discipline. Best practices are emerging for fine-tuning LLMs on proprietary sales data to improve the ROI of implementing an automated quote generation system.
  • Companies are using these systems to understand how generative AI optimizes promotional campaign pricing and to simulate market share impact. A key focus is on integrating generative AI with existing ERP and CRM systems, where AI copilot assistants improve pricing analyst productivity by enabling natural language interfaces for complex pricing queries.
  • The debate over cloud vs on-premise deployment of generative AI pricing engines continues, influenced by the impact of generative AI on customer lifetime value calculation. Ultimately, success hinges on leveraging unstructured data for context-aware pricing, especially for applications like generative AI for value-based pricing in healthcare and mitigating hallucination risks in generative AI pricing models.
  • The shift toward automating price elasticity modeling with generative AI is notable, with some organizations achieving a 40% faster modeling cycle compared to traditional methods, directly impacting strategic planning.

What are the key market drivers leading to the rise in the adoption of Generative AI In Pricing Industry?

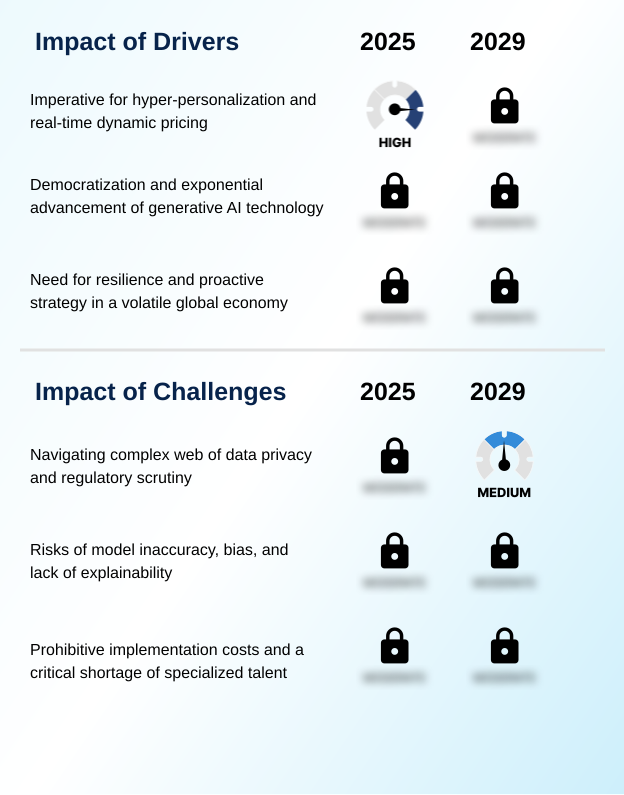
  • The imperative for hyper-personalization and real-time dynamic pricing serves as a primary driver, compelling enterprises to adopt more sophisticated and adaptive pricing strategies.

  • Key market drivers include the enterprise imperative for AI-driven revenue optimization and margin improvement. The adoption of generative AI pricing platforms allows for sophisticated real-time price optimization and value-based pricing, with some businesses reporting a 5% increase in gross margins.
  • Demand forecasting AI and automated discount generation enable proactive strategies, moving beyond reactive price changes. In B2B environments, AI for contract pricing and AI-powered quoting software are streamlining complex negotiations, shortening sales cycles by up to 15%.
  • Automated pricing solutions, particularly in the context of SaaS pricing model AI, are becoming essential for maintaining competitiveness. The ability to perform context-aware pricing and B2B quote optimization delivers a clear and measurable return on investment.

What are the market trends shaping the Generative AI In Pricing Industry?

  • The proliferation of hyper-personalized and context-aware dynamic pricing is an eminent trend. It signifies a shift toward creating individualized value propositions in real time.

  • Market trends are defined by a move toward hyper-personalization, powered by the generative pricing engine. This enables dynamic pricing software to execute one-to-one pricing strategies at scale, a significant leap from traditional segmentation. Leading e-commerce pricing automation platforms now utilize sentiment analysis pricing, processing unstructured data to inform real-time adjustments.
  • This context-aware approach has led to a 10% uplift in conversion rates for personalized marketing offers. The use of strategic pricing simulation allows businesses to model outcomes, while natural language interfaces democratize access to these powerful tools, promoting wider adoption in retail price management.
  • The objective is a cohesive promotional optimization strategy that enhances customer engagement through a personalized pricing strategy and hyper-personalized marketing offers, increasing average order value by over 5%.

What challenges does the Generative AI In Pricing Industry face during its growth?

  • Navigating the complex web of data privacy and regulatory scrutiny represents a significant challenge that impacts the growth and implementation of advanced pricing technologies.

  • Significant market challenges stem from technical complexities and regulatory concerns. The risk of algorithmic bias in AI pricing models necessitates a focus on explainable AI in pricing, with a core challenge being the probabilistic reasoning inherent in these systems. Achieving true model explainability (XAI) is critical for compliance and trust.
  • Furthermore, the process of fine-tuning open-source pricing models on proprietary unstructured data is resource-intensive. Firms using an API for dynamic pricing must also contend with mitigating hallucination risks in generative AI pricing models. Effective implementation requires advanced techniques, including causal inference models and reinforcement learning pricing, to ensure accuracy.
  • The difficulty in performing robust AI tools for price elasticity analysis and managing these advanced systems has slowed adoption for firms without specialized talent, with project failure rates reported as high as 30% without proper MLOps practices.

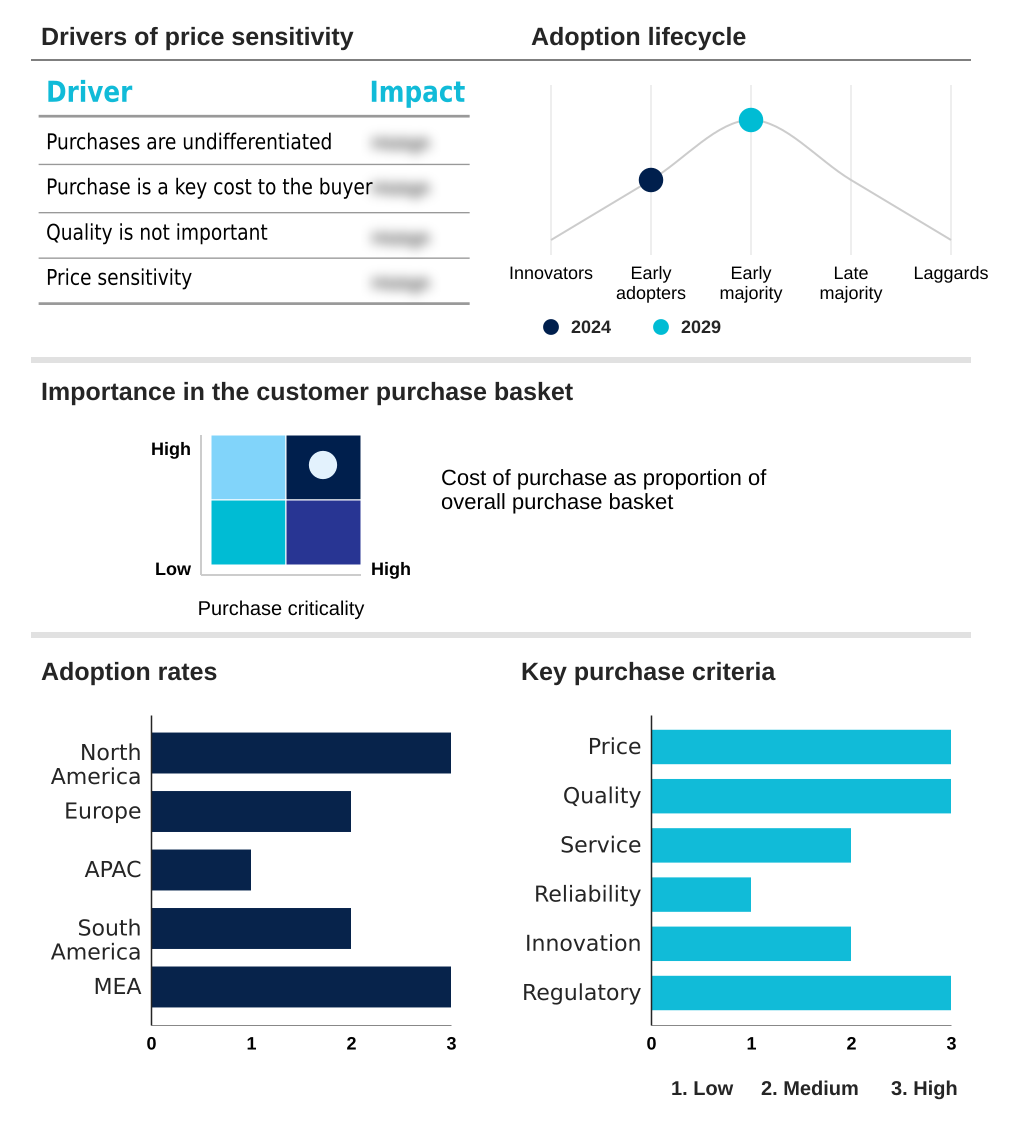
Exclusive Technavio Analysis on Customer Landscape

The generative ai in pricing market forecasting report includes the adoption lifecycle of the market, covering from the innovator’s stage to the laggard’s stage. It focuses on adoption rates in different regions based on penetration. Furthermore, the generative ai in pricing market report also includes key purchase criteria and drivers of price sensitivity to help companies evaluate and develop their market growth analysis strategies.

Customer Landscape of Generative AI In Pricing Industry

Competitive Landscape

Companies are implementing various strategies, such as strategic alliances, generative ai in pricing market forecast, partnerships, mergers and acquisitions, geographical expansion, and product/service launches, to enhance their presence in the industry.

Amazon Web Services Inc. - Key offerings focus on leveraging generative models for dynamic pricing, enabling real-time market analysis, automated quote generation, and strategic price simulation across various enterprise platforms.

The industry research and growth report includes detailed analyses of the competitive landscape of the market and information about key companies, including:

  • Amazon Web Services Inc.
  • Coupa Software Inc.
  • Databricks Inc.
  • Enable
  • Flintfox
  • Google Cloud
  • IBM Corp.
  • Microsoft Corp.
  • Oracle Corp.
  • Pricefx
  • Pros Holdings Inc.
  • Salesforce Inc.
  • SAP SE
  • Snowflake Inc.
  • Vendavo Inc.
  • Vistaar Technologies Inc
  • Zilliant Inc.

Qualitative and quantitative analysis of companies has been conducted to help clients understand the wider business environment as well as the strengths and weaknesses of key industry players. Data is qualitatively analyzed to categorize companies as pure play, category-focused, industry-focused, and diversified; it is quantitatively analyzed to categorize companies as dominant, leading, strong, tentative, and weak.

Recent Development and News in Generative ai in pricing market

  • In August 2024, SAP SE announced a strategic partnership with Databricks Inc. to integrate Databricks' Data Intelligence Platform with SAP S/4HANA. The collaboration aims to provide customers with enhanced capabilities to build custom generative AI models for real-time pricing optimization and supply chain analysis, leveraging unified data within the SAP ecosystem.
  • In November 2024, Pricefx launched 'SimulatePro,' a new generative AI-powered module for its cloud-native platform. The tool enables businesses to conduct advanced strategic pricing simulations, modeling the potential market share and revenue impact of various pricing strategies and competitor reactions in a virtual environment before implementation.
  • In February 2025, a consortium of technology firms including Google and Microsoft, in collaboration with several leading universities, announced a $2 billion initiative to establish AI talent development centers across North America and Europe. The program is designed to address the critical shortage of AI specialists by offering advanced training in areas like MLOps, natural language processing, and ethical AI development, directly supporting the growing need for skilled professionals in the generative AI market.
  • In April 2025, Salesforce Inc. completed its acquisition of 'ClarityAI,' a startup specializing in explainable AI (XAI) and algorithmic bias detection, for a reported $650 million. The acquisition is aimed at strengthening the trust and transparency layer of the Einstein 1 Platform, ensuring that AI-generated pricing and discount recommendations are fair, compliant, and fully auditable for enterprise clients.

Dive into Technavio’s robust research methodology, blending expert interviews, extensive data synthesis, and validated models for unparalleled Generative AI In Pricing Market insights. See full methodology.

Market Scope
Page number 301
Base year 2024
Historic period 2019-2023
Forecast period 2025-2029
Growth momentum & CAGR Accelerate at a CAGR of 16.6%
Market growth 2025-2029 USD 314.1 million
Market structure Fragmented
YoY growth 2024-2025(%) 15.4%
Key countries US, Canada, Mexico, Germany, UK, France, Italy, The Netherlands, Spain, China, Japan, India, South Korea, Australia, Indonesia, Brazil, Argentina, Colombia, Saudi Arabia, UAE, South Africa, Israel and Turkey
Competitive landscape Leading Companies, Market Positioning of Companies, Competitive Strategies, and Industry Risks

Request Free Sample

Research Analyst Overview

  • The generative AI in pricing market represents a fundamental evolution in revenue management systems, driven by the need for hyper-personalization and strategic agility. The core technology leverages foundational models and large language models (LLMs) to power generative pricing engines capable of real-time price optimization and sophisticated value-based pricing.
  • Key applications include automated quote generation for B2B quote optimization, promotional optimization, and dynamic pricing models that facilitate margin improvement and enhance customer lifetime value. Organizations are utilizing AI-powered competitive intelligence and strategic pricing simulation with scenario generation to navigate market volatility.
  • This move is supported by natural language interfaces and copilot assistants that democratize access to complex analytics like price elasticity modeling and demand forecasting AI. For board-level consideration, the adoption of these tools directly impacts strategic positioning, with early adopters reporting up to a 15% improvement in quote-to-close ratios.
  • However, the technology's reliance on probabilistic reasoning introduces challenges like algorithmic bias and the need for model explainability (XAI), making fine-tuning on unstructured data and causal inference models critical for success.
  • The trend is toward one-to-one, context-aware pricing, using sentiment analysis pricing and automated discount generation powered by reinforcement learning pricing and market scenario modeling with real-time data ingestion for predictive competitor behavior.

What are the Key Data Covered in this Generative AI In Pricing Market Research and Growth Report?

  • What is the expected growth of the Generative AI In Pricing Market between 2025 and 2029?

    • USD 314.1 million, at a CAGR of 16.6%

  • What segmentation does the market report cover?

    • The report is segmented by Component (Software, Services), Deployment (Cloud, On premises), End-user (Retail, BFSI, Manufacturing, Healthcare, Others) and Geography (North America, Europe, APAC, South America, Middle East and Africa)

  • Which regions are analyzed in the report?

    • North America, Europe, APAC, South America and Middle East and Africa

  • What are the key growth drivers and market challenges?

    • Imperative for hyper-personalization and real-time dynamic pricing, Navigating complex web of data privacy and regulatory scrutiny

  • Who are the major players in the Generative AI In Pricing Market?

    • Amazon Web Services Inc., Coupa Software Inc., Databricks Inc., Enable, Flintfox, Google Cloud, IBM Corp., Microsoft Corp., Oracle Corp., Pricefx, Pros Holdings Inc., Salesforce Inc., SAP SE, Snowflake Inc., Vendavo Inc., Vistaar Technologies Inc and Zilliant Inc.

Market Research Insights

  • The market's momentum is sustained by a clear business case for AI-driven revenue optimization and the accessibility of generative AI pricing platforms.
  • Implementations of automated pricing solutions are showing a reduction in manual pricing errors by up to 25%, while the use of AI-powered quoting software has been shown to shorten sales cycles by an average of 15% in complex B2B environments. These platforms leverage AI for contract pricing and sophisticated SaaS pricing model AI to deliver measurable returns.
  • As enterprises seek more granular control, the adoption of specialized solutions continues to grow, reflecting a strategic pivot toward proactive revenue management.

We can help! Our analysts can customize this generative ai in pricing market research report to meet your requirements.

Get in touch

1. Executive Summary

1.1 Market overview

Executive Summary - Chart on Market Overview
Executive Summary - Data Table on Market Overview
Executive Summary - Chart on Global Market Characteristics
Executive Summary - Chart on Market by Geography
Executive Summary - Chart on Market Segmentation by Component
Executive Summary - Chart on Market Segmentation by Deployment
Executive Summary - Chart on Market Segmentation by End-user
Executive Summary - Chart on Incremental Growth
Executive Summary - Data Table on Incremental Growth
Executive Summary - Chart on Company Market Positioning

2. Technavio Analysis

2.1 Analysis of price sensitivity, lifecycle, customer purchase basket, adoption rates, and purchase criteria

2.2 Criticality of inputs and Factors of differentiation

Chart on Overview on criticality of inputs and factors of differentiation

2.3 Factors of disruption

Chart on Overview on factors of disruption

2.4 Impact of drivers and challenges

Chart on Impact of drivers and challenges in 2024 and 2029

3. Market Landscape

3.1 Market ecosystem

Chart on Parent Market
Data Table on - Parent Market

3.2 Market characteristics

Chart on Market characteristics analysis

3.3 Value chain analysis

Chart on Value chain analysis

4. Market Sizing

4.1 Market definition

Data Table on Offerings of companies included in the market definition

4.2 Market segment analysis

Market segments

4.3 Market size 2024

4.4 Market outlook: Forecast for 2024-2029

Chart on Global - Market size and forecast 2024-2029 ($ million)
Data Table on Global - Market size and forecast 2024-2029 ($ million)
Chart on Global Market: Year-over-year growth 2024-2029 (%)
Data Table on Global Market: Year-over-year growth 2024-2029 (%)

5. Historic Market Size

5.1 Global Generative AI In Pricing Market 2019 - 2023

Historic Market Size - Data Table on Global Generative AI In Pricing Market 2019 - 2023 ($ million)

5.2 Component segment analysis 2019 - 2023

Historic Market Size - Component Segment 2019 - 2023 ($ million)

5.3 Deployment segment analysis 2019 - 2023

Historic Market Size - Deployment Segment 2019 - 2023 ($ million)

5.4 End-user segment analysis 2019 - 2023

Historic Market Size - End-user Segment 2019 - 2023 ($ million)

5.5 Geography segment analysis 2019 - 2023

Historic Market Size - Geography Segment 2019 - 2023 ($ million)

5.6 Country segment analysis 2019 - 2023

Historic Market Size - Country Segment 2019 - 2023 ($ million)

6. Five Forces Analysis

6.1 Five forces summary

Five forces analysis - Comparison between 2024 and 2029

6.2 Bargaining power of buyers

Bargaining power of buyers - Impact of key factors 2024 and 2029

6.3 Bargaining power of suppliers

Bargaining power of suppliers - Impact of key factors in 2024 and 2029

6.4 Threat of new entrants

Threat of new entrants - Impact of key factors in 2024 and 2029

6.5 Threat of substitutes

Threat of substitutes - Impact of key factors in 2024 and 2029

6.6 Threat of rivalry

Threat of rivalry - Impact of key factors in 2024 and 2029

6.7 Market condition

Chart on Market condition - Five forces 2024 and 2029

7. Market Segmentation by Component

7.1 Market segments

Chart on Component - Market share 2024-2029 (%)
Data Table on Component - Market share 2024-2029 (%)

7.2 Comparison by Component

Chart on Comparison by Component
Data Table on Comparison by Component

7.3 Software - Market size and forecast 2024-2029

Chart on Software - Market size and forecast 2024-2029 ($ million)
Data Table on Software - Market size and forecast 2024-2029 ($ million)
Chart on Software - Year-over-year growth 2024-2029 (%)
Data Table on Software - Year-over-year growth 2024-2029 (%)

7.4 Services - Market size and forecast 2024-2029

Chart on Services - Market size and forecast 2024-2029 ($ million)
Data Table on Services - Market size and forecast 2024-2029 ($ million)
Chart on Services - Year-over-year growth 2024-2029 (%)
Data Table on Services - Year-over-year growth 2024-2029 (%)

7.5 Market opportunity by Component

Market opportunity by Component ($ million)
Data Table on Market opportunity by Component ($ million)

8. Market Segmentation by Deployment

8.1 Market segments

Chart on Deployment - Market share 2024-2029 (%)
Data Table on Deployment - Market share 2024-2029 (%)

8.2 Comparison by Deployment

Chart on Comparison by Deployment
Data Table on Comparison by Deployment

8.3 Cloud - Market size and forecast 2024-2029

Chart on Cloud - Market size and forecast 2024-2029 ($ million)
Data Table on Cloud - Market size and forecast 2024-2029 ($ million)
Chart on Cloud - Year-over-year growth 2024-2029 (%)
Data Table on Cloud - Year-over-year growth 2024-2029 (%)

8.4 On premises - Market size and forecast 2024-2029

Chart on On premises - Market size and forecast 2024-2029 ($ million)
Data Table on On premises - Market size and forecast 2024-2029 ($ million)
Chart on On premises - Year-over-year growth 2024-2029 (%)
Data Table on On premises - Year-over-year growth 2024-2029 (%)

8.5 Market opportunity by Deployment

Market opportunity by Deployment ($ million)
Data Table on Market opportunity by Deployment ($ million)

9. Market Segmentation by End-user

9.1 Market segments

Chart on End-user - Market share 2024-2029 (%)
Data Table on End-user - Market share 2024-2029 (%)

9.2 Comparison by End-user

Chart on Comparison by End-user
Data Table on Comparison by End-user

9.3 Retail - Market size and forecast 2024-2029

Chart on Retail - Market size and forecast 2024-2029 ($ million)
Data Table on Retail - Market size and forecast 2024-2029 ($ million)
Chart on Retail - Year-over-year growth 2024-2029 (%)
Data Table on Retail - Year-over-year growth 2024-2029 (%)

9.4 BFSI - Market size and forecast 2024-2029

Chart on BFSI - Market size and forecast 2024-2029 ($ million)
Data Table on BFSI - Market size and forecast 2024-2029 ($ million)
Chart on BFSI - Year-over-year growth 2024-2029 (%)
Data Table on BFSI - Year-over-year growth 2024-2029 (%)

9.5 Manufacturing - Market size and forecast 2024-2029

Chart on Manufacturing - Market size and forecast 2024-2029 ($ million)
Data Table on Manufacturing - Market size and forecast 2024-2029 ($ million)
Chart on Manufacturing - Year-over-year growth 2024-2029 (%)
Data Table on Manufacturing - Year-over-year growth 2024-2029 (%)

9.6 Healthcare - Market size and forecast 2024-2029

Chart on Healthcare - Market size and forecast 2024-2029 ($ million)
Data Table on Healthcare - Market size and forecast 2024-2029 ($ million)
Chart on Healthcare - Year-over-year growth 2024-2029 (%)
Data Table on Healthcare - Year-over-year growth 2024-2029 (%)

9.7 Others - Market size and forecast 2024-2029

Chart on Others - Market size and forecast 2024-2029 ($ million)
Data Table on Others - Market size and forecast 2024-2029 ($ million)
Chart on Others - Year-over-year growth 2024-2029 (%)
Data Table on Others - Year-over-year growth 2024-2029 (%)

9.8 Market opportunity by End-user

Market opportunity by End-user ($ million)
Data Table on Market opportunity by End-user ($ million)

10. Customer Landscape

10.1 Customer landscape overview

Analysis of price sensitivity, lifecycle, customer purchase basket, adoption rates, and purchase criteria

11. Geographic Landscape

11.1 Geographic segmentation

Chart on Market share by geography 2024-2029 (%)
Data Table on Market share by geography 2024-2029 (%)

11.2 Geographic comparison

Chart on Geographic comparison
Data Table on Geographic comparison

11.3 North America - Market size and forecast 2024-2029

Chart on North America - Market size and forecast 2024-2029 ($ million)
Data Table on North America - Market size and forecast 2024-2029 ($ million)
Chart on North America - Year-over-year growth 2024-2029 (%)
Data Table on North America - Year-over-year growth 2024-2029 (%)
Chart on Regional Comparison - North America
Data Table on Regional Comparison - North America

11.3.1 US - Market size and forecast 2024-2029

Chart on US - Market size and forecast 2024-2029 ($ million)
Data Table on US - Market size and forecast 2024-2029 ($ million)
Chart on US - Year-over-year growth 2024-2029 (%)
Data Table on US - Year-over-year growth 2024-2029 (%)

11.3.2 Canada - Market size and forecast 2024-2029

Chart on Canada - Market size and forecast 2024-2029 ($ million)
Data Table on Canada - Market size and forecast 2024-2029 ($ million)
Chart on Canada - Year-over-year growth 2024-2029 (%)
Data Table on Canada - Year-over-year growth 2024-2029 (%)

11.3.3 Mexico - Market size and forecast 2024-2029

Chart on Mexico - Market size and forecast 2024-2029 ($ million)
Data Table on Mexico - Market size and forecast 2024-2029 ($ million)
Chart on Mexico - Year-over-year growth 2024-2029 (%)
Data Table on Mexico - Year-over-year growth 2024-2029 (%)

11.4 Europe - Market size and forecast 2024-2029

Chart on Europe - Market size and forecast 2024-2029 ($ million)
Data Table on Europe - Market size and forecast 2024-2029 ($ million)
Chart on Europe - Year-over-year growth 2024-2029 (%)
Data Table on Europe - Year-over-year growth 2024-2029 (%)
Chart on Regional Comparison - Europe
Data Table on Regional Comparison - Europe

11.4.1 Germany - Market size and forecast 2024-2029

Chart on Germany - Market size and forecast 2024-2029 ($ million)
Data Table on Germany - Market size and forecast 2024-2029 ($ million)
Chart on Germany - Year-over-year growth 2024-2029 (%)
Data Table on Germany - Year-over-year growth 2024-2029 (%)

11.4.2 UK - Market size and forecast 2024-2029

Chart on UK - Market size and forecast 2024-2029 ($ million)
Data Table on UK - Market size and forecast 2024-2029 ($ million)
Chart on UK - Year-over-year growth 2024-2029 (%)
Data Table on UK - Year-over-year growth 2024-2029 (%)

11.4.3 France - Market size and forecast 2024-2029

Chart on France - Market size and forecast 2024-2029 ($ million)
Data Table on France - Market size and forecast 2024-2029 ($ million)
Chart on France - Year-over-year growth 2024-2029 (%)
Data Table on France - Year-over-year growth 2024-2029 (%)

11.4.4 Italy - Market size and forecast 2024-2029

Chart on Italy - Market size and forecast 2024-2029 ($ million)
Data Table on Italy - Market size and forecast 2024-2029 ($ million)
Chart on Italy - Year-over-year growth 2024-2029 (%)
Data Table on Italy - Year-over-year growth 2024-2029 (%)

11.4.5 The Netherlands - Market size and forecast 2024-2029

Chart on The Netherlands - Market size and forecast 2024-2029 ($ million)
Data Table on The Netherlands - Market size and forecast 2024-2029 ($ million)
Chart on The Netherlands - Year-over-year growth 2024-2029 (%)
Data Table on The Netherlands - Year-over-year growth 2024-2029 (%)

11.4.6 Spain - Market size and forecast 2024-2029

Chart on Spain - Market size and forecast 2024-2029 ($ million)
Data Table on Spain - Market size and forecast 2024-2029 ($ million)
Chart on Spain - Year-over-year growth 2024-2029 (%)
Data Table on Spain - Year-over-year growth 2024-2029 (%)

11.5 APAC - Market size and forecast 2024-2029

Chart on APAC - Market size and forecast 2024-2029 ($ million)
Data Table on APAC - Market size and forecast 2024-2029 ($ million)
Chart on APAC - Year-over-year growth 2024-2029 (%)
Data Table on APAC - Year-over-year growth 2024-2029 (%)
Chart on Regional Comparison - APAC
Data Table on Regional Comparison - APAC

11.5.1 China - Market size and forecast 2024-2029

Chart on China - Market size and forecast 2024-2029 ($ million)
Data Table on China - Market size and forecast 2024-2029 ($ million)
Chart on China - Year-over-year growth 2024-2029 (%)
Data Table on China - Year-over-year growth 2024-2029 (%)

11.5.2 Japan - Market size and forecast 2024-2029

Chart on Japan - Market size and forecast 2024-2029 ($ million)
Data Table on Japan - Market size and forecast 2024-2029 ($ million)
Chart on Japan - Year-over-year growth 2024-2029 (%)
Data Table on Japan - Year-over-year growth 2024-2029 (%)

11.5.3 India - Market size and forecast 2024-2029

Chart on India - Market size and forecast 2024-2029 ($ million)
Data Table on India - Market size and forecast 2024-2029 ($ million)
Chart on India - Year-over-year growth 2024-2029 (%)
Data Table on India - Year-over-year growth 2024-2029 (%)

11.5.4 South Korea - Market size and forecast 2024-2029

Chart on South Korea - Market size and forecast 2024-2029 ($ million)
Data Table on South Korea - Market size and forecast 2024-2029 ($ million)
Chart on South Korea - Year-over-year growth 2024-2029 (%)
Data Table on South Korea - Year-over-year growth 2024-2029 (%)

11.5.5 Australia - Market size and forecast 2024-2029

Chart on Australia - Market size and forecast 2024-2029 ($ million)
Data Table on Australia - Market size and forecast 2024-2029 ($ million)
Chart on Australia - Year-over-year growth 2024-2029 (%)
Data Table on Australia - Year-over-year growth 2024-2029 (%)

11.5.6 Indonesia - Market size and forecast 2024-2029

Chart on Indonesia - Market size and forecast 2024-2029 ($ million)
Data Table on Indonesia - Market size and forecast 2024-2029 ($ million)
Chart on Indonesia - Year-over-year growth 2024-2029 (%)
Data Table on Indonesia - Year-over-year growth 2024-2029 (%)

11.6 South America - Market size and forecast 2024-2029

Chart on South America - Market size and forecast 2024-2029 ($ million)
Data Table on South America - Market size and forecast 2024-2029 ($ million)
Chart on South America - Year-over-year growth 2024-2029 (%)
Data Table on South America - Year-over-year growth 2024-2029 (%)
Chart on Regional Comparison - South America
Data Table on Regional Comparison - South America

11.6.1 Brazil - Market size and forecast 2024-2029

Chart on Brazil - Market size and forecast 2024-2029 ($ million)
Data Table on Brazil - Market size and forecast 2024-2029 ($ million)
Chart on Brazil - Year-over-year growth 2024-2029 (%)
Data Table on Brazil - Year-over-year growth 2024-2029 (%)

11.6.2 Argentina - Market size and forecast 2024-2029

Chart on Argentina - Market size and forecast 2024-2029 ($ million)
Data Table on Argentina - Market size and forecast 2024-2029 ($ million)
Chart on Argentina - Year-over-year growth 2024-2029 (%)
Data Table on Argentina - Year-over-year growth 2024-2029 (%)

11.6.3 Colombia - Market size and forecast 2024-2029

Chart on Colombia - Market size and forecast 2024-2029 ($ million)
Data Table on Colombia - Market size and forecast 2024-2029 ($ million)
Chart on Colombia - Year-over-year growth 2024-2029 (%)
Data Table on Colombia - Year-over-year growth 2024-2029 (%)

11.7 Middle East and Africa - Market size and forecast 2024-2029

Chart on Middle East and Africa - Market size and forecast 2024-2029 ($ million)
Data Table on Middle East and Africa - Market size and forecast 2024-2029 ($ million)
Chart on Middle East and Africa - Year-over-year growth 2024-2029 (%)
Data Table on Middle East and Africa - Year-over-year growth 2024-2029 (%)
Chart on Regional Comparison - Middle East and Africa
Data Table on Regional Comparison - Middle East and Africa

11.7.1 Saudi Arabia - Market size and forecast 2024-2029

Chart on Saudi Arabia - Market size and forecast 2024-2029 ($ million)
Data Table on Saudi Arabia - Market size and forecast 2024-2029 ($ million)
Chart on Saudi Arabia - Year-over-year growth 2024-2029 (%)
Data Table on Saudi Arabia - Year-over-year growth 2024-2029 (%)

11.7.2 UAE - Market size and forecast 2024-2029

Chart on UAE - Market size and forecast 2024-2029 ($ million)
Data Table on UAE - Market size and forecast 2024-2029 ($ million)
Chart on UAE - Year-over-year growth 2024-2029 (%)
Data Table on UAE - Year-over-year growth 2024-2029 (%)

11.7.3 South Africa - Market size and forecast 2024-2029

Chart on South Africa - Market size and forecast 2024-2029 ($ million)
Data Table on South Africa - Market size and forecast 2024-2029 ($ million)
Chart on South Africa - Year-over-year growth 2024-2029 (%)
Data Table on South Africa - Year-over-year growth 2024-2029 (%)

11.7.4 Israel - Market size and forecast 2024-2029

Chart on Israel - Market size and forecast 2024-2029 ($ million)
Data Table on Israel - Market size and forecast 2024-2029 ($ million)
Chart on Israel - Year-over-year growth 2024-2029 (%)
Data Table on Israel - Year-over-year growth 2024-2029 (%)

11.7.5 Turkey - Market size and forecast 2024-2029

Chart on Turkey - Market size and forecast 2024-2029 ($ million)
Data Table on Turkey - Market size and forecast 2024-2029 ($ million)
Chart on Turkey - Year-over-year growth 2024-2029 (%)
Data Table on Turkey - Year-over-year growth 2024-2029 (%)

11.8 Market opportunity by geography

Market opportunity by geography ($ million)
Data Tables on Market opportunity by geography ($ million)

12. Drivers, Challenges, and Opportunity

12.1 Market drivers

Imperative for hyper-personalization and real-time dynamic pricing
Democratization and exponential advancement of generative AI technology
Need for resilience and proactive strategy in a volatile global economy

12.2 Market challenges

Navigating complex web of data privacy and regulatory scrutiny
Risks of model inaccuracy, bias, and lack of explainability
Prohibitive implementation costs and a critical shortage of specialized talent

12.3 Impact of drivers and challenges

Impact of drivers and challenges in 2024 and 2029

12.4 Market opportunities

Proliferation of hyper-personalized and context-aware dynamic pricing
AI-Powered competitive intelligence and strategic pricing simulation
Democratization of advanced pricing analytics through natural language interfaces

13. Competitive Landscape

13.1 Overview

13.2

Overview on criticality of inputs and factors of differentiation

13.3 Landscape disruption

Overview on factors of disruption

13.4 Industry risks

Impact of key risks on business

14. Competitive Analysis

14.1 Companies profiled

Companies covered

14.2 Company ranking index

14.3 Market positioning of companies

Matrix on companies position and classification

14.4 Amazon Web Services Inc.

Amazon Web Services Inc. - Overview
Amazon Web Services Inc. - Product / Service
Amazon Web Services Inc. - Key news
Amazon Web Services Inc. - Key offerings
SWOT

14.5 Coupa Software Inc.

Coupa Software Inc. - Overview
Coupa Software Inc. - Product / Service
Coupa Software Inc. - Key offerings
SWOT

14.6 Databricks Inc.

Databricks Inc. - Overview
Databricks Inc. - Product / Service
Databricks Inc. - Key offerings
SWOT

14.7 Google Cloud

Google Cloud - Overview
Google Cloud - Product / Service
Google Cloud - Key offerings
SWOT

14.8 IBM Corp.

IBM Corp. - Overview
IBM Corp. - Business segments
IBM Corp. - Key news
IBM Corp. - Key offerings
IBM Corp. - Segment focus
SWOT

14.9 Microsoft Corp.

Microsoft Corp. - Overview
Microsoft Corp. - Business segments
Microsoft Corp. - Key news
Microsoft Corp. - Key offerings
Microsoft Corp. - Segment focus
SWOT

14.10 Oracle Corp.

Oracle Corp. - Overview
Oracle Corp. - Business segments
Oracle Corp. - Key news
Oracle Corp. - Key offerings
Oracle Corp. - Segment focus
SWOT

14.11 Pricefx

Pricefx - Overview
Pricefx - Product / Service
Pricefx - Key offerings
SWOT

14.12 Pros Holdings Inc.

Pros Holdings Inc. - Overview
Pros Holdings Inc. - Product / Service
Pros Holdings Inc. - Key offerings
SWOT

14.13 Salesforce Inc.

Salesforce Inc. - Overview
Salesforce Inc. - Product / Service
Salesforce Inc. - Key news
Salesforce Inc. - Key offerings
SWOT

14.14 SAP SE

SAP SE - Overview
SAP SE - Business segments
SAP SE - Key news
SAP SE - Key offerings
SAP SE - Segment focus
SWOT

14.15 Snowflake Inc.

Snowflake Inc. - Overview
Snowflake Inc. - Product / Service
Snowflake Inc. - Key offerings
SWOT

14.16 Vendavo Inc.

Vendavo Inc. - Overview
Vendavo Inc. - Product / Service
Vendavo Inc. - Key offerings
SWOT

14.17 Vistaar Technologies Inc

Vistaar Technologies Inc - Overview
Vistaar Technologies Inc - Product / Service
Vistaar Technologies Inc - Key offerings
SWOT

14.18 Zilliant Inc.

Zilliant Inc. - Overview
Zilliant Inc. - Product / Service
Zilliant Inc. - Key offerings
SWOT

15. Appendix

15.1 Scope of the report

Market definition
Objectives
Notes and caveats

15.2 Inclusions and exclusions checklist

Inclusions checklist
Exclusions checklist

15.3 Currency conversion rates for US$

15.4 Research methodology

15.5 Data procurement

Information sources

15.6 Data validation

15.7 Validation techniques employed for market sizing

15.8 Data synthesis

15.9 360 degree market analysis

15.10 List of abbreviations

Research Methodology

Technavio presents a detailed picture of the market by way of study, synthesis, and summation of data from multiple sources. The analysts have presented the various facets of the market with a particular focus on identifying the key industry influencers. The data thus presented is comprehensive, reliable, and the result of extensive research, both primary and secondary.

INFORMATION SOURCES

Primary sources

  • Manufacturers and suppliers
  • Channel partners
  • Industry experts
  • Strategic decision makers

Secondary sources

  • Industry journals and periodicals
  • Government data
  • Financial reports of key industry players
  • Historical data
  • Press releases

DATA ANALYSIS

Data Synthesis

  • Collation of data
  • Estimation of key figures
  • Analysis of derived insights

Data Validation

  • Triangulation with data models
  • Reference against proprietary databases
  • Corroboration with industry experts

REPORT WRITING

Qualitative

  • Market drivers
  • Market challenges
  • Market trends
  • Five forces analysis

Quantitative

  • Market size and forecast
  • Market segmentation
  • Geographical insights
  • Competitive landscape

Interested in this report?

Get your sample now to see our research methodology and insights!

Download Now

Frequently Asked Questions

Generative AI In Pricing market growth will increase by USD 314.1 million during 2025-2029.

The Generative AI In Pricing market is expected to grow at a CAGR of 16.6% during 2025-2029.

Generative AI In Pricing market is segmented by Component (Software, Services) Deployment (Cloud, On premises) End-user (Retail, BFSI, Manufacturing, Healthcare, Others)

Amazon Web Services Inc., Coupa Software Inc., Databricks Inc., Enable, Flintfox, Google Cloud, IBM Corp., Microsoft Corp., Oracle Corp., Pricefx, Pros Holdings Inc., Salesforce Inc., SAP SE, Snowflake Inc., Vendavo Inc., Vistaar Technologies Inc, Zilliant Inc. are a few of the key vendors in the Generative AI In Pricing market.

North America will register the highest growth rate of 45.1% among the other regions. Therefore, the Generative AI In Pricing market in North America is expected to garner significant business opportunities for the vendors during the forecast period.

US, Canada, Mexico, Germany, UK, France, Italy, The Netherlands, Spain, China, Japan, India, South Korea, Australia, Indonesia, Brazil, Argentina, Colombia, Saudi Arabia, UAE, South Africa, Israel, Turkey

  • Imperative for hyper-personalization and real-time dynamic pricing is the driving factor this market.

The Generative AI In Pricing market vendors should focus on grabbing business opportunities from the Component segment as it accounted for the largest market share in the base year.