
Generative AI In Travel Market Size 2025-2029
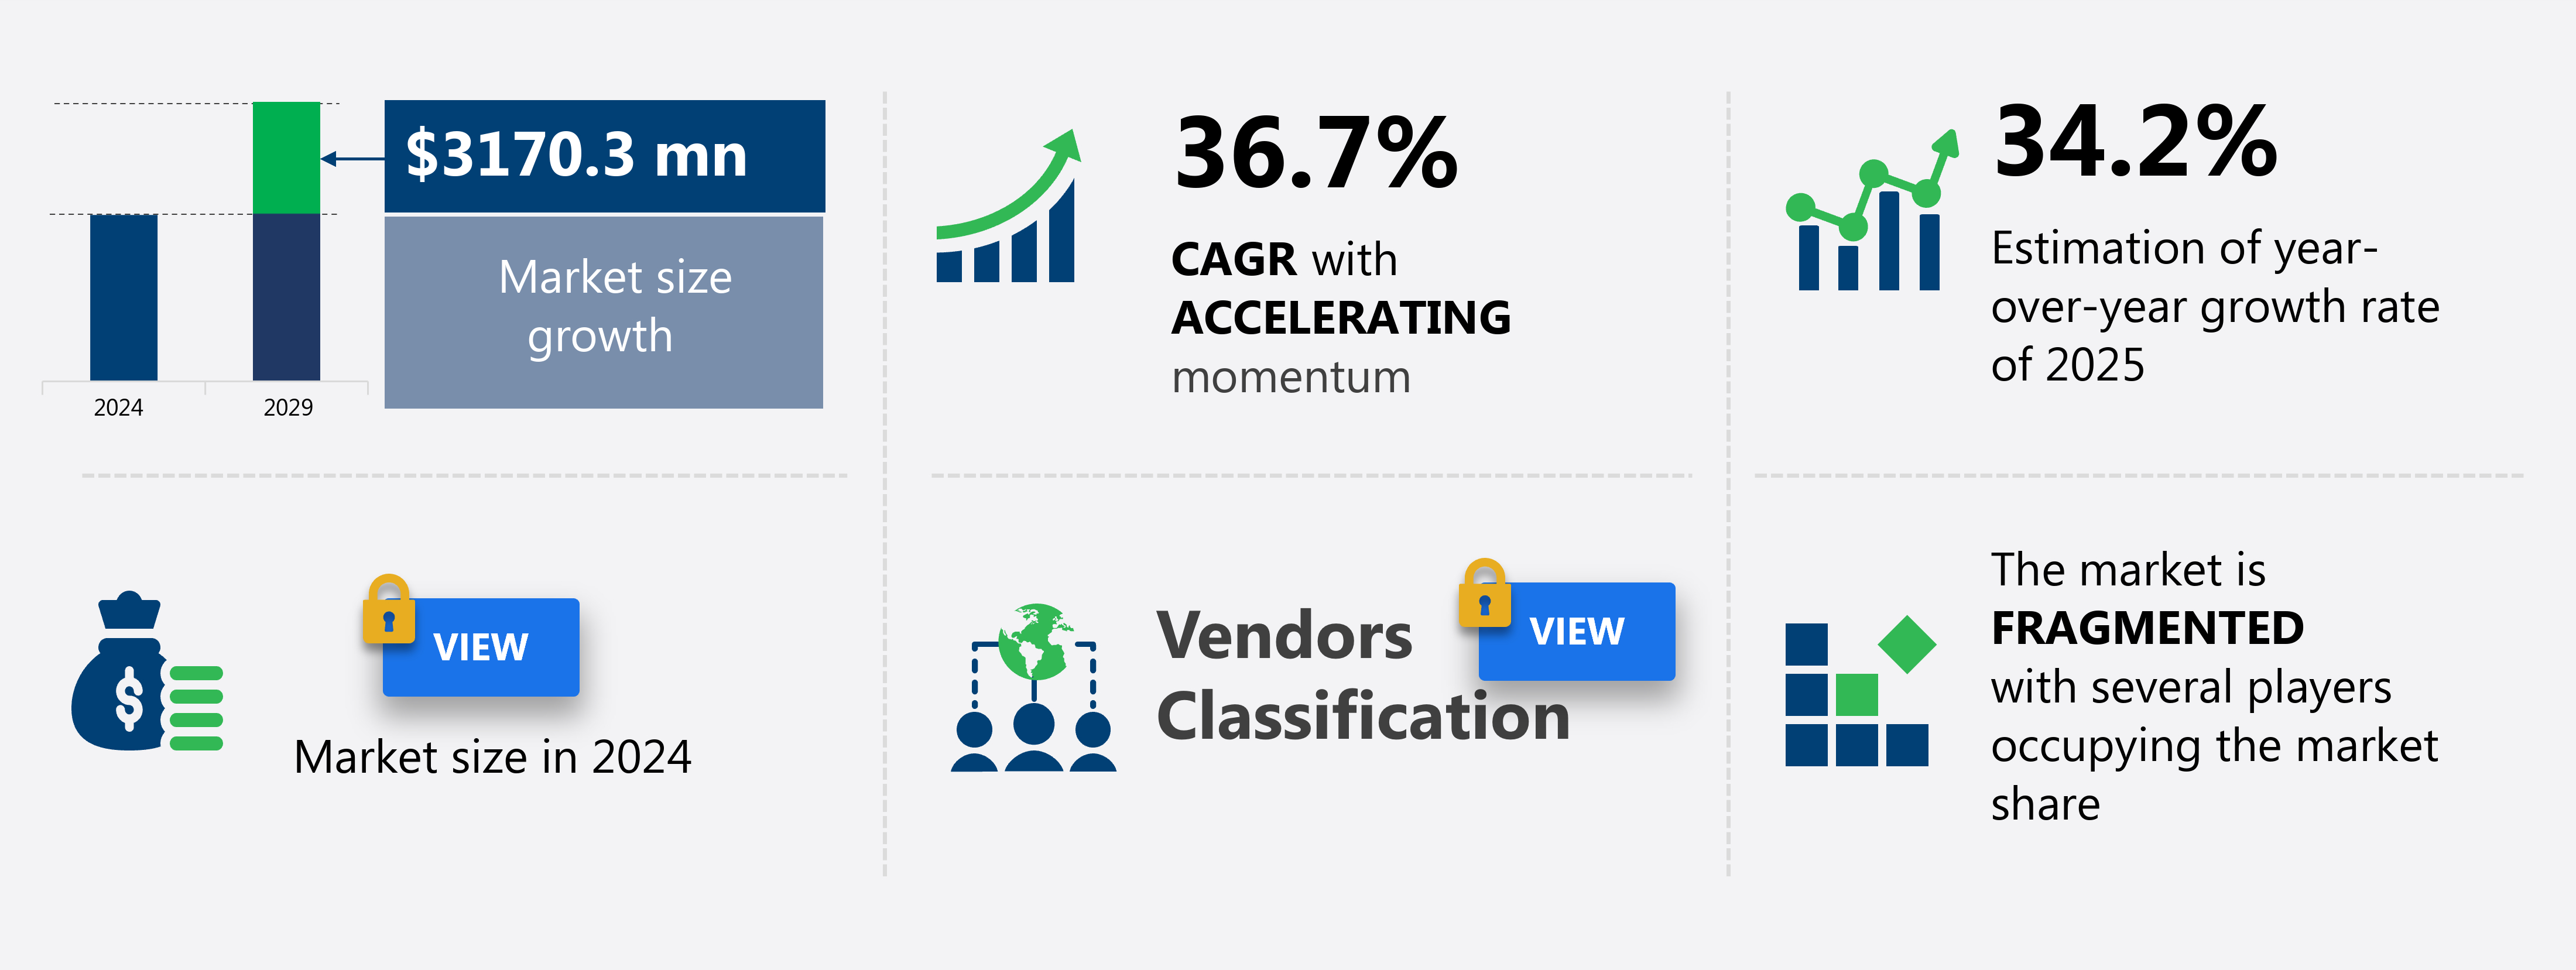
The generative AI in travel market size is forecast to increase by USD 3.17 billion, at a CAGR of 36.7% between 2024 and 2029.
- The market is experiencing significant growth, driven by the increasing demand for hyper-personalized travel experiences. Travel companies are leveraging Generative AI to create customized itineraries, personalized recommendations, and real-time assistance for travelers. This personalized approach not only enhances customer satisfaction but also helps travel companies differentiate themselves in a competitive market. However, the market is not without challenges. Data security and privacy concerns are becoming increasingly important as Generative AI relies heavily on large amounts of personal data.
- Additionally, the integration of AI into travel processes requires significant investment in technology and infrastructure. Companies must carefully consider the costs and benefits of implementing Generative AI and ensure they have the resources to support its integration and ongoing maintenance. Despite these challenges, the potential benefits of Generative AI in Travel are significant, making it an area of focus for forward-thinking travel companies. Travel companies must ensure they have robust data protection measures in place to address these concerns and build trust with their customers. Travel insurance providers leverage AI to assess risk and offer customized policies, while sustainability initiatives and content generation cater to evolving traveler expectations.
What will be the Size of the Generative AI In Travel Market during the forecast period?
Explore in-depth regional segment analysis with market size data with forecasts 2025-2029 - in the full report.
Request Free Sample
The travel industry continues to witness dynamic market activities as generative AI applications unfold across various sectors. Travel translation tools facilitate seamless communication between travelers and locals, while AI-powered pricing strategies optimize fares based on real-time demand and competition. Travel data analysis provides valuable insights into customer behavior, enabling personalized experiences and targeted marketing. For instance, a leading travel booking platform reported a 20% increase in sales after implementing AI-driven recommendation systems. Furthermore, industry growth is anticipated to reach 10% annually, driven by advancements in travel data privacy, route optimization, and language services. Augmented reality travel experiences, travel preference analysis, and smart travel assistants are also transforming the industry landscape.
Travel insurance providers leverage AI to assess risk and offer customized policies, while sustainability initiatives and content generation cater to evolving traveler expectations. Travel risk management and customer service are further enhanced through AI-driven chatbots and virtual travel guides. The ongoing evolution of AI applications in the travel market underscores its potential to revolutionize the industry and create new opportunities.
How is this Generative AI In Travel Market segmented?
The generative AI in travel market research report provides comprehensive data (region-wise segment analysis), with forecasts and estimates in "USD million" for the period 2025-2029,for the following segments.
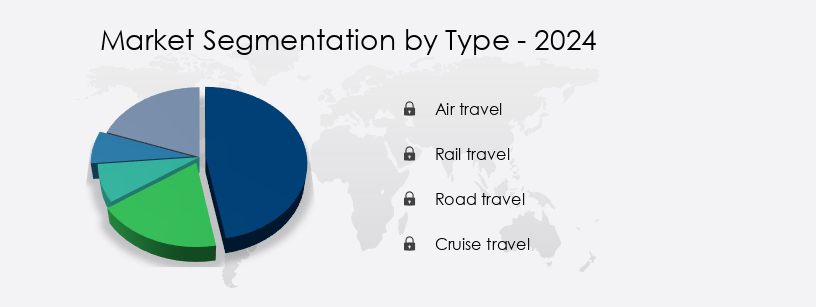
- Type
- Air travel
- Rail travel
- Road travel
- Cruise travel
- Application
- Itinerary generation
- Customer support and chatbots
- Travel content creation
- Others
- End-user
- Leisure travelers
- Travel agents
- Business travelers
- Geography
- North America
- US
- Canada
- Europe
- France
- Germany
- UK
- APAC
- Australia
- China
- India
- Japan
- South Korea
- Rest of World (ROW)
- North America
By Type Insights
The Air travel segment is estimated to witness significant growth during the forecast period. The travel industry is experiencing a significant shift with the integration of generative AI, revolutionizing operational efficiency and enhancing the passenger experience. Airlines and airports are focusing on customer service and personalization to address long-standing challenges. In March 2025, major carriers like KLM, Alaska Airlines, and Delta Air Lines introduced AI-powered booking assistants. These large language model-based tools, such as KLM Ask Atlas and Delta Concierge, enable travelers to use natural language for flight bookings based on interests or topics, transforming the traditional process into a conversational and intuitive interaction. Furthermore, AI-driven travel search, predictive analytics, and personalized recommendations are streamlining the planning process.
The Generative AI in Travel Market is rapidly advancing with solutions like generative travel content and personalized travel recommendations enhancing traveler engagement. AI chatbots for travel and customer service chatbot travel streamline support, while conversational AI travel agent and virtual travel assistant guide users seamlessly. Visual tech includes computer vision travel imagery, image recognition travel spots, and travel data visualization. Services like travel booking optimization, dynamic travel pricing, real-time travel updates, and ai-based travel planning optimize operations.
Sustainable travel suggestions, accessible travel planning, and real-time updates are addressing the evolving needs of travelers. The industry is expected to grow by 7% annually, with AI-based solutions becoming increasingly impactful in areas such as travel photography enhancement, multilingual translation, and dynamic pricing. For instance, a leading airline reported a 20% increase in sales due to personalized travel packages generated by AI. Features like travel risk assessment, travel itinerary generation, augmented reality travel guides, virtual travel experiences, AI-powered travel insurance, travel language translation, multilingual travel translation, and smart travel apps personalize and safeguard the travel experience.
Get a glance at the market share of various segments Request Free Sample
Regional Analysis
North America is estimated to contribute 37% to the growth of the global market during the forecast period. Technavio's analysts have elaborately explained the regional trends and drivers that shape the market during the forecast period.
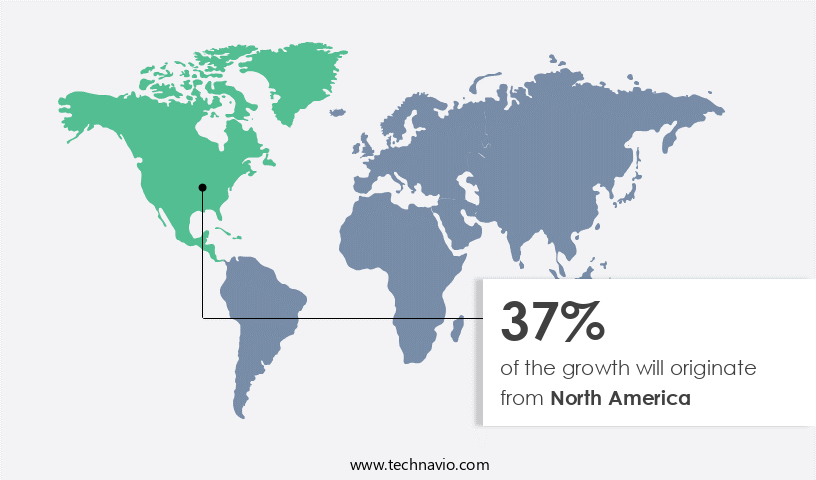
In the travel industry, North America leads the way in the implementation and commercialization of generative artificial intelligence (AI), holding the largest market share in 2023. Major online travel agencies (OTAs) and tech companies based in the region, along with a digitally savvy and demanding consumer base, fuel this adoption. To stay competitive, companies have invested heavily in generative AI as a differentiator. Notable advancements since early 2023 underscore this trend. For instance, leading US-based OTAs have been especially proactive, introducing AI-driven travel search, predictive analytics, personalized recommendations, and real-time updates to enhance the user experience.
Additionally, the travel sector is projected to grow by 7.5% annually, as AI integration becomes increasingly essential for providing engaging, seamless, and accessible travel experiences. One example of successful implementation is a major OTA's AI-powered itinerary generation feature, which increased sales by 30% in its first year. Technologies such as natural language processing travel, sentiment analysis travel reviews, and predictive travel analytics enhance insights, while machine learning travel patterns and a travel recommendation engine drive smarter planning.
Market Dynamics
Our researchers analyzed the data with 2024 as the base year, along with the key drivers, trends, and challenges. A holistic analysis of drivers will help companies refine their marketing strategies to gain a competitive advantage. The Generative AI in Travel Market is rapidly evolving, driven by innovative applications that enhance customer experience and operational efficiency. AI generates personalized travel itineraries and AI automates travel itinerary generation process, streamlining trip planning. AI chatbots for travel booking assistance and conversational AI improving travel customer service offer instant support, while machine learning for travel pattern prediction helps in demand forecasting. Natural language processing travel reviews analysis uncovers traveler insights, and computer vision identifying travel landmarks adds visual intelligence.
AI powered dynamic travel pricing models ensure competitive rates, and AI-based travel risk assessment and mitigation improves safety. Language barriers are reduced through AI enhances multilingual travel translation services and AI enables seamless travel language translation. Accessibility and sustainability are promoted via AI-driven recommendations for accessible travel and AI suggests sustainable travel options. Enhanced engagement comes from AI improves travel photography with enhancement tools, AI creates engaging augmented reality travel guides, and AI facilitates virtual travel experiences and exploration. Additional innovations include AI-powered travel insurance personalized recommendations, AI optimizes travel booking processes and workflows, AI provides real-time travel updates and notifications, and AI personalizes travel packages and offers.
What are the key market drivers leading to the rise in the adoption of Generative AI In Travel Industry?
- The increasing necessity for hyper-personalization is the primary factor fueling market growth. The integration of generative AI in the global travel market is driven by the surging consumer demand for hyper-personalized experiences in mature markets such as North America and Europe. Modern travelers no longer settle for generic, one-size-fits-all travel packages. Instead, they seek customized journeys tailored to their unique preferences, interests, past behaviors, and real-time needs.
- For instance, a leading travel company reported a 30% increase in sales following the implementation of generative AI-powered personalization. The travel industry is expected to grow by 4% annually, with personalization being a key factor in driving this growth. This trend presents a significant opportunity for travel companies to differentiate themselves in a fiercely competitive industry. Generative AI, with its ability to analyze vast and complex datasets, is uniquely suited to deliver personalized travel experiences at a previously unattainable scale.
What are the market trends shaping the Generative AI In Travel Industry?
- The ascension of end-to-end artificial intelligence travel companions represents a significant market trend. End-to-end AI travel companions are becoming increasingly prominent in the market. The travel industry is witnessing a significant transformation with the integration of advanced generative AI technology. AI assistants are no longer just transactional tools; they are evolving into end-to-end travel companions. These sophisticated systems aim to manage the entire travel journey, creating a conversational relationship with the traveler.
- Major players in North America and Europe are leading this trend by developing and deploying multi-modal AI assistants. This shift from transactional tools to conversational companions is a game-changer in the travel market, offering personalized services and enhancing the overall travel experience. These AI assistants serve as a combination of a travel agent concierge and personal assistant, providing assistance at every stage of the trip.
What challenges does the Generative AI In Travel Industry face during its growth?
- Data privacy and security concerns represent a significant challenge to the industry's growth, as organizations must balance the need to collect and use data to drive innovation and business growth with the requirement to protect sensitive information from unauthorized access or misuse. Generative artificial intelligence (AI) is revolutionizing the travel industry, offering hyper-personalized experiences to meet the evolving demands of travelers. However, the adoption of this technology faces a significant challenge: data privacy and security. Generative AI models require extensive data to function effectively, often including sensitive personally identifiable information such as names, passport details, payment card numbers, home addresses, and travel histories.
- For instance, a leading airline reported a 15% increase in sales after implementing a generative AI chatbot to assist customers with booking and managing their travel plans. Despite these benefits, travel companies must prioritize data privacy and security to build trust with their customers and protect their reputation. Implementing robust data protection measures, such as encryption and multi-factor authentication, can help mitigate these risks and enable the travel industry to fully embrace the potential of generative AI. The use and storage of such data pose a substantial risk, making travel companies prime targets for cyberattacks and data breaches. According to a recent study, The market is expected to grow by over 25% in the next five years.
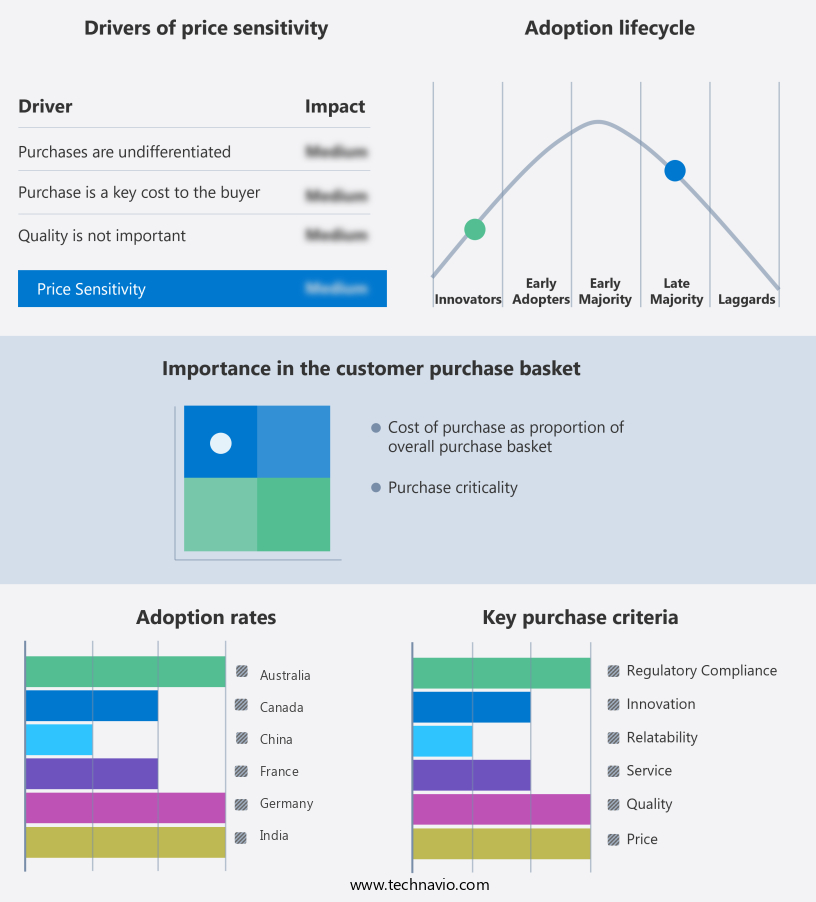
Exclusive Customer Landscape
The generative AI in travel market forecasting report includes the adoption lifecycle of the market, covering from the innovator's stage to the laggard's stage. It focuses on adoption rates in different regions based on penetration. Furthermore, the generative AI in travel market report also includes key purchase criteria and drivers of price sensitivity to help companies evaluate and develop their market growth analysis strategies.
Customer Landscape
Key Companies & Market Insights
Companies are implementing various strategies, such as strategic alliances, generative AI in travel market forecast, partnerships, mergers and acquisitions, geographical expansion, and product/service launches, to enhance their presence in the industry.
[24]7.ai Inc. - The company specializes in generative AI technology for the travel industry, providing personalized accommodation and experience recommendations through advanced generative AI tools.
The industry research and growth report includes detailed analyses of the competitive landscape of the market and information about key companies, including:
- [24]7.ai Inc.
- Agoda Co. Pte. Ltd.
- Airbnb Inc.
- Amadeus IT Group SA
- Booking Holdings Inc.
- Boxever Ltd.
- Expedia Group Inc.
- FLYR Inc.
- Google LLC
- Hopper Inc.
- International Business Machines Corp.
- Microsoft Corp.
- OpenAI
- Oracle Corp.
- Sabre Corp.
- Skyscanner
- Travelport LP
- Trip
Qualitative and quantitative analysis of companies has been conducted to help clients understand the wider business environment as well as the strengths and weaknesses of key industry players. Data is qualitatively analyzed to categorize companies as pure play, category-focused, industry-focused, and diversified; it is quantitatively analyzed to categorize companies as dominant, leading, strong, tentative, and weak.
Recent Development and News in Generative AI In Travel Market
- In January 2024, Amadeus IT Group, a leading travel technology company, announced the launch of their new generative AI solution, "Amadeus SmarTech Generative AI," designed to create personalized travel offers for customers based on their preferences and historical booking data (Amadeus IT Group Press Release).
- In March 2024, Google and Microsoft collaborated on integrating their respective generative AI models, allowing travel companies using Google's Search Console and Microsoft's Bing Travel API to offer more accurate and personalized search results to users (Microsoft News Center and Google Webmasters Blog).
- In April 2025, Expedia Group completed a USD 100 million Series C funding round, primarily to invest in the development and implementation of generative AI technology across its platforms, aiming to enhance user experience and optimize pricing strategies (Expedia Group Press Release).
- In May 2025, the European Union's European Aviation Safety Agency (EASA) approved the use of generative AI in flight planning and optimization for European airlines, marking a significant milestone in the adoption of AI technology in the travel industry (EASA Press Release).
Research Analyst Overview
The travel industry continues to witness dynamic market activities as generative AI applications unfold across various sectors. Travel translation tools facilitate seamless communication between travelers and locals, while AI-powered pricing strategies optimize fares based on real-time demand and competition. Travel data analysis provides valuable insights into customer behavior, enabling personalized experiences and targeted marketing. For instance, a leading travel booking platform reported a 20% increase in sales after implementing AI-driven recommendation systems. Furthermore, industry growth is anticipated to reach 10% annually, driven by advancements in travel data privacy, route optimization, and language services. Augmented reality travel experiences, travel preference analysis, and smart travel assistants are also transforming the industry landscape.
The Generative AI in Travel Market is transforming the industry with intelligent solutions for travel itinerary optimization and travel content generation. Tools like AI travel agent and AI-driven travel planning tools enhance user convenience, supported by robust travel recommendation system and travel search engine capabilities. Services such as travel customer service, travel accessibility features, and travel sustainability are now AI-augmented. Travelers benefit from enhanced visuals using travel photography tools and engaging journeys via virtual travel guide. Personalized experiences are enabled through travel experience personalization, smart travel assistant, and travel language services. Businesses leverage travel marketing automation, travel customer segmentation, travel demand forecasting, and travel route optimization for efficiency.
Innovations like travel booking automation, optimized travel pricing strategy, AI-enhanced travel loyalty programs, AI-powered travel insurance, and travel review analysis are further driving growth and improving satisfaction across the sector. Travel risk management and customer service are further enhanced through AI-driven chatbots and virtual travel guides. The ongoing evolution of AI applications in the travel market underscores its potential to revolutionize the industry and create new opportunities.
Dive into Technavio's robust research methodology, blending expert interviews, extensive data synthesis, and validated models for unparalleled Generative AI In Travel Market insights. See full methodology.
|
Market Scope |
|
|
Report Coverage |
Details |
|
Page number |
230 |
|
Base year |
2024 |
|
Forecast period |
2025-2029 |
|
Growth momentum & CAGR |
Accelerate at a CAGR of 36.7% |
|
Market growth 2025-2029 |
USD 3.17 billion |
|
Market structure |
Fragmented |
|
YoY growth 2024-2025(%) |
34.2 |
|
Key countries |
China, Japan, India, South Korea, Australia, UK, Germany, France, US, and Canada |
|
Competitive landscape |
Leading Companies, Market Positioning of Companies, Competitive Strategies, and Industry Risks |
What are the Key Data Covered in this Generative AI In Travel Market Research and Growth Report?
- CAGR of the Generative AI In Travel industry during the forecast period
- Detailed information on factors that will drive the growth and forecasting between 2025 and 2029
- Precise estimation of the size of the market and its contribution of the industry in focus to the parent market
- Accurate predictions about upcoming growth and trends and changes in consumer behaviour
- Growth of the market across North America, APAC, Europe, South America, and Middle East and Africa
- Thorough analysis of the market's competitive landscape and detailed information about companies
- Comprehensive analysis of factors that will challenge the generative AI in travel market growth of industry companies
We can help! Our analysts can customize this generative AI in travel market research report to meet your requirements.
 RIA -
RIA - 
