
Recommendation Engine Market Size 2024-2028
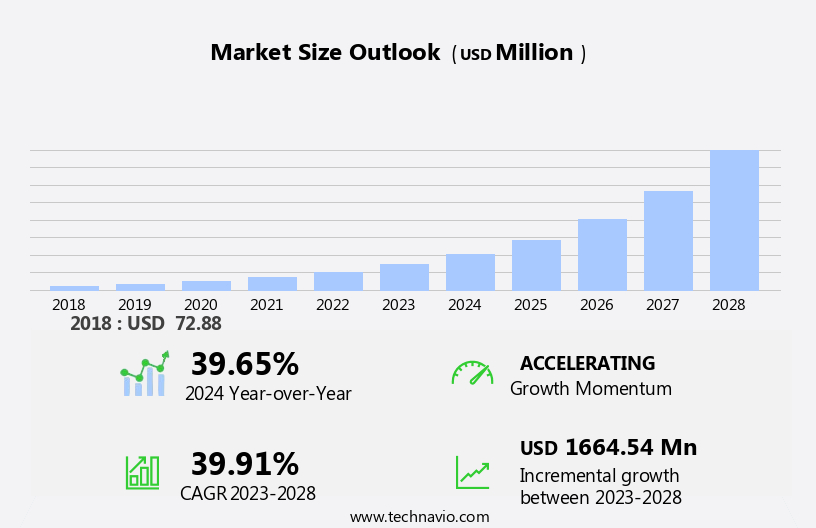
The recommendation engine market size is forecast to increase by USD 1.66 billion, at a CAGR of 39.91% between 2023 and 2028.
- The market is experiencing significant growth, driven by the increasing digitalization of various industries and the rising demand for personalized recommendations. As businesses strive to enhance customer experience and engagement, recommendation engines have become essential tools for delivering tailored product or content suggestions. However, this market is not without challenges. One of the most pressing issues is ensuring accuracy in data prediction. With the vast amounts of data being generated daily, the ability to analyze and make accurate predictions is crucial for the success of recommendation engines. This requires advanced algorithms and machine learning capabilities to effectively understand user behavior and preferences.
- Companies seeking to capitalize on this market's opportunities must invest in developing sophisticated recommendation engines that can navigate the complexities of data analysis and prediction, while also addressing the challenges related to data accuracy. By doing so, they will be well-positioned to meet the growing demand for personalized recommendations and stay competitive in the digital landscape.
What will be the Size of the Recommendation Engine Market during the forecast period?
Explore in-depth regional segment analysis with market size data - historical 2018-2022 and forecasts 2024-2028 - in the full report.
Request Free Sample
The market continues to evolve, driven by advancements in big data, machine learning, and artificial intelligence. These technologies enable the development of more sophisticated recommendation systems, which are finding applications across various sectors. Model evaluation and cloud computing play a crucial role in ensuring the accuracy and efficiency of these systems. Feature engineering and data visualization help in extracting insights from complex data sets, while collaborative filtering and search engines facilitate personalized recommendations. Ethical considerations, privacy concerns, and data security are becoming increasingly important in the development of recommendation engines. User behavior analysis and user interface design are essential for optimizing user experience.
Offline recommendations and social media platforms are expanding the reach of recommendation systems, while predictive analytics and performance optimization enhance their effectiveness. Data preprocessing, data mining, and customer segmentation are integral to the data analysis phase of recommendation engine development. Real-time recommendations, natural language processing, and recommendation diversity are key features that differentiate modern recommendation systems from their predecessors. Hybrid recommendations, data enrichment, and deep learning are emerging trends in the market. Recommendation systems are transforming e-commerce platforms by improving product discovery and conversion rate optimization. Model training and algorithm optimization are ongoing processes to ensure recommendation accuracy and relevance.
The market dynamics of recommendation engines are constantly unfolding, reflecting the continuous innovation and evolution in this field.
How is this Recommendation Engine Industry segmented?
The recommendation engine industry research report provides comprehensive data (region-wise segment analysis), with forecasts and estimates in "USD million" for the period 2024-2028, as well as historical data from 2018-2022 for the following segments.
- End-user
- Media and entertainment
- Retail
- Travel and tourism
- Others
- Type
- Cloud
- On-premises
- Geography
- North America
- US
- Europe
- Germany
- APAC
- China
- India
- Japan
- Rest of World (ROW)
- North America
By End-user Insights
The media and entertainment segment is estimated to witness significant growth during the forecast period.
In the digital age, recommendation engines have become an essential component for various industries, particularly in the media and entertainment segment. These engines utilize big data from content management systems and user behavior analysis to deliver accurate and relevant recommendations for articles, news, games, music, movies, and more. Advanced technologies like machine learning, artificial intelligence, and deep learning are integrated to enhance their capabilities. Recommendation engines segregate data based on categories, languages, and ratings, ensuring a personalized user experience. The surge in online platforms for content consumption has fueled the demand for recommendation engines. Social media platforms and e-commerce sites also leverage these engines for product discovery and conversion rate optimization.
Privacy concerns and ethical considerations are addressed through data security measures and user profiling. Predictive analytics and performance optimization ensure recommendation relevance and model accuracy. Offline recommendations cater to users who access content through various devices. Collaborative filtering, content-based filtering, and hybrid recommendations cater to diverse user preferences. Data preprocessing, data cleaning, and data mining are crucial for effective data modeling and algorithm optimization. Recommendation engines are not just limited to online platforms; they are also used in offline environments, such as libraries and retail stores. Cloud computing enables scalability and real-time recommendations. In conclusion, recommendation engines have become indispensable tools for businesses to engage users and enhance their overall experience.
They leverage advanced technologies, data analysis, and user behavior to deliver personalized recommendations, driving customer satisfaction and loyalty.
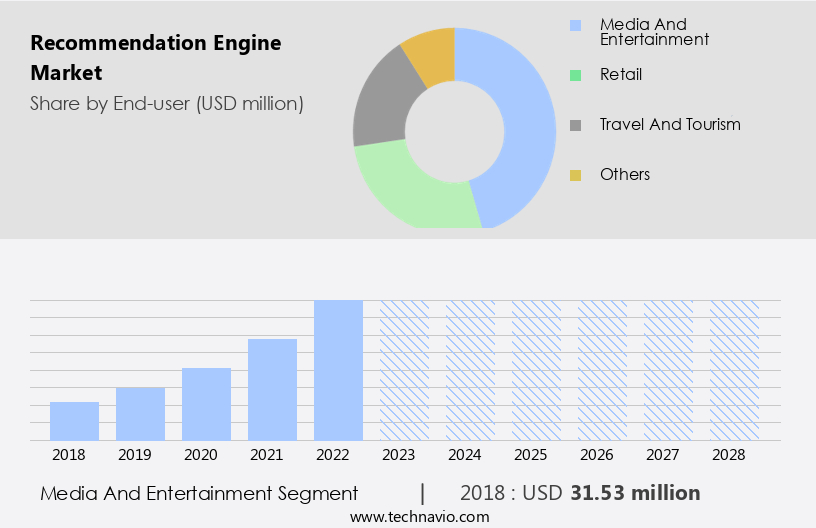
The Media and entertainment segment was valued at USD 31.53 billion in 2018 and showed a gradual increase during the forecast period.
Regional Analysis
North America is estimated to contribute 32% to the growth of the global market during the forecast period.Technavio’s analysts have elaborately explained the regional trends and drivers that shape the market during the forecast period.
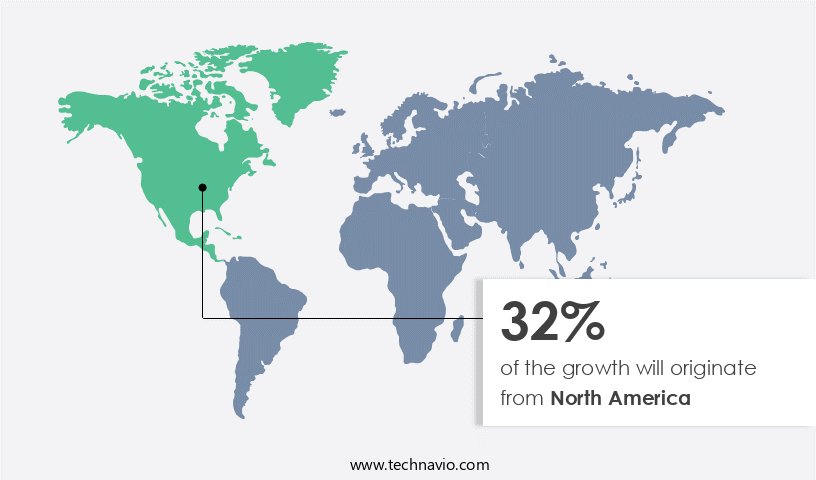
The market in North America is experiencing significant growth, fueled by the increasing adoption of over-the-top (OTT) services, including video-on-demand and audio-on-demand platforms. The Pay TV market in the region is becoming saturated as more consumers shift towards OTT services. The US and Canada are the primary drivers of this market's growth, with a substantial subscriber base for OTT services. The subscription video-on-demand (SVOD) market in North America is thriving due to the presence of both international and domestic players, such as Netflix, Amazon, and Hulu. Recommendation systems are a crucial component of these OTT platforms, enabling personalized content suggestions based on user behavior, search queries, and historical viewing patterns.
Machine learning algorithms and artificial intelligence are used to analyze vast amounts of data, including user preferences, content metadata, and social media interactions, to deliver relevant and novel recommendations. Privacy concerns and user experience are essential factors in the design and implementation of recommendation engines. User interface and data security are critical considerations, with data cleaning and preprocessing essential for accurate and relevant recommendations. Real-time recommendations and predictive analytics are also essential features, ensuring that users are presented with the most relevant content at the right time. Collaborative filtering and content-based filtering are popular recommendation techniques, while deep learning and natural language processing are emerging technologies that enhance recommendation systems' performance.
Data modeling, algorithm optimization, and model training are ongoing efforts to improve recommendation accuracy and relevance. E-commerce platforms also leverage recommendation engines to enhance product discovery and conversion rate optimization. Offline recommendations and hybrid recommendations are other emerging trends in the market, extending the reach of recommendation systems beyond digital channels. Data enrichment, feature engineering, and data visualization are essential aspects of recommendation engine development, ensuring that data is accurately represented and analyzed. Ethical considerations and data mining are also crucial, with transparency and user consent essential for building trust and maintaining user engagement.
Market Dynamics
Our researchers analyzed the data with 2023 as the base year, along with the key drivers, trends, and challenges. A holistic analysis of drivers will help companies refine their marketing strategies to gain a competitive advantage.
What are the key market drivers leading to the rise in the adoption of Recommendation Engine Industry?
- The rise of digitalization serves as the primary catalyst for market growth, transforming industries and businesses through advanced technologies such as artificial intelligence, automation, and the Internet of Things.
- The integration of recommendation engines, fueled by big data and machine learning, is becoming increasingly prevalent across various sectors, including retail, media and entertainment, and transportation. These advanced systems, which utilize content management systems and API integration, enable personalized product and content suggestions to enhance user experience. For instance, a US-based retailer, Zumiez Inc., leveraged Evergage's recommendation platform to boost customer engagement and average order size on its e-commerce site. This resulted in a 55% increase in email capturing. Digitalization offers users unparalleled access to resources, and recommendation engines play a significant role in optimizing this experience.
- Companies are prioritizing user interface, artificial intelligence, and user experience to attract and retain customers, while addressing privacy concerns and ensuring data security. A/B testing and recommendation novelty are essential components of these systems, allowing businesses to continuously improve their offerings and maintain a competitive edge.
What are the market trends shaping the Recommendation Engine Industry?
- The growing demand for personalized recommendations is a notable market trend. Professionals anticipate an increasing preference for tailored suggestions in various industries.
- Recommendation engines are essential tools for businesses to deliver personalized product suggestions to users based on their behavior and preferences. These systems analyze user interactions and historical data to enhance the shopping experience and drive sales in various sectors, including e-commerce, retail, media, and entertainment. For instance, Moss Bros Group Plc, a leading formalwear retailer in the UK, sought to optimize its e-commerce website and offer product recommendations on product detail pages. By implementing a recommendation engine, the company improved user experience and increased revenue. Social media platforms and offline recommendations are also adopting recommendation systems to provide more accurate and relevant suggestions.
- Predictive analytics and performance optimization techniques are used to analyze user behavior and improve recommendation accuracy. Data cleaning and recommendation relevance are crucial aspects of recommendation systems to ensure the highest quality recommendations. E-commerce platforms are investing in recommendation systems to enhance product discovery and improve customer satisfaction. These systems utilize user interactions, search history, and purchase history to suggest relevant products. The integration of recommendation engines is expected to continue growing as businesses aim to provide a more personalized shopping experience and increase sales.
What challenges does the Recommendation Engine Industry face during its growth?
- The challenge of ensuring accuracy in data prediction is a critical issue that significantly impacts the growth of the industry. This concern is particularly relevant as the reliability of data-driven forecasts directly influences business decisions and success.
- Recommendation engines have become an essential component of digital businesses, enabling personalized suggestions to customers based on their past behavior and preferences. However, developing an effective recommendation model poses several challenges. One of the primary issues is model evaluation, ensuring the accuracy and relevance of the recommendations. In sectors like media and entertainment, predicting user behavior for content such as movies and music can be complex due to varying tastes and preferences. Another challenge is the cold start problem, which affects the accurate prediction of content and products for new users. To address these issues, businesses employ various techniques such as collaborative filtering, data mining, data preprocessing, feature engineering, and customer segmentation.
- Cloud computing enables the processing of large data sets required for recommendation engines. Data visualization tools help analyze the data and gain insights. However, ethical considerations are crucial in recommendation engines, ensuring user privacy and data security. Real-time recommendations require robust systems to handle the data inflow and provide immediate suggestions. Search engines and recommendation engines often work together to enhance the user experience. Companies invest in research and development to improve the recommendation algorithms continually. Despite the challenges, recommendation engines offer significant benefits to businesses by increasing customer engagement, improving sales, and enhancing the overall user experience.
Exclusive Customer Landscape
The recommendation engine market forecasting report includes the adoption lifecycle of the market, covering from the innovator’s stage to the laggard’s stage. It focuses on adoption rates in different regions based on penetration. Furthermore, the recommendation engine market report also includes key purchase criteria and drivers of price sensitivity to help companies evaluate and develop their market growth analysis strategies.
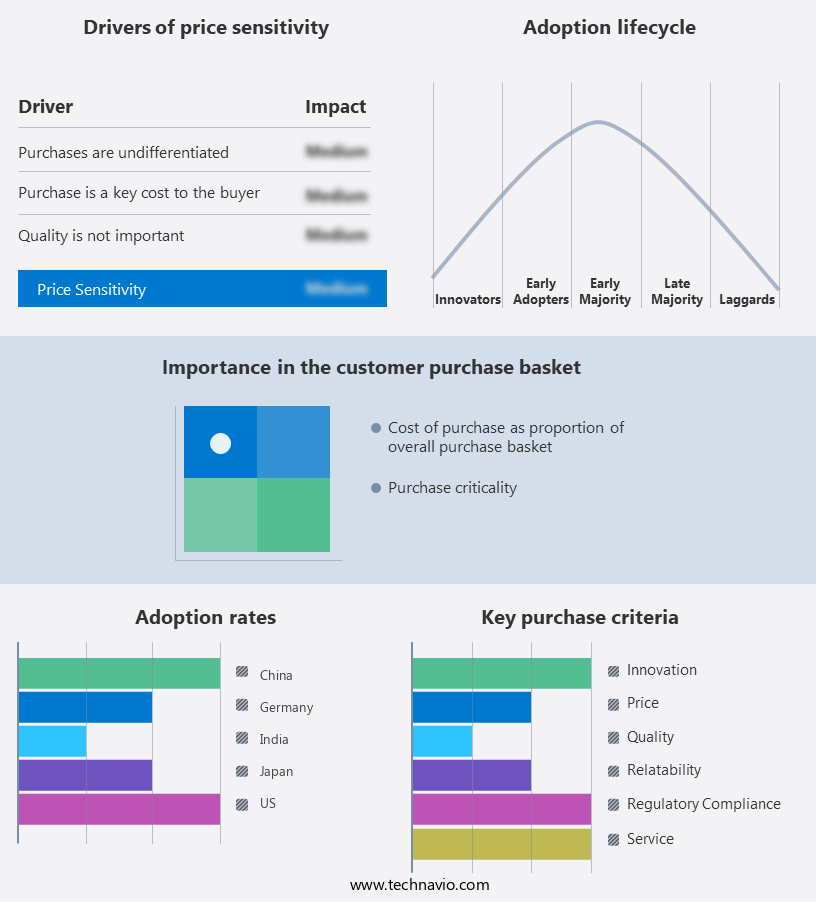
Customer Landscape
Key Companies & Market Insights
Companies are implementing various strategies, such as strategic alliances, recommendation engine market forecast, partnerships, mergers and acquisitions, geographical expansion, and product/service launches, to enhance their presence in the industry.
Alphabet Inc. - This company specializes in recommendation engine solutions, including Adobe Target. Two distinct methods are employed for delivering customized, engaging experiences: content-based and collaborative filtering recommendations. Content-based recommendations utilize user profile data and content attributes to suggest relevant items. Collaborative filtering recommendations analyze user behavior and preferences, comparing them to those of similar users to suggest appropriate content, products, or experiences. By implementing these advanced recommendation capabilities, the company enhances user engagement and satisfaction.
The industry research and growth report includes detailed analyses of the competitive landscape of the market and information about key companies, including:
- Alphabet Inc.
- Amazon.com Inc.
- Cloudera Inc.
- Coveo Solutions Inc.
- Curata Inc.
- Hewlett Packard Enterprise Co.
- Intel Corp.
- Kibo Software Inc.
- Mastercard Inc.
- Microsoft Corp.
- Muvi LLC
- Nosto Solutions Oy
- Oracle Corp.
- Outbrain Inc.
- Piano Software Inc.
- Recombee
- Salesforce Inc.
- SAP SE
- International Business Machines Corp.
- Adobe Inc.
Qualitative and quantitative analysis of companies has been conducted to help clients understand the wider business environment as well as the strengths and weaknesses of key industry players. Data is qualitatively analyzed to categorize companies as pure play, category-focused, industry-focused, and diversified; it is quantitatively analyzed to categorize companies as dominant, leading, strong, tentative, and weak.
Recent Development and News in Recommendation Engine Market
- In January 2024, Amazon Web Services (AWS) introduced a new machine learning-based recommendation engine, "Personalize," at the AWS re:Invent conference. This engine allows businesses to create customized product and content recommendations for their customers, significantly enhancing customer experience and engagement (Amazon Web Services, 2024).
- In March 2024, Microsoft and Adobe announced a strategic partnership to integrate Microsoft's Azure AI and Adobe Experience Platform. This collaboration aimed to provide advanced recommendation capabilities, personalizing content and offers for customers across industries, including retail, media, and finance (Microsoft, 2024).
- In May 2024, Recommend.Ly, a leading recommendation engine provider, raised a USD20 million Series C funding round, led by Sequoia Capital. This investment was aimed at expanding the company's product offerings and accelerating its global growth (Recommend.Ly, 2024).
- In April 2025, Google announced the deployment of its new deep learning-based recommendation engine, "Google Recommendations AI," at Google I/O. This engine uses machine learning algorithms to analyze user behavior and context, providing personalized recommendations across various Google services, such as YouTube and Google Search (Google, 2025).
Research Analyst Overview
- The market is characterized by the integration of various techniques to deliver contextually relevant suggestions to users. Information retrieval algorithms, such as decision trees and reinforcement learning, play a crucial role in this process. However, data governance and privacy are paramount, with data lineage and compliance essential for ensuring trust and transparency. Social recommendations and knowledge-graph-powered suggestions add a human touch, while hybrid systems combine multiple approaches for enhanced accuracy. Topic modeling and clustering algorithms help segment users and content, and ensemble methods offer improved performance.
- Data security and encryption are vital for safeguarding sensitive information, with cloud security a growing concern. Dimensionality reduction and feature selection techniques optimize computational resources, and knowledge-based recommendations leverage domain expertise. Bayesian networks and sentiment analysis contribute to personalized suggestions, while data quality and integrity remain foundational elements. Multi-armed bandits and ensemble methods facilitate continuous improvement and learning.
Dive into Technavio’s robust research methodology, blending expert interviews, extensive data synthesis, and validated models for unparalleled Recommendation Engine Market insights. See full methodology.
|
Market Scope |
|
|
Report Coverage |
Details |
|
Page number |
175 |
|
Base year |
2023 |
|
Historic period |
2018-2022 |
|
Forecast period |
2024-2028 |
|
Growth momentum & CAGR |
Accelerate at a CAGR of 39.91% |
|
Market growth 2024-2028 |
USD 1664.54 million |
|
Market structure |
Fragmented |
|
YoY growth 2023-2024(%) |
39.65 |
|
Key countries |
US, China, India, Japan, and Germany |
|
Competitive landscape |
Leading Companies, Market Positioning of Companies, Competitive Strategies, and Industry Risks |
What are the Key Data Covered in this Recommendation Engine Market Research and Growth Report?
- CAGR of the Recommendation Engine industry during the forecast period
- Detailed information on factors that will drive the growth and forecasting between 2024 and 2028
- Precise estimation of the size of the market and its contribution of the industry in focus to the parent market
- Accurate predictions about upcoming growth and trends and changes in consumer behaviour
- Growth of the market across North America, Europe, APAC, South America, and Middle East and Africa
- Thorough analysis of the market’s competitive landscape and detailed information about companies
- Comprehensive analysis of factors that will challenge the recommendation engine market growth of industry companies
We can help! Our analysts can customize this recommendation engine market research report to meet your requirements.
 RIA -
RIA - 
