
Geomarketing Software Market Size 2024-2028
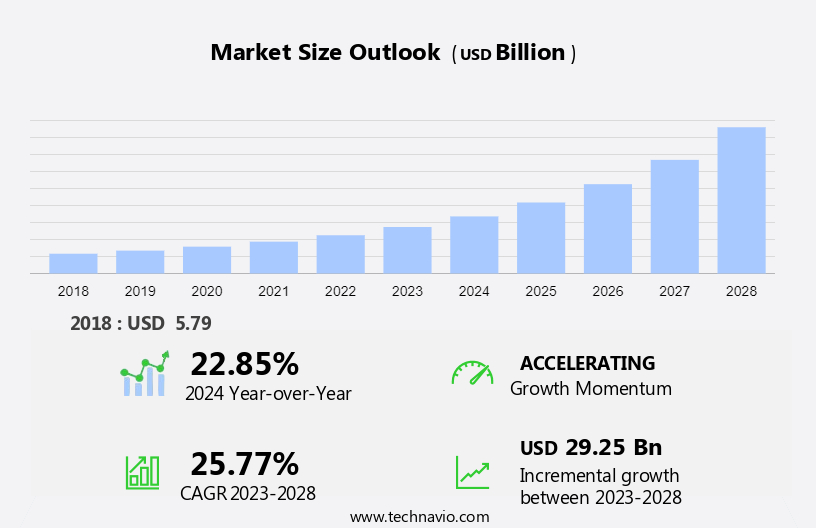
The geomarketing software market size is forecast to increase by USD 29.25 billion at a CAGR of 25.77% between 2023 and 2028.
- The market is experiencing significant growth due to several key trends. The increasing adoption of technologically advanced mobile devices has led to a growth in location-based services, enabling businesses to reach customers more effectively. Big data and location-based analytics are also driving market growth, providing valuable insights for targeted marketing campaigns. However, privacy and security concerns surrounding the use of sensitive customer data pose a challenge for market players. As the market continues to evolve, companies must prioritize data protection and transparency to build trust with consumers. Overall, the market is poised for continued expansion as businesses seek to leverage location data to enhance customer engagement and drive growth.
What will be the Size of the Geomarketing Software Market During the Forecast Period?
- The market is experiencing significant growth due to the increasing use of mobile devices and social networks. This trend is driving the adoption of location-based technology for regional, local, and micro-local geomarketing and nano marketing efforts. Digital marketing strategies are increasingly focusing on investment optimization for business success among local and internet customers, particularly among smartphone users. Additionally, the software enables campaign scheduling and personalization, enhancing the overall effectiveness of marketing efforts. Location-based technology plays a crucial role in this market condition, enabling sales increases through targeted marketing to mobile and social media users.
How is this Geomarketing Software Industry segmented and which is the largest segment?
The geomarketing software industry research report provides comprehensive data (region-wise segment analysis), with forecasts and estimates in "USD billion" for the period 2024-2028, as well as historical data from 2018-2022 for the following segments.
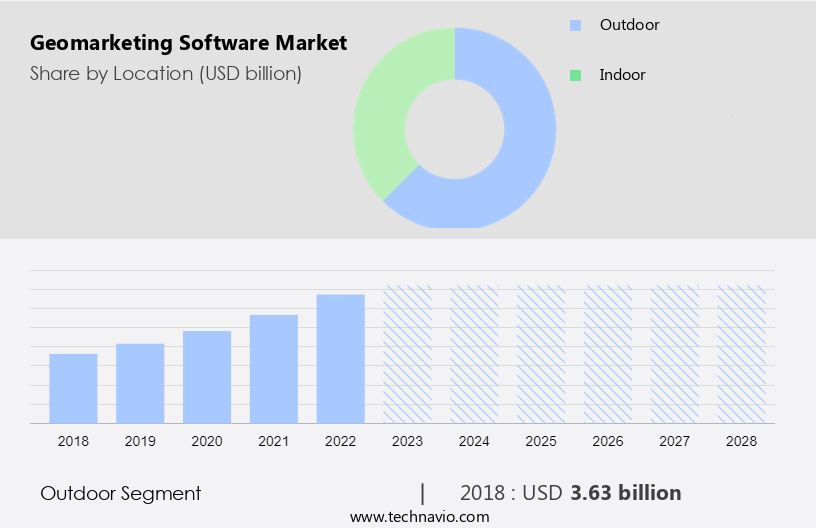
- Location
- Outdoor
- Indoor
- Deployment
- Cloud-based
- On-premises
- Geography
- North America
- US
- APAC
- China
- Japan
- Europe
- Germany
- UK
- Middle East and Africa
- South America
- North America
By Location Insights
- The outdoor segment is estimated to witness significant growth during the forecast period.
Geomarketing software is a valuable tool for businesses seeking to understand and engage with their customers more effectively. This technology leverages mobile devices, social networks, and location-based technology to deliver targeted marketing campaigns to local, mobile, and internet customers. In the retail sector, software enables businesses to analyze customer behavior and shopping patterns through regional, local, and micro-local geomarketing. Nano marketing and investment optimization are additional benefits, allowing businesses to reach their target audience with personalized offers and relevant content. Geomarketing software also facilitates local search positioning, campaign scheduling, and data visualization, providing businesses with a competitive advantage In the digital marketing landscape.
By utilizing demographic and economic data, businesses can optimize their strategies for success, reaching smartphone users and social media users with targeted campaigns. Key features include personalized maps, heat maps, and satellite maps, enabling businesses to better understand foot traffic and catchment areas. Geomarketing software is an essential component of a comprehensive business strategy, helping to increase sales and improve customer engagement.
Get a glance at the market report of share of various segments Request Free Sample
The Outdoor segment was valued at USD 3.63 billion in 2018 and showed a gradual increase during the forecast period.
Regional Analysis
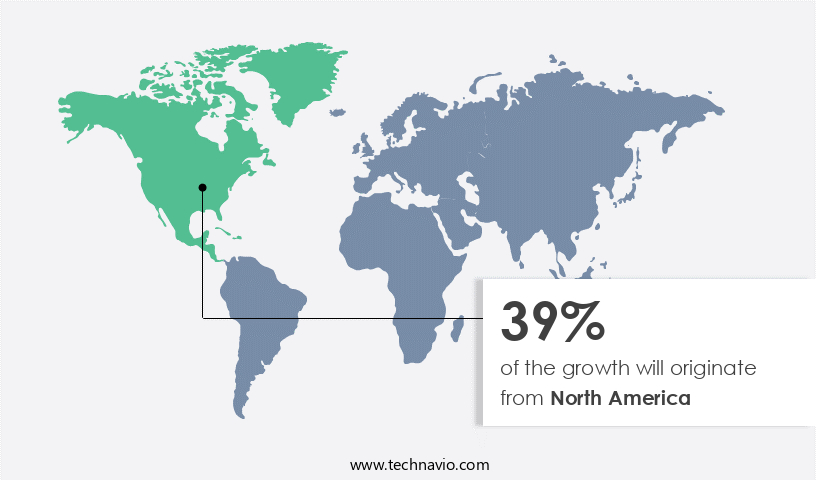
- North America is estimated to contribute 39% to the growth of the global market during the forecast period.
Technavio's analysts have elaborately explained the regional trends and drivers that shape the market during the forecast period.
For more insights on the market size of various regions, Request Free Sample
The North American market is poised for steady expansion, driven by the widespread adoption of advanced technologies in sectors such as telecommunications, retail, healthcare, and media and entertainment In the US and Canada. The region's significant presence of location software providers is fueling the demand for customer management and engagement solutions, leading to increased adoption of software. In the US, marketers leverage mobile ads, display ads, and search ads to target local, internet, and mobile customers effectively. Features such as data visualization, map features, and campaign scheduling offer competitive advantages for businesses seeking to reach their target audience effectively.
Market Dynamics
Our researchers analyzed the data with 2023 as the base year, along with the key drivers, trends, and challenges. A holistic analysis of drivers will help companies refine their marketing strategies to gain a competitive advantage.
What are the key market drivers leading to the rise In the adoption of Geomarketing Software Industry?
Increasing adoption of technologically advanced mobile devices is the key driver of the market.
- The global market for software has experienced significant growth due to the increasing use of mobile devices and social networks. With the proliferation of smartphones and tablets, there has been a growth in location-based data generation from mobile users. This trend is driven by advancements in mobile app interfaces and the adoption of location-enabled devices, enabling businesses to target local customers more effectively. Regional, local, and micro-local geomarketing strategies have gained popularity among businesses seeking investment optimization and increased sales. Nano marketing, a form of geomarketing, utilizes demographic and economical data to deliver personalized offers to specific audiences.
- Digital marketing campaigns are now being scheduled and personalized based on location targeting, with relevant content delivered to social media users and mobile customers. Geomarketing software offers businesses a competitive advantage by allowing for local search positioning, customer behavior analysis, and shopping pattern insights. Features such as digital maps, heat maps, and satellite imagery enable businesses to visualize data and make informed decisions. Campaign success measurement is a crucial component of geomarketing strategies, with tools like Gravity models and simulations used for feasibility studies and field analysis. Retailers, such as Outback Steakhouse and Timberland, have successfully implemented geomarketing strategies, leading to increased sales and business success. The future of geomarketing lies in data visualization and the prediction of future spending patterns based on location and customer behavior. Geomarketing software offers businesses a powerful tool for understanding their customers and optimizing their marketing efforts.
What are the market trends shaping the Geomarketing Software Industry?
Advent of big data and location-based analytics is the upcoming market trend.
- The market is experiencing significant growth due to the increasing use of mobile devices and social networks. This technology enables businesses to engage with local customers more effectively through regional, local, and micro-location marketing. Location-based technology, such as satellite maps and 3D maps, is used to analyze customer behavior, shopping patterns, and business conditions. Geomarketing software allows for investment optimization by targeting specific audiences, including mobile users and social media users, with personalized offers and relevant content. Local search positioning and campaign scheduling are crucial features for businesses looking to increase sales. Demographic and economic data are visualized through data comparison, feasibility studies, and simulations to inform business strategies.
- Companies in various retail sectors, including Outback Steakhouse and Timberland, have gained a competitive advantage through the use of software. The future spending patterns of customers can be predicted and analyzed using advanced analytical tools, such as gravity models and heat maps. Overall, software provides valuable insights for businesses to make informed decisions and improve their marketing campaigns' success.
What challenges does the Geomarketing Software Industry face during its growth?
Rise in privacy and security issues regarding sensitive data is a key challenge affecting the industry growth.
- Geomarketing software is a valuable tool for businesses seeking to reach and engage with their local, mobile, and social media customers more effectively. This technology utilizes location-based data from mobile devices and social networks to deliver targeted marketing campaigns with relevant content to specific audiences. Regional, local, and micro-location geomarketing strategies can optimize investment by understanding customer behavior, shopping patterns, and business conditions. Digital map features, such as Satellite Map, 3D Map, Personalized Map, and Heat Map, enable businesses to visualize data, analyze catchment areas, and simulate future spending patterns. Geocoding and location targeting help businesses position themselves effectively in local search results, increasing sales and reaching new customers.
- Personalized offers, email campaigns, and campaign scheduling are essential components of geomarketing software, allowing businesses to tailor content to individual customers based on demographic and economic data. Businesses can also leverage competitive advantage through automation and data comparison, conducting feasibility studies and field analysis for optimal market positioning. However, the use of sensitive customer location data in geomarketing software raises concerns regarding security and transparency. Ensuring organizational infrastructure, access control, identity management, risk management, regulatory and legislative compliance, auditing, and logging are crucial to mitigate potential risks and maintain customer trust. In a multi-tenant model, proper information security measures must be in place to prevent data leakage and protect against misuse or manipulation.
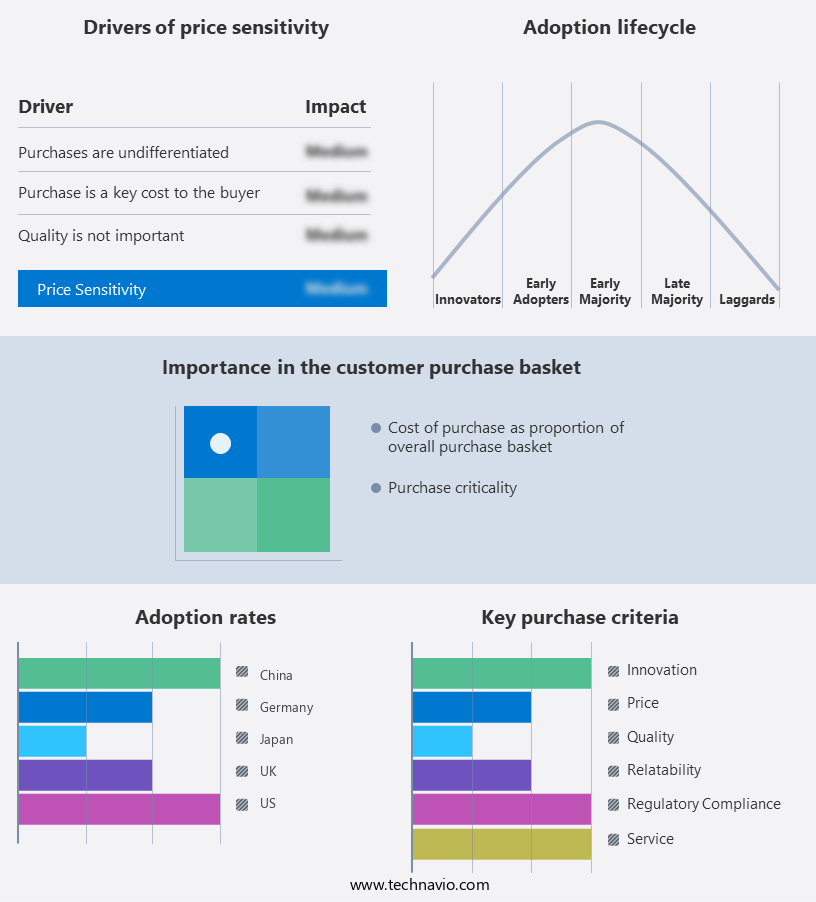
Exclusive Customer Landscape
The geomarketing software market forecasting report includes the adoption lifecycle of the market, market growth and forecasting, covering from the innovator's stage to the laggard's stage. It focuses on adoption rates in different regions based on penetration. Furthermore, the geomarketing software market report also includes key purchase criteria and drivers of price sensitivity to help companies evaluate and develop their market growth analysis strategies.
Customer Landscape
Key Companies & Market Insights
Companies are implementing various strategies, such as strategic alliances, geomarketing software market forecast, partnerships, mergers and acquisitions, geographical expansion, and product/service launches, to enhance their presence In the industry.
The industry research and growth report includes detailed analyses of the competitive landscape of the market and information about key companies, including:
- Adobe Inc.
- Alphabet Inc.
- Bluedot Industries Pty Ltd.
- CartoDB Inc.
- Cisco Systems Inc.
- Egon Srl
- Esri Global Inc.
- Galigeo SAS
- GeoConcept SAS
- International Business Machines Corp.
- Microsoft Corp.
- Nexiga GmbH
- Oracle Corp.
- Qualcomm Inc.
- Quuppa Oy
- Radar Labs Inc.
- Reveal Mobile Inc.
- Salesforce Inc.
- UrbiStat Srl
- WIGeoGIS Softwareerstellungs und Handels GmbH
Qualitative and quantitative analysis of companies has been conducted to help clients understand the wider business environment as well as the strengths and weaknesses of key industry players. Data is qualitatively analyzed to categorize companies as pure play, category-focused, industry-focused, and diversified; it is quantitatively analyzed to categorize companies as dominant, leading, strong, tentative, and weak.
Research Analyst Overview
Geomarketing software has emerged as a crucial tool for businesses seeking to understand and engage with their customers in a more targeted and effective manner. By leveraging location-based data and advanced analytics, this technology enables companies to gain valuable insights into customer behavior, shopping patterns, and market conditions. At its core, geomarketing software utilizes location-based technology to deliver relevant content and personalized offers to specific audiences. This approach allows businesses to reach their target customers at the right place and time, increasing the likelihood of successful campaigns and sales increases. One of the key benefits of geomarketing software is its ability to analyze customer behavior in real-time.
By tracking mobile users and social media activity, businesses can gain a deeper understanding of their audience's preferences and needs. This information can then be used to tailor marketing campaigns and optimize investment in various retail types and channels. Moreover, geomarketing software offers advanced data visualization tools, enabling businesses to gain insights from complex data sets. Features such as digital maps, satellite maps, 3D maps, and heat maps provide a clear and intuitive way to analyze customer demographics, economic data, and other relevant information. Another important aspect of geomarketing software is its ability to automate various marketing tasks, including campaign scheduling, personalization, and local search positioning.
This automation not only saves time and resources but also ensures that businesses are always delivering the most relevant and timely offers to their customers. Furthermore, geomarketing software offers a competitive advantage for businesses looking to stay ahead of the curve in today's digital marketplace. By utilizing advanced location-based analytics, businesses can gain a deeper understanding of their customers and tailor their marketing efforts accordingly, leading to increased sales and customer engagement. Thus, geomarketing software is a powerful tool for businesses looking to gain a competitive edge in today's digital marketplace. By leveraging location-based data and advanced analytics, businesses can gain valuable insights into customer behavior, shopping patterns, and market conditions, enabling them to deliver more targeted and effective marketing campaigns and ultimately drive business success.
|
Market Scope |
|
|
Report Coverage |
Details |
|
Page number |
168 |
|
Base year |
2023 |
|
Historic period |
2018-2022 |
|
Forecast period |
2024-2028 |
|
Growth momentum & CAGR |
Accelerate at a CAGR of 25.77% |
|
Market growth 2024-2028 |
USD 29.25 billion |
|
Market structure |
Fragmented |
|
YoY growth 2023-2024(%) |
22.85 |
|
Key countries |
US, China, Japan, UK, and Germany |
|
Competitive landscape |
Leading Companies, Market Positioning of Companies, Competitive Strategies, and Industry Risks |
What are the Key Data Covered in this Geomarketing Software Market Research and Growth Report?
- CAGR of the Geomarketing Software industry during the forecast period
- Detailed information on factors that will drive the growth and forecasting between 2024 and 2028
- Precise estimation of the size of the market and its contribution of the industry in focus to the parent market
- Accurate predictions about upcoming growth and trends and changes in consumer behaviour
- Growth of the market across North America, APAC, Europe, Middle East and Africa, and South America
- Thorough analysis of the market's competitive landscape and detailed information about companies
- Comprehensive analysis of factors that will challenge the geomarketing software market growth of industry companies
We can help! Our analysts can customize this geomarketing software market research report to meet your requirements.
 RIA -
RIA - 
