Geopolymers Market Size 2024-2028
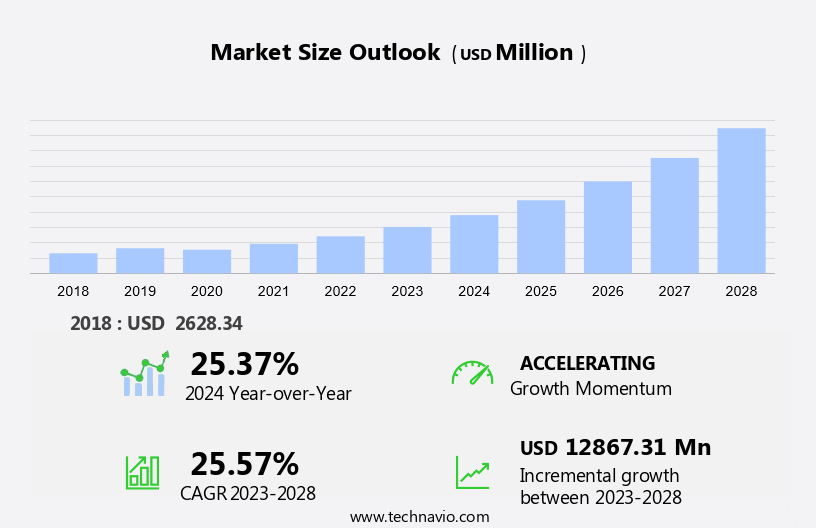
The geopolymers market size is forecast to increase by USD 12.87 billion at a CAGR of 25.57% between 2023 and 2028.
- The market is experiencing significant growth due to several key trends and factors. One of the primary drivers is the increasing adoption of geopolymers in the cement industry, as they offer numerous advantages such as reduced carbon emissions, improved durability, and enhanced workability. Another trend is the growing focus on green buildings, as governments and organizations prioritize sustainability and energy efficiency. However, one challenge facing the market is the lack of awareness among researchers and industry professionals regarding the full potential and applications of geopolymers. Despite this, the market is expected to continue expanding as more companies invest in research and development, and as the benefits of geopolymers become more widely recognized. Overall, the market is poised for strong growth in the coming years, driven by these key trends and factors.
What will the size of the market be during the forecast period?
- Geopolymer materials have gained significant attention in the construction industry due to their eco-friendly properties and potential to reduce greenhouse gas emissions. These materials, which include aluminosilicate sources like fly ash (FA) and slag, are used as an alternative to conventional cement in producing geopolymer cement and concrete. The chemical process involves the use of an alkaline solution to form a three-dimensional network structure, resulting in superior mechanical properties and resistance to fire. Geopolymer materials find extensive applications in various sectors such as precast panels, grout and binder, and 5G base stations.
- The cement industry, a major contributor to CO2 emissions, is expected to increasingly adopt geopolymer cement to lower its carbon footprint. Furthermore, the use of industrial by-products like FA and slag in geopolymer production also reduces the amount of waste generated in landfills. Compared to conventional cement production, which involves burning fuel and generating dust and pollutants, geopolymer production is a more sustainable and eco-friendly process. Mineral-based materials like geopolymer materials offer a viable solution to the environmental concerns associated with cement production.
How is this market segmented and which is the largest segment?
The market research report provides comprehensive data (region-wise segment analysis), with forecasts and estimates in "USD million" for the period 2024-2028, as well as historical data from 2018-2022 for the following segments.
- Product
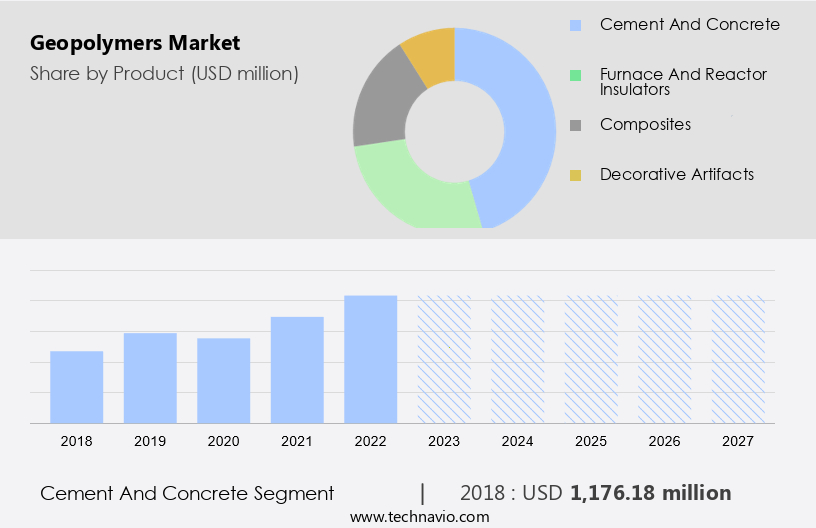
- Cement and concrete
- Furnace and reactor insulators
- Composites
- Decorative artifacts
- Application
- Construction
- Coating application
- Fireproofing
- Others
- Geography
- APAC
- China
- India
- Europe
- Germany
- UK
- North America
- US
- South America
- Middle East and Africa
- APAC
By Product Insights
- The cement and concrete segment is estimated to witness significant growth during the forecast period.
Geopolymer materials, an eco-friendly alternative to ordinary cement, are gaining significant traction in the construction market due to their potential to reduce CO2 emissions. These materials, derived from aluminosilicate sources such as fly ash, slag, and industrial by-products, are used to produce geopolymer cement through a chemical process that does not involve the burning of fuel. This results in a lower carbon footprint and reduces the emission of greenhouse gases, making it an attractive option for sustainable construction. Geopolymers exhibit superior properties, including resistance to fire, and are used in various applications such as precast panels for buildings, road and pavement construction, runway surfaces, bridge and tunnel linings, railroad sleepers, and fireproofing.
In addition, geopolymers are used in nuclear applications for toxic waste immobilization. The cement industry is the third-largest contributor to global CO2 emissions, and the demand for geopolymers is expected to increase as governments and industries seek to reduce their carbon footprint. Geopolymers offer a viable solution to this challenge, as they can be produced using industrial waste, thereby reducing the need for virgin raw materials. Moreover, the production of geopolymers generates less dust and pollutants compared to conventional cement manufacturing. In summary, geopolymer materials offer a sustainable and eco-friendly alternative to conventional cement, with applications ranging from building construction to 5G base stations and nuclear facilities. Their production process reduces CO2 emissions, making them an attractive option for industries and governments seeking to minimize their carbon footprint.
Get a glance at the market report of share of various segments Request Free Sample
The cement and concrete segment was valued at USD 1.18 billion in 2018 and showed a gradual increase during the forecast period.
Regional Analysis
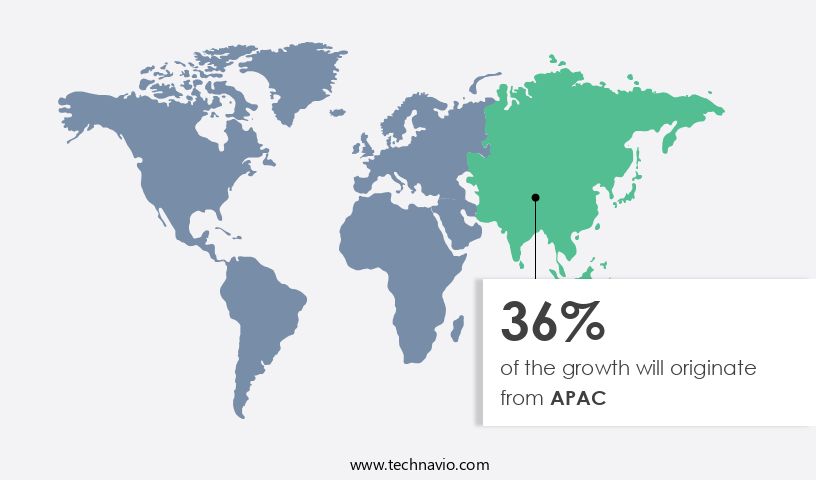
- APAC is estimated to contribute 36% to the growth of the global market during the forecast period.
Technavio's analysts have elaborately explained the regional trends and drivers that shape the market during the forecast period.
For more insights on the market share of various regions Request Free Sample
The market holds significant potential as an eco-friendly alternative to traditional cement production, particularly in the form of adhesives. With resource depletion and environmental pollution becoming increasingly concerning, geopolymers offer a solution by minimizing resource consumption and reducing leaching. The Asia Pacific (APAC) region dominates the market, accounting for the largest share in 2023. Rapid urbanization and industrialization in countries like India and China, driven by construction and infrastructural projects, are the primary factors fueling market growth. China, with the world's largest construction industry, is leading this trend. In response to the economic impact of COVID-19, China is launching new infrastructure plans to promote sustainable growth. Rising household income levels and urban population migration are further driving demand for the construction sector in the country. Waste management systems are also adopting geopolymers to address environmental concerns, making this market a promising investment opportunity.
Market Dynamics
Our researchers analyzed the data with 2023 as the base year, along with the key drivers, trends, and challenges. A holistic analysis of drivers will help companies refine their marketing strategies to gain a competitive advantage.
What are the key market drivers leading to the rise in adoption of Geopolymers Market?
An increase in adoption of geopolymers in cement industry is the key driver of the market.
- Geopolymers, a type of cementitious material, offer significant advantages in various industries, including waste management and infrastructure development. In particular, they are increasingly being used for landfill liners and caps due to their pollution reduction properties. Compared to traditional Portland cement, geopolymers reduce carbon emissions by an impressive 70-80% during production. This is crucial as the cement industry contributes approximately 5% of global CO2 emissions, with 50% stemming from chemical processes and 40% from fuel combustion. Moreover, geopolymers help mitigate the environmental impact of dust, a harmful pollutant generated during pyro-processing, crushing, grinding, and storage activities. Dust, along with fly ash (FA), is also produced in large quantities by other industries such as thermal power plants.
- Unfortunately, less than 25% of the annual global fly ash production is utilized for high value applications like building blocks and concrete, leaving a substantial amount for disposal. Geopolymers' use in waste management and infrastructure projects not only improves durability but also decreases the overall environmental impact. By extending the service life of infrastructure and reducing the need for frequent repairs, geopolymers contribute to long-term sustainability. Furthermore, their versatility extends to art and decoration applications, making them a valuable addition to various industries. In summary, geopolymers' environmental benefits, such as reduced carbon emissions and improved dust management, make them a valuable alternative to traditional cement in numerous applications.
What are the market trends shaping the Geopolymers Market?
Growing focus on green buildings is the upcoming trend in the market.
- In the realm of sustainable construction, green buildings are garnering significant attention. These structures aim to minimize environmental impact and contribute to mitigating global climate change. The construction process of green buildings prioritizes eco-friendly materials, including those with ethical and non-toxic properties. One such innovative solution is geopolymer concrete, derived from industrial waste by-products such as fly ash and ground granulated blast furnace slag. This environmentally-friendly product not only reduces carbon dioxide emissions by approximately 80%, but also ensures sustainability. As a result, geopolymer concrete has become a crucial component in the development of green buildings, reflecting the industry's commitment to reducing its carbon footprint and promoting sustainable practices.
What challenges does Geopolymers Market face during the growth?
Lack of awareness among researchers is a key challenge affecting the market growth.
- Geopolymers offer several advantages in the construction industry, such as enhanced structural performance, reduced carbon footprint, and resistance to harsh weather conditions, acid, and fire. Despite these benefits, the commercial adoption of geopolymer concrete has been limited due to a lack of industry knowledge. Research studies have shown the potential of geopolymers as a material for infrastructure repair and restoration. However, the utilization of geopolymer concrete in large-scale projects like roads, bridges, and tunnels remains low.
- Australia is leading the way in the implementation of geopolymer concrete, with zero CO2 emissions during production. Reports from Beyond Zero Emissions indicate that this innovative concrete has been used in the construction of various roads and pavements in Victoria, including parts of the Westgate Freeway. By embracing eco-friendly practices and incorporating geopolymers into infrastructure projects, the construction industry can improve sustainability and resilience while reducing the environmental impact of building and repairing essential structures.
Exclusive Customer Landscape
The market forecasting report includes the adoption lifecycle of the market, covering from the innovator's stage to the laggard's stage. It focuses on adoption rates in different regions based on penetration. Furthermore, the market report also includes key purchase criteria and drivers of price sensitivity to help companies evaluate and develop their market growth analysis strategies.

Customer Landscape
Key Companies & Market Insights
Companies are implementing various strategies, such as strategic alliances, market forecast , partnerships, mergers and acquisitions, geographical expansion, and product/service launches, to enhance their presence in the market. The market research and growth report includes detailed analyses of the competitive landscape of the market and information about key companies, including:
- Alchemy Geopolymer Solutions LLC
- BASF SE
- CEMEX SAB de CV
- Ecocem Ireland Ltd.
- Geopolymer International
- Geopolymer Solutions LLC
- JSW STEEL Ltd.
- Kiran Global Chem Ltd.
- Pyromeral Systems
- RENCA Inc.
- Schlumberger Ltd.
- smartfix Industries
- Terra CO2
- Uretek India Pvt. Ltd.
- Wagners Holding Co. Ltd.
- Zeobond Pty Ltd.
Qualitative and quantitative analysis of companies has been conducted to help clients understand the wider business environment as well as the strengths and weaknesses of key market players. Data is qualitatively analyzed to categorize companies as pure play, category-focused, industry-focused, and diversified; it is quantitatively analyzed to categorize companies as dominant, leading, strong, tentative, and weak.
Research Analyst Overview
Geopolymer materials have gained significant attention in various industries due to their eco-friendly properties and potential to reduce carbon emissions. These materials, which include aluminosilicate sources like fly ash and slag, are used as alternatives to conventional cement in construction applications such as building, road and pavement, runway, bridge, and tunnel lining. Geopolymer cement, made from alkaline solutions, offers resistance to fire and lower carbon footprint compared to traditional cement production. The construction market, particularly in infrastructure development projects, is witnessing a growing demand for geopolymers due to their improved durability and decreased environmental impact. The use of geopolymers in 5G base stations and other eco-friendly practices in the construction industry is also on the rise.
Further, geopolymers offer cost-effective alternatives to conventional cement in the production of precast panels, adhesives, and as a binder in concrete. The chemical process involved in geopolymer production emits fewer greenhouse gases compared to burning fuel in traditional cement production. Moreover, geopolymers are being used in waste management systems, such as landfill liners and caps, to minimize resource consumption and environmental concerns. These materials also offer minimized leaching and pollution reduction properties, making them an ideal solution for toxic waste immobilization. In the nuclear industry, geopolymers are being used for fireproofing and nuclear waste containment due to their excellent resistance to harsh weather conditions and chemical exposure.
In addition, geopolymers are used for toxic waste immobilization and in the cement industry to reduce dust and pollutants. The demand for geopolymers is expected to grow due to the increasing focus on reducing greenhouse gas emissions and the need for sustainable construction materials. The 5G base station infrastructure is another potential market for geopolymer materials due to their excellent electrical conductivity and thermal stability. Overall, the market for geopolymers is poised for significant growth in various industries, offering a sustainable and eco-friendly alternative to conventional cement and concrete.
|
Market Scope |
|
|
Report Coverage |
Details |
|
Page number |
161 |
|
Base year |
2023 |
|
Historic period |
2018-2022 |
|
Forecast period |
2024-2028 |
|
Growth momentum & CAGR |
Accelerate at a CAGR of 25.57% |
|
Market growth 2024-2028 |
USD 12.87 billion |
|
Market structure |
Fragmented |
|
YoY growth 2023-2024(%) |
25.37 |
|
Key countries |
US, China, India, Germany, and UK |
|
Competitive landscape |
Leading Companies, Market Positioning of Companies, Competitive Strategies, and Industry Risks |
What are the Key Data Covered in this Market Research and Growth Report?
- CAGR of the market during the forecast period
- Detailed information on factors that will drive the market growth and forecasting between 2024 and 2028
- Precise estimation of the size of the market and its contribution of the market in focus to the parent market
- Accurate predictions about upcoming market growth and trends and changes in consumer behaviour
- Growth of the market across APAC, Europe, North America, South America, and Middle East and Africa
- Thorough analysis of the market's competitive landscape and detailed information about companies
- Comprehensive analysis of factors that will challenge the growth of market companies
We can help! Our analysts can customize this market research report to meet your requirements. Get in touch
 RIA -
RIA - 
