5G Base Station Market Size 2024-2028
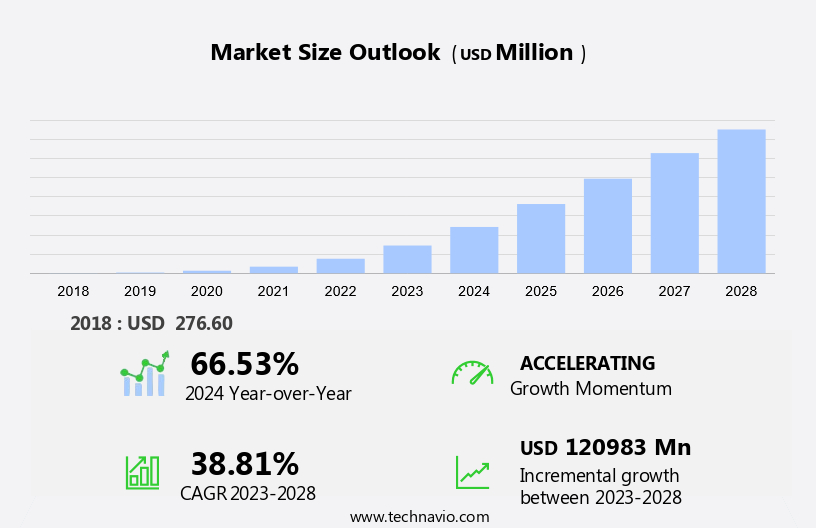
The 5g base station market size is forecast to increase by USD 120.98 billion at a CAGR of 38.81% between 2023 and 2028. The market is experiencing significant growth due to the increasing demand for faster and more reliable wireless communication. One key trend driving this market is the proliferation of consumer electronics, particularly IoT devices, which require high-speed connectivity. Another trend is the deployment of various types of cellular stations, including small cells, microcells, femtocells, and picocells, to enhance the 5G technology network coverage and capacity. However, the market faces challenges from regulatory protocols and complex installation processes. Memory and storage requirements are also increasing due to the large amounts of data being transmitted and processed. Furthermore, the use of fiber optic cables for backhaul connections adds to the infrastructure costs.
What will be the Size of the Market During the Forecast Period?
The market is witnessing significant growth due to the increasing demand for high-speed network connectivity. With the rise in smartphone ownership and the availability of advanced technologies such as Augmented Reality (AR) and Virtual Reality (VR), user satisfaction is at an all-time high. The low latency offered by 5G networks is particularly beneficial for data-intensive services, including industrial internet, smart grid, autonomous driving, and telecommunications. The 5G cellular network technology provides higher bandwidth and data speeds, making it ideal for mobile Internet, IT and telecommunications, and remote work. The 5G subscriptions are expected to stream as more industries adopt this technology for their operations. The 4G networks will continue to coexist with 5G networks, providing a seamless transition for mobile devices and ensuring continuous high-speed data access. Spectrum availability and regulatory frameworks are crucial factors influencing market growth.
Market Segmentation
The market research report provides comprehensive data (region-wise segment analysis), with forecasts and estimates in "USD million" for the period 2024-2028, as well as historical data from 2018-2022 for the following segments.
- Type
- Macro cells
- Small cells
- Application
- Telecommunication companies
- Industrial IoT
- Smart cities
- Automotive
- Others
- Geography
- APAC
- China
- Japan
- South Korea
- Europe
- Germany
- North America
- Middle East and Africa
- South America
- APAC
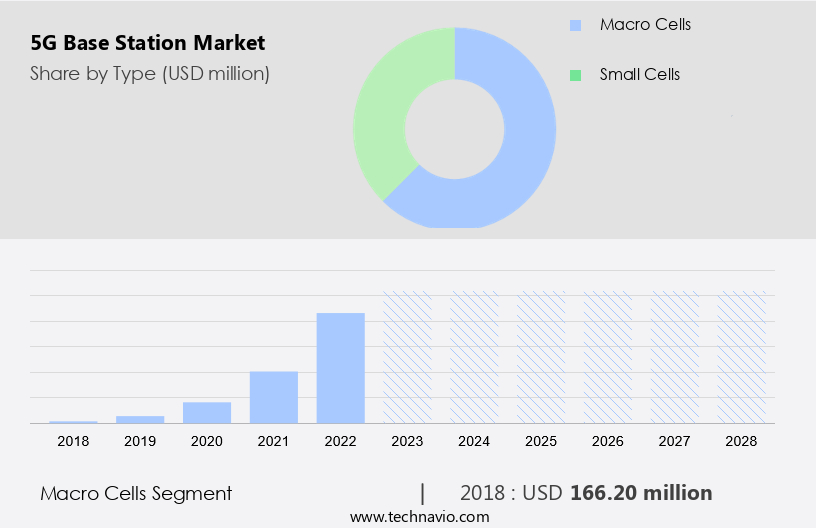
By Type Insights
The macro cells segment is estimated to witness significant growth during the forecast period. The demand for faster communication speeds and reduced latency is driving the growth of the market in the United States. This need is fueled by the increasing adoption of advanced technologies such as smart grid, autonomous driving, and robotic surgeries. These applications necessitate a strong and dependable network infrastructure, which 5G macro cell base stations can provide. With the proliferation of smart homes and the development of smart cities, there is a growing need for extensive data transfer capabilities. The 5G networks are designed to support these requirements, making macro cell base stations an essential component of the 5G infrastructure.
The high-power cell sites, including towers, antennas, and masts, offer larger coverage areas than microcells. The implementation of 5G macro cell base stations will enable the seamless integration of various IoT applications and enhance mobile broadband services. Overall, the 5G macro cell base station market in the US is poised for significant growth due to the increasing demand for high-speed connectivity and the integration of advanced technologies.
Get a glance at the market share of various segments Request Free Sample
The macro cells segment accounted for USD 166.20 million in 2018 and showed a gradual increase during the forecast period.
Regional Insights
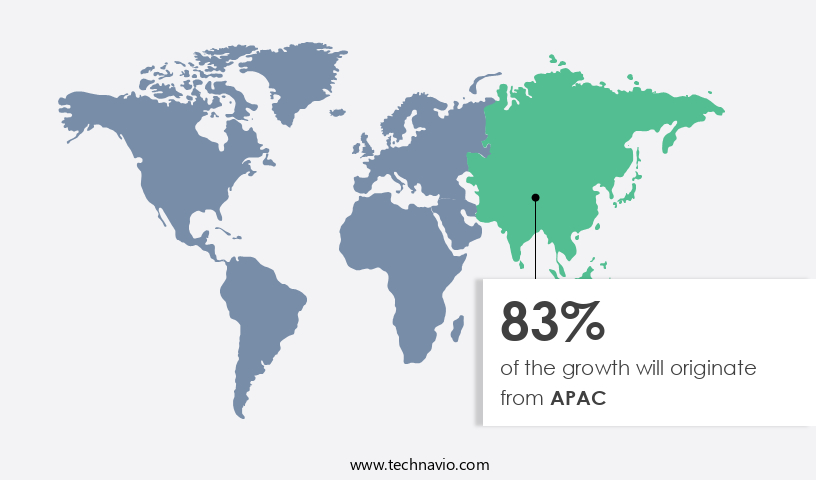
APAC is estimated to contribute 83% to the growth of the global market during the forecast period. Technavio's analysts have elaborately explained the regional trends and drivers that shape the market during the forecast period.
For more insights on the market share of various regions Request Free Sample
The Asia Pacific (APAC) region is witnessing significant growth in the deployment of 5G base stations. This expansion is fueled by increasing consumer and enterprise demand for advanced connectivity solutions. Countries like China, Japan, South Korea, and Australia are prioritizing the implementation of 5G networks, with governments offering regulatory support and incentives to boost telecom operators' infrastructure investments. As a result, there has been a notable increase in the number of 5G base stations being installed in major APAC markets, with a focus on urban areas and transportation corridors. The region's large, tech-savvy population, growing preference for high-bandwidth applications, and the emergence of 5G-powered applications in industries such as manufacturing and smart city development are key factors driving the demand for 5G base stations in APAC.
Further, in conclusion, the APAC region is experiencing a wave in 5G base station installations, driven by the region's large population, growing demand for high-bandwidth applications, and the emergence of 5G-enabled use cases in various sectors. This trend is expected to continue as 5G technology continues to revolutionize industries and transform the way we live, work, and connect.
Our researchers analyzed the data with 2023 as the base year, along with the key drivers, trends, and challenges. A holistic analysis of drivers will help companies refine their marketing strategies to gain a competitive advantage.
Market Driver
The rising adoption of IoT devices is the key driver of the market. The next generation of wireless communication, 5G, is poised to revolutionize the way we connect and transfer data. With the ability to support a greater number of simultaneous connections than its predecessor, 4G, 5G is particularly beneficial for the Internet of Things (IoT) market. The massive machine-type communications (MTC) enabled by 5G are essential for applications in smart cities and industrial automation, as well as for managing and integrating vast numbers of IoT devices.
Further, as the usage of connected devices continues to grow in sectors such as smart homes, healthcare, automotive, and manufacturing, the importance of a reliable and efficient network infrastructure becomes increasingly significant. The high-speed, low-latency connectivity offered by 5G networks is vital for handling the increasing data requirements of these industries.
Market Trends
The growing construction of 5G base stations is the upcoming trend in the market. The expansion of 5G base stations is a significant contributor to the growth of the international market. The integration of 5G technology in sectors like automotive and telecommunications is leading to a rise in the establishment of private 5G networks and base stations. Telecom providers, corporations, and governments are making substantial investments in 5G infrastructure to cater to expanding consumer requirements and facilitate groundbreaking applications. This investment wave is resulting in a substantial increase in the deployment of base stations. As telecom operators introduce 5G networks, they must construct new base stations to accommodate the technology. Furthermore, numerous nations are advocating for 5G infrastructure development, propelling The market forward.
In this context, the demand for high-speed internet connectivity and the proliferation of 5G-enabled smart devices are fueling the adoption of 5G networks and base stations. The increasing investment in 5G infrastructure is expected to create lucrative opportunities for market participants. Network Function Virtualization (NFV) is a key technology trend that is gaining traction in the market, enabling operators to reduce costs and improve network efficiency. In conclusion, the market is poised for significant growth due to the increasing demand for 5G networks and the ongoing infrastructure development efforts.
Market Challenge
High regulatory barriers for 5G base stations is a key challenge affecting the market growth. The deployment of 5G base stations encounters several regulatory hurdles. One significant challenge is securing the necessary spectrum allocation. Government authorities tightly regulate access to radio frequency spectrum bands required for 5G networks, making the process of acquiring licenses intricate and time-consuming. Delays in spectrum licensing can hinder 5G rollouts. Another regulatory barrier is navigating local zoning laws and permit requirements for installing 5G base stations, particularly small cell equipment in urban areas. The bureaucratic process can add to the complexity and slow down the implementation of 5G networks. National security considerations also pose a challenge. Some governments have imposed restrictions on the use of 5G equipment and infrastructure from specific companies due to security concerns.
In conclusion, the deployment of 5G base stations faces regulatory challenges related to spectrum allocation, local zoning and permitting, and national security considerations. Addressing these hurdles is vital for the successful implementation of 5G networks and the integration of essential components like Memory and Storage, Fiber Optic Cables, and Small cells, Microcells, Femtocells, and Picocells.
Exclusive Customer Landscape
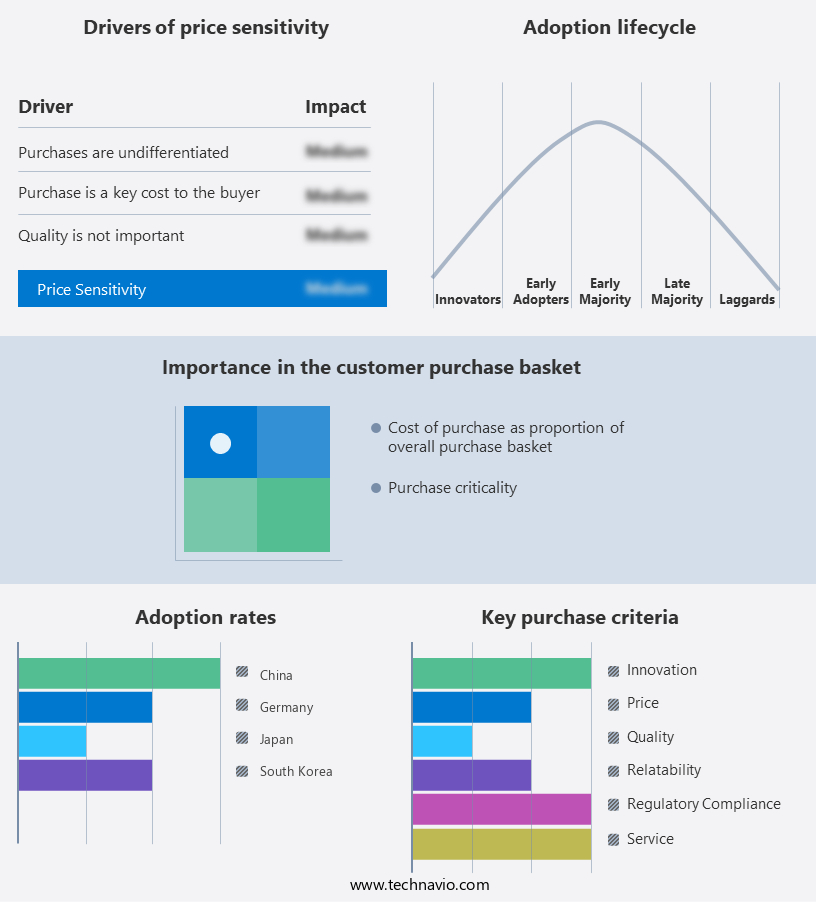
The market forecasting report includes the adoption lifecycle of the market, covering from the innovator's stage to the laggard's stage. It focuses on adoption rates in different regions based on penetration. Furthermore, the report also includes key purchase criteria and drivers of price sensitivity to help companies evaluate and develop their market growth analysis strategies.
Customer Landscape
Key Companies & Market Insights
Companies are implementing various strategies, such as strategic alliances, partnerships, mergers and acquisitions, geographical expansion, and product/service launches, to enhance their presence in the market.
AT and T - The company offers 5G base station products and solutions such as ?edge computing, 5G connectivity solutions, and network infrastructure.
The market research and growth report includes detailed analyses of the competitive landscape of the market and information about key companies, including:
- Bharti Airtel Ltd.
- CommScope Holding Co. Inc.
- Deutsche Telekom AG
- Faststream Technologies
- GLOBE TELECOM INC.
- Huawei Technologies Co. Ltd.
- JSC Kazakhtelecom
- Marvell Technology Inc.
- Murata Manufacturing Co. Ltd.
- NEC Corp.
- Nokia Corp.
- Qorvo Inc.
- Rakuten Group Inc.
- Reliance Industries Ltd.
- Samsung Electronics Co. Ltd.
- T Mobile US Inc.
- Telefonaktiebolaget LM Ericsson
- Vodafone Group Plc
- WiSig Networks Pvt. Ltd.
- ZTE Corp.
Qualitative and quantitative analysis of companies has been conducted to help clients understand the wider business environment as well as the strengths and weaknesses of key market players. Data is qualitatively analyzed to categorize companies as pure play, category-focused, industry-focused, and diversified; it is quantitatively analyzed to categorize companies as dominant, leading, strong, tentative, and weak.
Research Analyst Overview
The market is witnessing significant growth due to the increasing demand for high-speed network connectivity. With the rise in smartphone ownership and the adoption of advanced technologies such as augmented reality (AR) and virtual reality (VR), user satisfaction is at an all-time high. The low latency offered by 5G networks is essential for data-intensive services like industrial internet, smart grid, autonomous driving, and robotic surgeries. Public safety, smart cities, and next-generation activities also require high-speed data transmission and low-latency connectivity. The telecommunications industry is investing heavily in 5G infrastructure, including small cells, to enhance coverage and capacity. 5G users are expected to increase significantly in the coming years, leading to a deluge in demand for 5G base stations.
Further, the higher bandwidth and data speeds offered by 5G networks are ideal for mobile internet, IT and telecommunications, and various digital information services. The regulatory protocols for 5G networks are being established, and the installation of 5G base stations is underway. Fiber optic cables and network function virtualization are being used to support the infrastructure costs. The integration of 5G-enabled smart devices, including smartphones, IoT devices, consumer electronics, and industrial IoT, is driving the growth of the market. Edge computing, advanced analytics, connected cars, and various other applications are expected to benefit from the 5G networks' capabilities. The market for 5G base stations is poised for growth as the world transitions from 4G to 5G networks.
|
Market Scope |
|
|
Report Coverage |
Details |
|
Page number |
213 |
|
Base year |
2023 |
|
Historic period |
2018-2022 |
|
Forecast period |
2024-2028 |
|
Growth momentum & CAGR |
Accelerate at a CAGR of 38.81% |
|
Market growth 2024-2028 |
USD 120.98 billion |
|
Market structure |
Concentrated |
|
YoY growth 2023-2024(%) |
66.53 |
|
Regional analysis |
APAC, Europe, North America, Middle East and Africa, and South America |
|
Performing market contribution |
APAC at 83% |
|
Key countries |
China, South Korea, Japan, and Germany |
|
Competitive landscape |
Leading Companies, Market Positioning of Companies, Competitive Strategies, and Industry Risks |
|
Key companies profiled |
AT and T, Bharti Airtel Ltd., CommScope Holding Co. Inc., Deutsche Telekom AG, Faststream Technologies, GLOBE TELECOM INC., Huawei Technologies Co. Ltd., JSC Kazakhtelecom, Marvell Technology Inc., Murata Manufacturing Co. Ltd., NEC Corp., Nokia Corp., Qorvo Inc., Rakuten Group Inc., Reliance Industries Ltd., Samsung Electronics Co. Ltd., T Mobile US Inc., Telefonaktiebolaget LM Ericsson, Vodafone Group Plc, WiSig Networks Pvt. Ltd., and ZTE Corp. |
|
Market dynamics |
Parent market analysis, market growth inducers and obstacles, market forecast, fast-growing and slow-growing segment analysis, COVID-19 impact and recovery analysis and future consumer dynamics, market condition analysis for the forecast period |
|
Customization purview |
If our market report has not included the data that you are looking for, you can reach out to our analysts and get segments customized. |
What are the Key Data Covered in this Market Research and Growth Report?
- CAGR of the market during the forecast period
- Detailed information on factors that will drive the market growth and forecasting between 2024 and 2028
- Precise estimation of the size of the market and its contribution of the market in focus to the parent market
- Accurate predictions about upcoming market growth and trends and changes in consumer behaviour
- Growth of the market across APAC, Europe, North America, Middle East and Africa, and South America
- Thorough analysis of the market's competitive landscape and detailed information about companies
- Comprehensive analysis of factors that will challenge the growth of market companies
We can help! Our analysts can customize this market research report to meet your requirements. Get in touch
 RIA -
RIA - 
