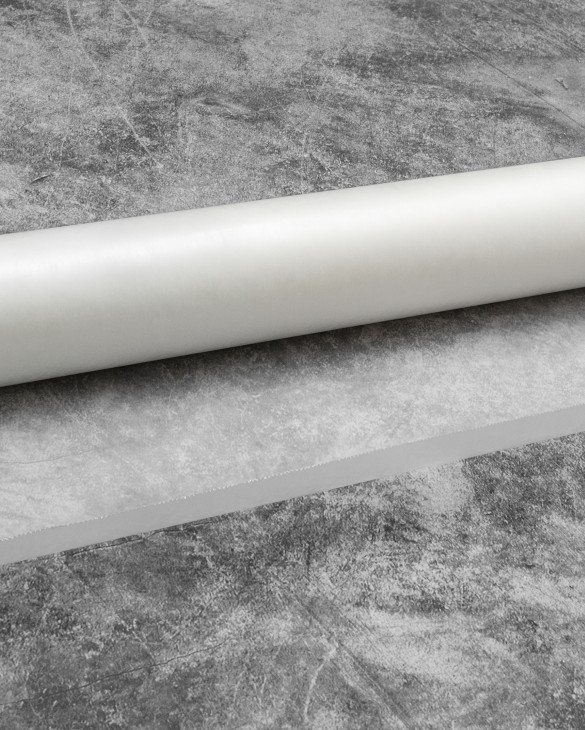
Glassine Paper Market Analysis, Size, and Forecast 2026-2030: APAC (China, Japan, and India), Europe (Germany, France, and Italy), North America (US, Canada, and Mexico), Middle East and Africa (Saudi Arabia, South Africa, and UAE), South America (Brazil, Argentina, and Chile), and Rest of World (ROW)

Glassine Paper Market Analysis, Size, and Forecast 2026-2030:
APAC (China, Japan, and India), Europe (Germany, France, and Italy), North America (US, Canada, and Mexico), Middle East and Africa (Saudi Arabia, South Africa, and UAE), South America (Brazil, Argentina, and Chile), and Rest of World (ROW)

Published: Oct 2026 305 Pages SKU: IRTNTR81839

Market Overview at a Glance

$533 Mn
Market Opportunity
4.3%
CAGR 2025 - 2030
44.7%
APAC Growth
$1.02 B
Opaque glassine paper segment 2024

Glassine Paper Market Size 2026-2030

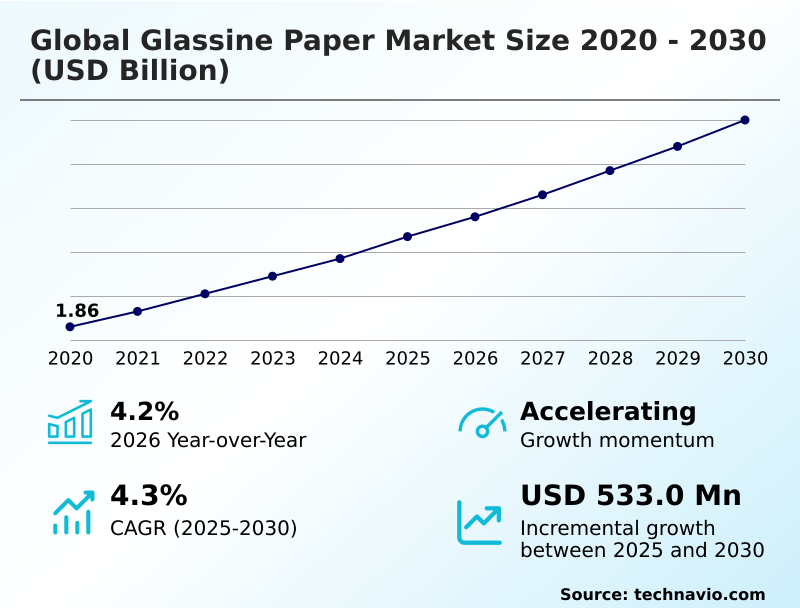
The glassine paper market size is valued to increase by USD 533 million, at a CAGR of 4.3% from 2025 to 2030. Escalating demand for sustainable pressure sensitive labels will drive the glassine paper market.

Major Market Trends & Insights

  • APAC dominated the market and accounted for a 44.7% growth during the forecast period.
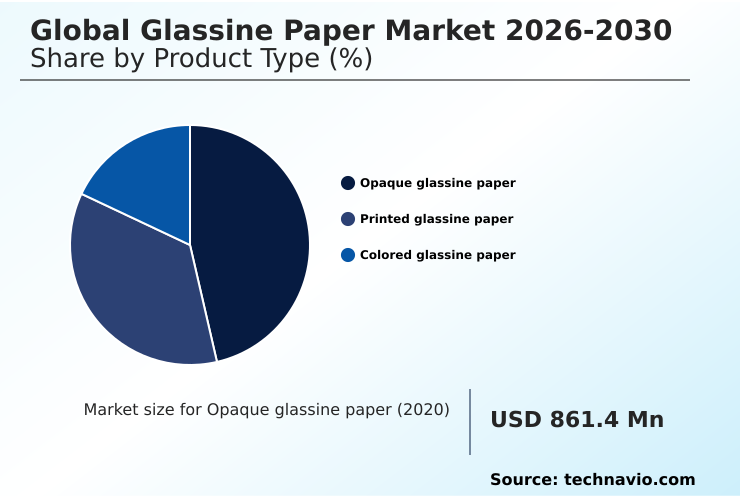
  • By Product Type - Opaque glassine paper segment was valued at USD 1.02 billion in 2024
  • By Application - Packaging and wrapping segment accounted for the largest market revenue share in 2024

Market Size & Forecast

  • Market Opportunities: USD 941.4 million
  • Market Future Opportunities: USD 533 million
  • CAGR from 2025 to 2030 : 4.3%

Market Summary

  • The Glassine Paper Market demonstrates robust expansion driven by the critical need for sustainable high-density barrier materials across modern automated supply chains. As multinational logistics hubs accelerate processing speeds the demand for pressure-sensitive label constructions utilizing reliable release backing materials has intensified.
  • The rigorous supercalendering process aligns cellulose fibers to create a dense substrate capable of withstanding extreme mechanical tension during rotary die-cutting. For example distribution centers implementing these optimized release liners experience a 25% reduction in web breaks compared to standard kraft alternatives significantly elevating overall throughput.
  • This operational efficiency is primarily propelled by the phase-out of non-recyclable polymer films which forces consumer goods brands to adopt closed-loop circular packaging. Conversely the market faces structural constraints due to escalating mandates regarding sustainable virgin pulp procurement. The requirement for meticulous geolocation tracking of timber harvests limits supply chain agility and concentrates merchant pulp sourcing.

What will be the Size of the Glassine Paper Market during the forecast period?
Get Key Insights on Market Forecast (PDF) Get Free Sample

How is the Glassine Paper Market Segmented?

The glassine paper industry research report provides comprehensive data (region-wise segment analysis), with forecasts and estimates in "USD million" for the period 2026-2030, as well as historical data from 2020-2024 for the following segments.

  • Product type
    • Opaque glassine paper
    • Printed glassine paper
    • Colored glassine paper
  • Application
    • Packaging and wrapping
    • Release liners
    • Interleaving paper
    • Envelopes and windows
  • Type
    • In between 40 to 60 GSM
    • Below 40 GSM
    • Above 60 GSM
  • Geography
    • APAC
      • China
      • Japan
      • India
      • South Korea
      • Thailand
      • Taiwan
    • Europe
      • Germany
      • France
      • Italy
      • UK
      • Spain
      • The Netherlands
    • North America
      • US
      • Canada
      • Mexico
    • Middle East and Africa
      • Saudi Arabia
      • South Africa
      • UAE
      • Egypt
      • Turkey
    • South America
      • Brazil
      • Argentina
      • Chile

By Product Type Insights

The opaque glassine paper segment is estimated to witness significant growth during the forecast period.

Opaque glassine paper functions as a critical high-barrier packaging material engineered specifically for privacy-sensitive enclosure applications. By integrating mineral opacifying agents during the stock preparation phase, manufacturers achieve an effective visual barrier without compromising dimensional stability or barrier properties.

This mechanical formulation maintains inherent lipid penetration resistance while providing structural resistance to curl. The integration of this cellulosic substrate improves automated packaging line error detection by 15% compared to translucent alternatives.

Operations utilizing opaque formulations for confidential document interleaving report a 20% improvement in processing efficiency due to superior print contrast.

As regulatory frameworks increasingly mandate secure enclosures, this mono-material packaging solution replaces plastic-laminated foil barriers, delivering robust containment while ensuring complete compatibility with existing recovery systems.
Get Free Sample

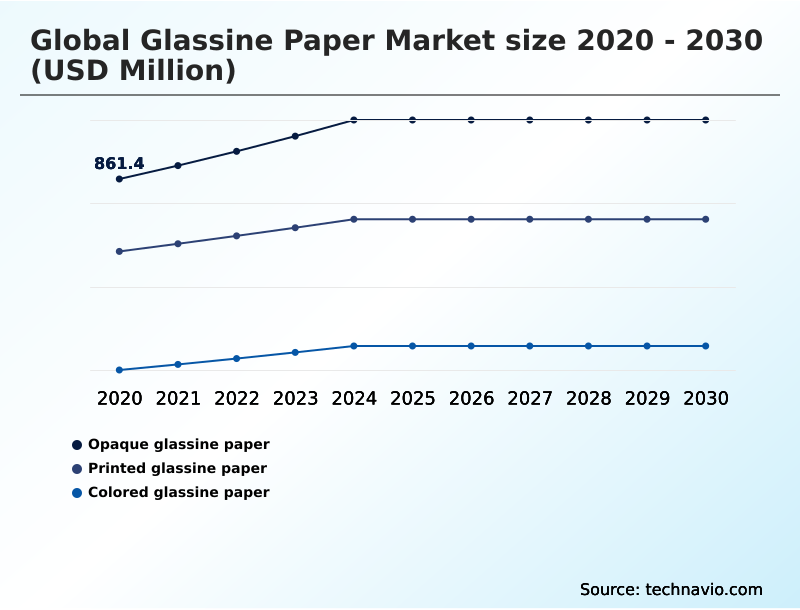
The Opaque glassine paper segment was valued at USD 1.02 billion in 2024 and showed a gradual increase during the forecast period.
Get Free Sample

Regional Analysis

APAC is estimated to contribute 44.7% to the growth of the global market during the forecast period.Technavio’s analysts have elaborately explained the regional trends and drivers that shape the market during the forecast period.
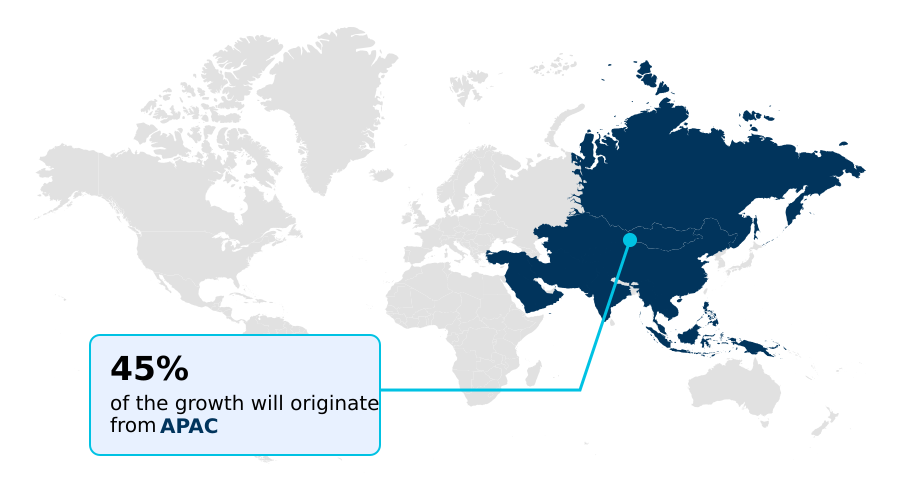
See How Glassine Paper Market Demand is Rising in APAC Get Free Sample

The geographic landscape reveals distinct structural differences between APAC and Europe regarding industrial adoption and mechanical material recovery. APAC functions as the dominant manufacturing hub for cleanroom-grade papers driving massive consumption of release liners for cleanroom manufacturing environments.

Facilities in APAC have expanded automated labeling lines achieving a 28% higher throughput efficiency compared to conventional systems. In contrast Europe prioritizes aggressive regulatory compliance and post-industrial waste management.

European converters leveraging circular collection consortia have successfully reduced secondary packaging disposal costs by 30%. Furthermore strict thermal efficiency mandates in Europe compel mills to optimize energy usage achieving a 15% reduction in baseline energy consumption per processed reel.

While APAC focuses on scaling unbleached kraft pulp utilization the European sector excels in enzymatic de-siliconization infrastructure.

Market Dynamics

Our researchers analyzed the data with 2025 as the base year, along with the key drivers, trends, and challenges. A holistic analysis of drivers will help companies refine their marketing strategies to gain a competitive advantage.

  • The operational transition toward sustainable barrier materials necessitates rigorous substrate engineering to meet the exacting standards of high-performance pressure-sensitive labeling across global logistics and retail networks. As international environmental authorities enforce strict prohibitions on synthetic chemicals food processing entities actively accelerate fluorinated barrier treatment substitution.
  • By utilizing pure mechanically refined cellulose structures manufacturers achieve inherent lipid resistance without introducing toxic additives seamlessly supporting corporate decarbonization targets. This material transition is deeply interconnected with closed loop circular packaging adoption wherein major label printers and waste management enterprises collaborate to eliminate historical disposal bottlenecks. Historically the presence of cross-linked silicone chemistry complicated municipal recycling efforts.
  • However the implementation of dedicated silicone coated backing paper recovery programs has revolutionized post-industrial waste management allowing secondary fibers to be repurposed into specialized building insulation and industrial cellulose products. Facilities participating in these structured recovery ecosystems report a 40% improvement in landfill diversion metrics compared to regions relying on conventional disposal pathways.
  • Simultaneously the industry continues to prioritize lightweight low-caliper formulation development to satisfy converter demands for extended reel lengths. By compressing cellulose fibers into thinner cross-sections paper mills optimize automated dispensing intervals significantly reducing freight weight and minimizing machine changeover frequencies.
  • This strategic dimensional optimization directly enhances supply chain efficiency empowering multinational brand owners to maintain uninterrupted high-volume packaging workflows while satisfying tightening environmental compliance mandates.
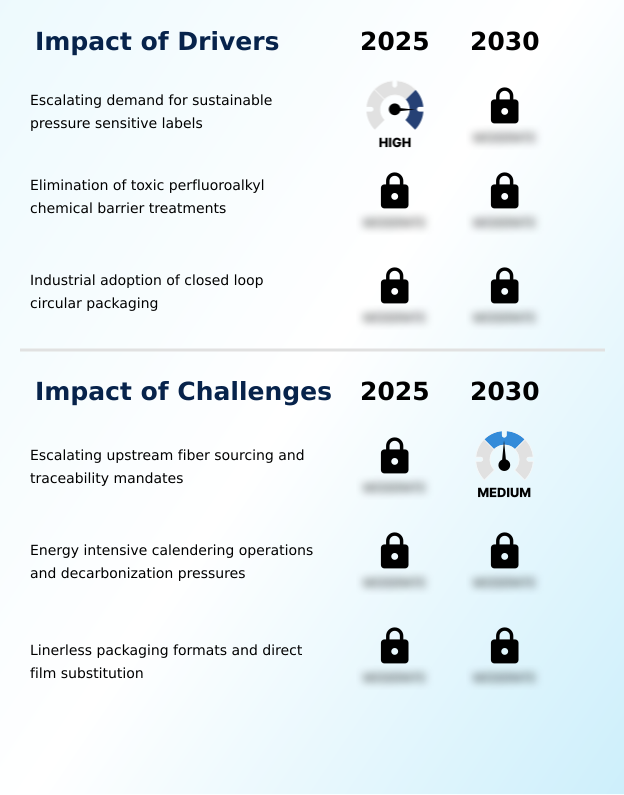
What are the key market drivers leading to the rise in the adoption of Glassine Paper Industry?

  • The escalating demand for sustainable pressure-sensitive labels fundamentally propels market growth as logistics and retail supply chains require high-performance release liners that ensure precise automated application.

  • The stringent enforcement of environmental prohibitions on synthetic fluorochemicals acts as the primary catalyst driving the extensive integration of mechanical fiber hydration within food-contact applications.
  • Regulatory agencies revoking approvals for perfluoroalkyl substances compel packaging converters to achieve grease resistance through intense deflaker refining and mechanical fiber morphology alteration rather than chemical additives.
  • Because this high-pressure compaction effectively collapses the cellulose lumen the resulting material natively blocks lipid penetration without compromising repulpability. Food conglomerates implementing these fluoropolymer-free barrier coatings have realized a 30% decrease in environmental compliance auditing time.
  • Additionally replacing conventional poly-coated papers with pure mechanical barrier substrates has reduced secondary processing delays by 18% establishing entirely non-toxic compostable packaging supply chains.

What are the market trends shaping the Glassine Paper Industry?

  • Substrate downgauging and high-yield calendering advances represent a critical market trend optimizing reel capacities for automated packaging facilities. These engineering improvements allow manufacturers to reduce nominal basis weights without compromising tensile integrity or caliper uniformity.

  • The commercial acceleration of surface functionalization represents a transformative trend reshaping barrier packaging capabilities across the retail sector. Consumer packaged goods manufacturers are systematically replacing poly-laminated papers with functionalized substrates treated with advanced biopolymer topcoats.
  • This engineering shift occurs because regulatory pressures compel brands to eliminate synthetic window films driving the adoption of fully recyclable alternatives compatible with standard hydrapulping systems and curbside paper recycling. Consequently facilities utilizing aqueous dispersion coatings report a 25% reduction in municipal sorting errors compared to legacy petrochemical laminates.
  • Furthermore integrating these optimized barrier substrates has enhanced form-fill-seal efficiency yielding a 20% improvement in heat-sealing speed parameters. The utilization of optical character recognition scanners on these transparent display windows ensures flawless automated logistics tracking.

What challenges does the Glassine Paper Industry face during its growth?

  • Escalating upstream fiber sourcing and stringent traceability mandates present a significant challenge restricting raw material availability and increasing operational costs for specialty paper manufacturers.

  • Escalating exposure to volatile utility expenditures and strict decarbonization targets presents a profound structural limitation for supercalendering operations. Achieving the requisite surface smoothness and sheet density for uniform cross-linked silicone coating consumes massive quantities of electrical power and high-temperature steam.
  • Because legacy paper mills frequently lack integrated energy management software facilities experience severe thermal dissipation and uneven web tension management across wide web formats. When operators prematurely curtail steam application to lower baseline utility consumption the resulting dimensional instability leads to a 25% increase in siliconization failure rates during cold-chain logistics label production.
  • Furthermore converting outdated fossil fuel boiler infrastructure to electrified steam generation requires extensive capital allocations resulting in a 20% escalation in overall processing overhead.

Exclusive Technavio Analysis on Customer Landscape

The glassine paper market forecasting report includes the adoption lifecycle of the market, covering from the innovator’s stage to the laggard’s stage. It focuses on adoption rates in different regions based on penetration. Furthermore, the glassine paper market report also includes key purchase criteria and drivers of price sensitivity to help companies evaluate and develop their market growth analysis strategies.
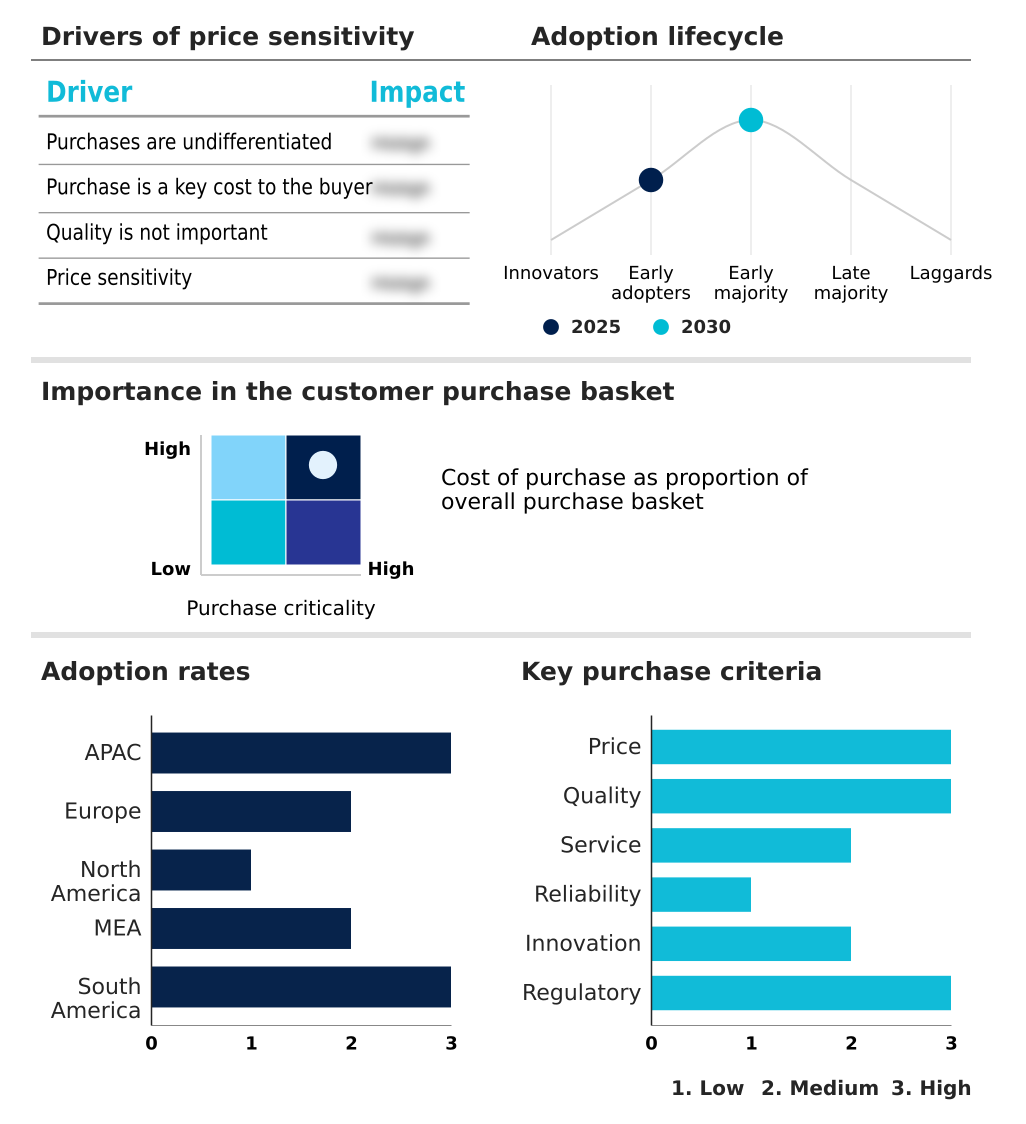
Customer Landscape of Glassine Paper Industry

Competitive Landscape

Companies are implementing various strategies, such as strategic alliances, glassine paper market forecast, partnerships, mergers and acquisitions, geographical expansion, and product/service launches, to enhance their presence in the industry.

Ahlstrom Oyj - The company delivers advanced fiber-based materials specializing in high-performance glassine release papers and supercalendered liners engineered to support sustainable packaging and precision pressure-sensitive adhesive applications globally.

The industry research and growth report includes detailed analyses of the competitive landscape of the market and information about key companies, including:

  • Ahlstrom Oyj
  • Asia Pulp and Paper APP Sinar
  • Billerud AB
  • delfortgroup AG
  • FEDRIGONI Spa
  • Loparex LLC
  • Mativ Holdings Inc.
  • Mitsubishi Paper Mills Ltd.
  • Mondi Plc
  • Nippon Paper Industries Co. Ltd.
  • Nordic Paper AS
  • Oji Holdings Corp.
  • Pakka Ltd.
  • Pixelle Specialty Solutions LLC
  • Prompt Industries Pvt Ltd.
  • Pudumjee Paper Products Ltd
  • Shree Krishna Paper Mills
  • Stora Enso Oyj
  • Twin Rivers Paper Co.
  • UPM Kymmene Corp.

Qualitative and quantitative analysis of companies has been conducted to help clients understand the wider business environment as well as the strengths and weaknesses of key industry players. Data is qualitatively analyzed to categorize companies as pure play, category-focused, industry-focused, and diversified; it is quantitatively analyzed to categorize companies as dominant, leading, strong, tentative, and weak.

Recent Development and News in Glassine paper market

  • In the Paper Products industry the widespread elimination of perfluoroalkyl chemical treatments in food-contact materials directly impacted the Glassine Paper market by accelerating the adoption of high-density cellulose refinement techniques for grease resistance.
  • The expansion of extended producer responsibility mandates for packaging waste forced label converters to establish reverse logistics infrastructure stabilizing Glassine Paper demand by validating the recovery of spent release backing materials.
  • Stringent geolocation tracking requirements under international deforestation regulations disrupted sustainable virgin pulp procurement heavily impacting Glassine Paper supply chains by consolidating sourcing networks and inflating raw material costs by 15%.
  • Advancements in closed-loop process automation optimized supercalendering operations reducing web breaks during thermal transfer printing and driving Glassine Paper basis weight reductions across automated supply chains.

Dive into Technavio’s robust research methodology, blending expert interviews, extensive data synthesis, and validated models for unparalleled Glassine Paper Market insights. See full methodology.

Market Scope
Page number 305
Base year 2025
Historic period 2020-2024
Forecast period 2026-2030
Growth momentum & CAGR Accelerate at a CAGR of 4.3%
Market growth 2026-2030 USD 533.0 million
Market structure Fragmented
YoY growth 2025-2026(%) 4.2%
Key countries China, Japan, India, South Korea, Thailand, Taiwan, Germany, France, Italy, UK, Spain, The Netherlands, US, Canada, Mexico, Saudi Arabia, South Africa, UAE, Egypt, Turkey, Brazil, Argentina and Chile
Competitive landscape Leading Companies, Market Positioning of Companies, Competitive Strategies, and Industry Risks

Request Free Sample

Research Analyst Overview

  • The continuous evolution of the market is fundamentally driven by the structural displacement of petrochemical films in favor of high-density substrates. As enterprise operations transition toward sustainable models the necessity for flawless caliper uniformity during high-speed converting has become paramount to achieve zero-defect manufacturing.
  • Advanced facilities utilizing deflection-compensating rolls have successfully reduced microscopic thickness variations yielding a 35% improvement in die-cutting precision compared to older mechanical techniques. This structural consistency ensures uniform polydimethylsiloxane silicone chemistry cross-linking preventing pinholes while drastically lowering the absorption of costly platinum-cured coatings.
  • From a strategic boardroom perspective integrating basis weight downgauging initiatives allows multinational corporations to optimize freight carbon accounting liabilities. The intensive refining required to produce these ultra-dense sheets delivers unparalleled tensile energy absorption ensuring uninterrupted runnability.

What are the Key Data Covered in this Glassine Paper Market Research and Growth Report?

  • What is the expected growth of the Glassine Paper Market between 2026 and 2030?

    • USD 533 million, at a CAGR of 4.3%

  • What segmentation does the market report cover?

    • The report is segmented by Product Type (Opaque glassine paper, Printed glassine paper, and Colored glassine paper), Application (Packaging and wrapping, Release liners, Interleaving paper, and Envelopes and windows), Type (In between 40 to 60 GSM, Below 40 GSM, and Above 60 GSM) and Geography (APAC, Europe, North America, Middle East and Africa, South America)

  • Which regions are analyzed in the report?

    • APAC, Europe, North America, Middle East and Africa and South America

  • What are the key growth drivers and market challenges?

    • Escalating demand for sustainable pressure sensitive labels, Escalating upstream fiber sourcing and traceability mandates

  • Who are the major players in the Glassine Paper Market?

    • Ahlstrom Oyj, Asia Pulp and Paper APP Sinar, Billerud AB, delfortgroup AG, FEDRIGONI Spa, Loparex LLC, Mativ Holdings Inc., Mitsubishi Paper Mills Ltd., Mondi Plc, Nippon Paper Industries Co. Ltd., Nordic Paper AS, Oji Holdings Corp., Pakka Ltd., Pixelle Specialty Solutions LLC, Prompt Industries Pvt Ltd., Pudumjee Paper Products Ltd, Shree Krishna Paper Mills, Stora Enso Oyj, Twin Rivers Paper Co. and UPM Kymmene Corp.

Market Research Insights

  • The Glassine Paper Market operates as a highly specialized material sector characterized by the rapid deployment of sustainable barrier solutions. Packaging facilities integrating advanced backing materials have improved high-speed automated dispensing efficiency by 22% compared to legacy synthetic films. Furthermore the implementation of reverse logistics programs for post-industrial waste liability management has increased secondary material recovery rates by 35%.
  • This operational shift aligns with strict extended producer responsibility directives reducing landfill compliance costs by 18%. By facilitating an efficient industrial off-take route into existing municipal repulping operations the market addresses critical environmental mandates while optimizing variable-data tracking workflows across complex retail distribution networks.

We can help! Our analysts can customize this glassine paper market research report to meet your requirements.

Get in touch

1. Executive Summary

1.1 Market overview

Executive Summary - Chart on Market Overview
Executive Summary - Data Table on Market Overview
Executive Summary - Chart on Global Market Characteristics
Executive Summary - Chart on Market by Geography
Executive Summary - Chart on Market Segmentation by Product Type
Executive Summary - Chart on Market Segmentation by Application
Executive Summary - Chart on Market Segmentation by Type
Executive Summary - Chart on Incremental Growth
Executive Summary - Data Table on Incremental Growth
Executive Summary - Chart on Company Market Positioning

2. Technavio Analysis

2.1 Analysis of price sensitivity, lifecycle, customer purchase basket, adoption rates, and purchase criteria

2.2 Criticality of inputs and Factors of differentiation

Chart on Overview on criticality of inputs and factors of differentiation

2.3 Factors of disruption

Chart on Overview on factors of disruption

2.4 Impact of drivers and challenges

Chart on Impact of drivers and challenges in 2025 and 2030

3. Market Landscape

3.1 Market ecosystem

Chart on Parent Market
Data Table on - Parent Market

3.2 Market characteristics

Chart on Market characteristics analysis

3.3 Value chain analysis

Chart on Value chain analysis

4. Market Sizing

4.1 Market definition

Data Table on Offerings of companies included in the market definition

4.2 Market segment analysis

Market segments

4.3 Market size 2025

4.4 Market outlook: Forecast for 2025-2030

Chart on Global - Market size and forecast 2025-2030 ($ million)
Data Table on Global - Market size and forecast 2025-2030 ($ million)
Chart on Global Market: Year-over-year growth 2025-2030 (%)
Data Table on Global Market: Year-over-year growth 2025-2030 (%)

5. Historic Market Size

5.1 Global Glassine Paper Market 2020 - 2024

Historic Market Size - Data Table on Global Glassine Paper Market 2020 - 2024 ($ million)

5.2 Product Type segment analysis 2020 - 2024

Historic Market Size - Product Type Segment 2020 - 2024 ($ million)

5.3 Application segment analysis 2020 - 2024

Historic Market Size - Application Segment 2020 - 2024 ($ million)

5.4 Type segment analysis 2020 - 2024

Historic Market Size - Type Segment 2020 - 2024 ($ million)

5.5 Geography segment analysis 2020 - 2024

Historic Market Size - Geography Segment 2020 - 2024 ($ million)

5.6 Country segment analysis 2020 - 2024

Historic Market Size - Country Segment 2020 - 2024 ($ million)

6. Qualitative Analysis

6.1 Impact of AI on Global Glassine Paper Market

6.2 Impact of geopolitical conflicts on Global Glassine Paper Market

7. Five Forces Analysis

7.1 Five forces summary

Five forces analysis - Comparison between 2025 and 2030

7.2 Bargaining power of buyers

Bargaining power of buyers - Impact of key factors 2025 and 2030

7.3 Bargaining power of suppliers

Bargaining power of suppliers - Impact of key factors in 2025 and 2030

7.4 Threat of new entrants

Threat of new entrants - Impact of key factors in 2025 and 2030

7.5 Threat of substitutes

Threat of substitutes - Impact of key factors in 2025 and 2030

7.6 Threat of rivalry

Threat of rivalry - Impact of key factors in 2025 and 2030

7.7 Market condition

Chart on Market condition - Five forces 2025 and 2030

8. Market Segmentation by Product Type

8.1 Market segments

Chart on Product Type - Market share 2025-2030 (%)
Data Table on Product Type - Market share 2025-2030 (%)

8.2 Comparison by Product Type

Chart on Comparison by Product Type
Data Table on Comparison by Product Type

8.3 Opaque glassine paper - Market size and forecast 2025-2030

Chart on Opaque glassine paper - Market size and forecast 2025-2030 ($ million)
Data Table on Opaque glassine paper - Market size and forecast 2025-2030 ($ million)
Chart on Opaque glassine paper - Year-over-year growth 2025-2030 (%)
Data Table on Opaque glassine paper - Year-over-year growth 2025-2030 (%)

8.4 Printed glassine paper - Market size and forecast 2025-2030

Chart on Printed glassine paper - Market size and forecast 2025-2030 ($ million)
Data Table on Printed glassine paper - Market size and forecast 2025-2030 ($ million)
Chart on Printed glassine paper - Year-over-year growth 2025-2030 (%)
Data Table on Printed glassine paper - Year-over-year growth 2025-2030 (%)

8.5 Colored glassine paper - Market size and forecast 2025-2030

Chart on Colored glassine paper - Market size and forecast 2025-2030 ($ million)
Data Table on Colored glassine paper - Market size and forecast 2025-2030 ($ million)
Chart on Colored glassine paper - Year-over-year growth 2025-2030 (%)
Data Table on Colored glassine paper - Year-over-year growth 2025-2030 (%)

8.6 Market opportunity by Product Type

Market opportunity by Product Type ($ million)
Data Table on Market opportunity by Product Type ($ million)

9. Market Segmentation by Application

9.1 Market segments

Chart on Application - Market share 2025-2030 (%)
Data Table on Application - Market share 2025-2030 (%)

9.2 Comparison by Application

Chart on Comparison by Application
Data Table on Comparison by Application

9.3 Packaging and wrapping - Market size and forecast 2025-2030

Chart on Packaging and wrapping - Market size and forecast 2025-2030 ($ million)
Data Table on Packaging and wrapping - Market size and forecast 2025-2030 ($ million)
Chart on Packaging and wrapping - Year-over-year growth 2025-2030 (%)
Data Table on Packaging and wrapping - Year-over-year growth 2025-2030 (%)

9.4 Release liners - Market size and forecast 2025-2030

Chart on Release liners - Market size and forecast 2025-2030 ($ million)
Data Table on Release liners - Market size and forecast 2025-2030 ($ million)
Chart on Release liners - Year-over-year growth 2025-2030 (%)
Data Table on Release liners - Year-over-year growth 2025-2030 (%)

9.5 Interleaving paper - Market size and forecast 2025-2030

Chart on Interleaving paper - Market size and forecast 2025-2030 ($ million)
Data Table on Interleaving paper - Market size and forecast 2025-2030 ($ million)
Chart on Interleaving paper - Year-over-year growth 2025-2030 (%)
Data Table on Interleaving paper - Year-over-year growth 2025-2030 (%)

9.6 Envelopes and windows - Market size and forecast 2025-2030

Chart on Envelopes and windows - Market size and forecast 2025-2030 ($ million)
Data Table on Envelopes and windows - Market size and forecast 2025-2030 ($ million)
Chart on Envelopes and windows - Year-over-year growth 2025-2030 (%)
Data Table on Envelopes and windows - Year-over-year growth 2025-2030 (%)

9.7 Market opportunity by Application

Market opportunity by Application ($ million)
Data Table on Market opportunity by Application ($ million)

10. Market Segmentation by Type

10.1 Market segments

Chart on Type - Market share 2025-2030 (%)
Data Table on Type - Market share 2025-2030 (%)

10.2 Comparison by Type

Chart on Comparison by Type
Data Table on Comparison by Type

10.3 In between 40 to 60 GSM - Market size and forecast 2025-2030

Chart on In between 40 to 60 GSM - Market size and forecast 2025-2030 ($ million)
Data Table on In between 40 to 60 GSM - Market size and forecast 2025-2030 ($ million)
Chart on In between 40 to 60 GSM - Year-over-year growth 2025-2030 (%)
Data Table on In between 40 to 60 GSM - Year-over-year growth 2025-2030 (%)

10.4 Below 40 GSM - Market size and forecast 2025-2030

Chart on Below 40 GSM - Market size and forecast 2025-2030 ($ million)
Data Table on Below 40 GSM - Market size and forecast 2025-2030 ($ million)
Chart on Below 40 GSM - Year-over-year growth 2025-2030 (%)
Data Table on Below 40 GSM - Year-over-year growth 2025-2030 (%)

10.5 Above 60 GSM - Market size and forecast 2025-2030

Chart on Above 60 GSM - Market size and forecast 2025-2030 ($ million)
Data Table on Above 60 GSM - Market size and forecast 2025-2030 ($ million)
Chart on Above 60 GSM - Year-over-year growth 2025-2030 (%)
Data Table on Above 60 GSM - Year-over-year growth 2025-2030 (%)

10.6 Market opportunity by Type

Market opportunity by Type ($ million)
Data Table on Market opportunity by Type ($ million)

11. Customer Landscape

11.1 Customer landscape overview

Analysis of price sensitivity, lifecycle, customer purchase basket, adoption rates, and purchase criteria

12. Geographic Landscape

12.1 Geographic segmentation

Chart on Market share by geography 2025-2030 (%)
Data Table on Market share by geography 2025-2030 (%)

12.2 Geographic comparison

Chart on Geographic comparison
Data Table on Geographic comparison

12.3 APAC - Market size and forecast 2025-2030

Chart on APAC - Market size and forecast 2025-2030 ($ million)
Data Table on APAC - Market size and forecast 2025-2030 ($ million)
Chart on APAC - Year-over-year growth 2025-2030 (%)
Data Table on APAC - Year-over-year growth 2025-2030 (%)
Chart on Regional Comparison - APAC
Data Table on Regional Comparison - APAC

12.3.1 China - Market size and forecast 2025-2030

Chart on China - Market size and forecast 2025-2030 ($ million)
Data Table on China - Market size and forecast 2025-2030 ($ million)
Chart on China - Year-over-year growth 2025-2030 (%)
Data Table on China - Year-over-year growth 2025-2030 (%)

12.3.2 Japan - Market size and forecast 2025-2030

Chart on Japan - Market size and forecast 2025-2030 ($ million)
Data Table on Japan - Market size and forecast 2025-2030 ($ million)
Chart on Japan - Year-over-year growth 2025-2030 (%)
Data Table on Japan - Year-over-year growth 2025-2030 (%)

12.3.3 India - Market size and forecast 2025-2030

Chart on India - Market size and forecast 2025-2030 ($ million)
Data Table on India - Market size and forecast 2025-2030 ($ million)
Chart on India - Year-over-year growth 2025-2030 (%)
Data Table on India - Year-over-year growth 2025-2030 (%)

12.3.4 South Korea - Market size and forecast 2025-2030

Chart on South Korea - Market size and forecast 2025-2030 ($ million)
Data Table on South Korea - Market size and forecast 2025-2030 ($ million)
Chart on South Korea - Year-over-year growth 2025-2030 (%)
Data Table on South Korea - Year-over-year growth 2025-2030 (%)

12.3.5 Thailand - Market size and forecast 2025-2030

Chart on Thailand - Market size and forecast 2025-2030 ($ million)
Data Table on Thailand - Market size and forecast 2025-2030 ($ million)
Chart on Thailand - Year-over-year growth 2025-2030 (%)
Data Table on Thailand - Year-over-year growth 2025-2030 (%)

12.3.6 Taiwan - Market size and forecast 2025-2030

Chart on Taiwan - Market size and forecast 2025-2030 ($ million)
Data Table on Taiwan - Market size and forecast 2025-2030 ($ million)
Chart on Taiwan - Year-over-year growth 2025-2030 (%)
Data Table on Taiwan - Year-over-year growth 2025-2030 (%)

12.4 Europe - Market size and forecast 2025-2030

Chart on Europe - Market size and forecast 2025-2030 ($ million)
Data Table on Europe - Market size and forecast 2025-2030 ($ million)
Chart on Europe - Year-over-year growth 2025-2030 (%)
Data Table on Europe - Year-over-year growth 2025-2030 (%)
Chart on Regional Comparison - Europe
Data Table on Regional Comparison - Europe

12.4.1 Germany - Market size and forecast 2025-2030

Chart on Germany - Market size and forecast 2025-2030 ($ million)
Data Table on Germany - Market size and forecast 2025-2030 ($ million)
Chart on Germany - Year-over-year growth 2025-2030 (%)
Data Table on Germany - Year-over-year growth 2025-2030 (%)

12.4.2 France - Market size and forecast 2025-2030

Chart on France - Market size and forecast 2025-2030 ($ million)
Data Table on France - Market size and forecast 2025-2030 ($ million)
Chart on France - Year-over-year growth 2025-2030 (%)
Data Table on France - Year-over-year growth 2025-2030 (%)

12.4.3 Italy - Market size and forecast 2025-2030

Chart on Italy - Market size and forecast 2025-2030 ($ million)
Data Table on Italy - Market size and forecast 2025-2030 ($ million)
Chart on Italy - Year-over-year growth 2025-2030 (%)
Data Table on Italy - Year-over-year growth 2025-2030 (%)

12.4.4 UK - Market size and forecast 2025-2030

Chart on UK - Market size and forecast 2025-2030 ($ million)
Data Table on UK - Market size and forecast 2025-2030 ($ million)
Chart on UK - Year-over-year growth 2025-2030 (%)
Data Table on UK - Year-over-year growth 2025-2030 (%)

12.4.5 Spain - Market size and forecast 2025-2030

Chart on Spain - Market size and forecast 2025-2030 ($ million)
Data Table on Spain - Market size and forecast 2025-2030 ($ million)
Chart on Spain - Year-over-year growth 2025-2030 (%)
Data Table on Spain - Year-over-year growth 2025-2030 (%)

12.4.6 The Netherlands - Market size and forecast 2025-2030

Chart on The Netherlands - Market size and forecast 2025-2030 ($ million)
Data Table on The Netherlands - Market size and forecast 2025-2030 ($ million)
Chart on The Netherlands - Year-over-year growth 2025-2030 (%)
Data Table on The Netherlands - Year-over-year growth 2025-2030 (%)

12.5 North America - Market size and forecast 2025-2030

Chart on North America - Market size and forecast 2025-2030 ($ million)
Data Table on North America - Market size and forecast 2025-2030 ($ million)
Chart on North America - Year-over-year growth 2025-2030 (%)
Data Table on North America - Year-over-year growth 2025-2030 (%)
Chart on Regional Comparison - North America
Data Table on Regional Comparison - North America

12.5.1 US - Market size and forecast 2025-2030

Chart on US - Market size and forecast 2025-2030 ($ million)
Data Table on US - Market size and forecast 2025-2030 ($ million)
Chart on US - Year-over-year growth 2025-2030 (%)
Data Table on US - Year-over-year growth 2025-2030 (%)

12.5.2 Canada - Market size and forecast 2025-2030

Chart on Canada - Market size and forecast 2025-2030 ($ million)
Data Table on Canada - Market size and forecast 2025-2030 ($ million)
Chart on Canada - Year-over-year growth 2025-2030 (%)
Data Table on Canada - Year-over-year growth 2025-2030 (%)

12.5.3 Mexico - Market size and forecast 2025-2030

Chart on Mexico - Market size and forecast 2025-2030 ($ million)
Data Table on Mexico - Market size and forecast 2025-2030 ($ million)
Chart on Mexico - Year-over-year growth 2025-2030 (%)
Data Table on Mexico - Year-over-year growth 2025-2030 (%)

12.6 Middle East and Africa - Market size and forecast 2025-2030

Chart on Middle East and Africa - Market size and forecast 2025-2030 ($ million)
Data Table on Middle East and Africa - Market size and forecast 2025-2030 ($ million)
Chart on Middle East and Africa - Year-over-year growth 2025-2030 (%)
Data Table on Middle East and Africa - Year-over-year growth 2025-2030 (%)
Chart on Regional Comparison - Middle East and Africa
Data Table on Regional Comparison - Middle East and Africa

12.6.1 Saudi Arabia - Market size and forecast 2025-2030

Chart on Saudi Arabia - Market size and forecast 2025-2030 ($ million)
Data Table on Saudi Arabia - Market size and forecast 2025-2030 ($ million)
Chart on Saudi Arabia - Year-over-year growth 2025-2030 (%)
Data Table on Saudi Arabia - Year-over-year growth 2025-2030 (%)

12.6.2 South Africa - Market size and forecast 2025-2030

Chart on South Africa - Market size and forecast 2025-2030 ($ million)
Data Table on South Africa - Market size and forecast 2025-2030 ($ million)
Chart on South Africa - Year-over-year growth 2025-2030 (%)
Data Table on South Africa - Year-over-year growth 2025-2030 (%)

12.6.3 UAE - Market size and forecast 2025-2030

Chart on UAE - Market size and forecast 2025-2030 ($ million)
Data Table on UAE - Market size and forecast 2025-2030 ($ million)
Chart on UAE - Year-over-year growth 2025-2030 (%)
Data Table on UAE - Year-over-year growth 2025-2030 (%)

12.6.4 Egypt - Market size and forecast 2025-2030

Chart on Egypt - Market size and forecast 2025-2030 ($ million)
Data Table on Egypt - Market size and forecast 2025-2030 ($ million)
Chart on Egypt - Year-over-year growth 2025-2030 (%)
Data Table on Egypt - Year-over-year growth 2025-2030 (%)

12.6.5 Turkey - Market size and forecast 2025-2030

Chart on Turkey - Market size and forecast 2025-2030 ($ million)
Data Table on Turkey - Market size and forecast 2025-2030 ($ million)
Chart on Turkey - Year-over-year growth 2025-2030 (%)
Data Table on Turkey - Year-over-year growth 2025-2030 (%)

12.7 South America - Market size and forecast 2025-2030

Chart on South America - Market size and forecast 2025-2030 ($ million)
Data Table on South America - Market size and forecast 2025-2030 ($ million)
Chart on South America - Year-over-year growth 2025-2030 (%)
Data Table on South America - Year-over-year growth 2025-2030 (%)
Chart on Regional Comparison - South America
Data Table on Regional Comparison - South America

12.7.1 Brazil - Market size and forecast 2025-2030

Chart on Brazil - Market size and forecast 2025-2030 ($ million)
Data Table on Brazil - Market size and forecast 2025-2030 ($ million)
Chart on Brazil - Year-over-year growth 2025-2030 (%)
Data Table on Brazil - Year-over-year growth 2025-2030 (%)

12.7.2 Argentina - Market size and forecast 2025-2030

Chart on Argentina - Market size and forecast 2025-2030 ($ million)
Data Table on Argentina - Market size and forecast 2025-2030 ($ million)
Chart on Argentina - Year-over-year growth 2025-2030 (%)
Data Table on Argentina - Year-over-year growth 2025-2030 (%)

12.7.3 Chile - Market size and forecast 2025-2030

Chart on Chile - Market size and forecast 2025-2030 ($ million)
Data Table on Chile - Market size and forecast 2025-2030 ($ million)
Chart on Chile - Year-over-year growth 2025-2030 (%)
Data Table on Chile - Year-over-year growth 2025-2030 (%)

12.8 Market opportunity by geography

Market opportunity by geography ($ million)
Data Tables on Market opportunity by geography ($ million)

13. Drivers, Challenges, and Opportunity

13.1 Market drivers

Escalating demand for sustainable pressure sensitive labels
Elimination of toxic perfluoroalkyl chemical barrier treatments
Industrial adoption of closed loop circular packaging

13.2 Market challenges

Escalating upstream fiber sourcing and traceability mandates
Energy intensive calendering operations and decarbonization pressures
Linerless packaging formats and direct film substitution

13.3 Impact of drivers and challenges

Impact of drivers and challenges in 2025 and 2030

13.4 Market opportunities

Substrate downgauging and high yield calendering advances
Functional barrier coatings displacing synthetic plastic films
Reverse logistics infrastructure for release liner circularity

14. Competitive Landscape

14.1 Overview

14.2

Overview on criticality of inputs and factors of differentiation

14.3 Landscape disruption

Overview on factors of disruption

14.4 Industry risks

Impact of key risks on business

15. Competitive Analysis

15.1 Companies profiled

Companies covered

15.2 Company ranking index

15.3 Market positioning of companies

Matrix on companies position and classification

15.4 Ahlstrom Oyj

Ahlstrom Oyj - Overview
Ahlstrom Oyj - Product / Service
Ahlstrom Oyj - Key offerings
SWOT

15.5 Asia Pulp and Paper APP Sinar

Asia Pulp and Paper APP Sinar - Overview
Asia Pulp and Paper APP Sinar - Product / Service
Asia Pulp and Paper APP Sinar - Key offerings
SWOT

15.6 Billerud AB

Billerud AB - Overview
Billerud AB - Business segments
Billerud AB - Key offerings
Billerud AB - Segment focus
SWOT

15.7 delfortgroup AG

delfortgroup AG - Overview
delfortgroup AG - Product / Service
delfortgroup AG - Key offerings
SWOT

15.8 FEDRIGONI Spa

FEDRIGONI Spa - Overview
FEDRIGONI Spa - Product / Service
FEDRIGONI Spa - Key offerings
SWOT

15.9 Mativ Holdings Inc.

Mativ Holdings Inc. - Overview
Mativ Holdings Inc. - Business segments
Mativ Holdings Inc. - Key offerings
Mativ Holdings Inc. - Segment focus
SWOT

15.10 Mitsubishi Paper Mills Ltd.

Mitsubishi Paper Mills Ltd. - Overview
Mitsubishi Paper Mills Ltd. - Product / Service
Mitsubishi Paper Mills Ltd. - Key offerings
SWOT

15.11 Mondi Plc

Mondi Plc - Overview
Mondi Plc - Business segments
Mondi Plc - Key news
Mondi Plc - Key offerings
Mondi Plc - Segment focus
SWOT

15.12 Nordic Paper AS

Nordic Paper AS - Overview
Nordic Paper AS - Business segments
Nordic Paper AS - Key offerings
Nordic Paper AS - Segment focus
SWOT

15.13 Oji Holdings Corp.

Oji Holdings Corp. - Overview
Oji Holdings Corp. - Business segments
Oji Holdings Corp. - Key offerings
Oji Holdings Corp. - Segment focus
SWOT

15.14 Pakka Ltd.

Pakka Ltd. - Overview
Pakka Ltd. - Product / Service
Pakka Ltd. - Key offerings
SWOT

15.15 Shree Krishna Paper Mills

Shree Krishna Paper Mills - Overview
Shree Krishna Paper Mills - Product / Service
Shree Krishna Paper Mills - Key offerings
SWOT

15.16 Stora Enso Oyj

Stora Enso Oyj - Overview
Stora Enso Oyj - Business segments
Stora Enso Oyj - Key news
Stora Enso Oyj - Key offerings
Stora Enso Oyj - Segment focus
SWOT

15.17 Twin Rivers Paper Co.

Twin Rivers Paper Co. - Overview
Twin Rivers Paper Co. - Product / Service
Twin Rivers Paper Co. - Key offerings
SWOT

15.18 UPM Kymmene Corp.

UPM Kymmene Corp. - Overview
UPM Kymmene Corp. - Business segments
UPM Kymmene Corp. - Key offerings
UPM Kymmene Corp. - Segment focus
SWOT

16. Appendix

16.1 Scope of the report

Market definition
Objectives
Notes and caveats

16.2 Inclusions and exclusions checklist

Inclusions checklist
Exclusions checklist

16.3 Currency conversion rates for US$

16.4 Research methodology

16.5 Data procurement

Information sources

16.6 Data validation

16.7 Validation techniques employed for market sizing

16.8 Data synthesis

16.9 360 degree market analysis

16.10 List of abbreviations

Research Methodology

Technavio presents a detailed picture of the market by way of study, synthesis, and summation of data from multiple sources. The analysts have presented the various facets of the market with a particular focus on identifying the key industry influencers. The data thus presented is comprehensive, reliable, and the result of extensive research, both primary and secondary.

INFORMATION SOURCES

Primary sources

  • Manufacturers and suppliers
  • Channel partners
  • Industry experts
  • Strategic decision makers

Secondary sources

  • Industry journals and periodicals
  • Government data
  • Financial reports of key industry players
  • Historical data
  • Press releases

DATA ANALYSIS

Data Synthesis

  • Collation of data
  • Estimation of key figures
  • Analysis of derived insights

Data Validation

  • Triangulation with data models
  • Reference against proprietary databases
  • Corroboration with industry experts

REPORT WRITING

Qualitative

  • Market drivers
  • Market challenges
  • Market trends
  • Five forces analysis

Quantitative

  • Market size and forecast
  • Market segmentation
  • Geographical insights
  • Competitive landscape

Interested in this report?

Get your sample now to see our research methodology and insights!

Download Now

Frequently Asked Questions

Glassine Paper market growth will increase by USD 533.0 million during 2026-2030.

The Glassine Paper market is expected to grow at a CAGR of 4.3% during 2026-2030.

Glassine Paper market is segmented by Product type (Opaque glassine paper, Printed glassine paper, Colored glassine paper) Application (Packaging and wrapping, Release liners, Interleaving paper, Envelopes and windows) Type (In between 40 to 60 GSM, Below 40 GSM, Above 60 GSM)

Ahlstrom Oyj, Asia Pulp and Paper APP Sinar, Billerud AB, delfortgroup AG, FEDRIGONI Spa, Loparex LLC, Mativ Holdings Inc., Mitsubishi Paper Mills Ltd., Mondi Plc, Nippon Paper Industries Co. Ltd., Nordic Paper AS, Oji Holdings Corp., Pakka Ltd., Pixelle Specialty Solutions LLC, Prompt Industries Pvt Ltd., Pudumjee Paper Products Ltd, Shree Krishna Paper Mills, Stora Enso Oyj, Twin Rivers Paper Co., UPM Kymmene Corp. are a few of the key vendors in the Glassine Paper market.

APAC will register the highest growth rate of 44.7% among the other regions. Therefore, the Glassine Paper market in APAC is expected to garner significant business opportunities for the vendors during the forecast period.

China, Japan, India, South Korea, Thailand, Taiwan, Germany, France, Italy, UK, Spain, The Netherlands, US, Canada, Mexico, Saudi Arabia, South Africa, UAE, Egypt, Turkey, Brazil, Argentina, Chile

  • Escalating demand for sustainable pressure sensitive labels is the driving factor this market.

The Glassine Paper market vendors should focus on grabbing business opportunities from the Product type segment as it accounted for the largest market share in the base year.
RIA - Research AI Assistant
Ask RIA
