
GLP 1 Analogues Market Size 2025-2029
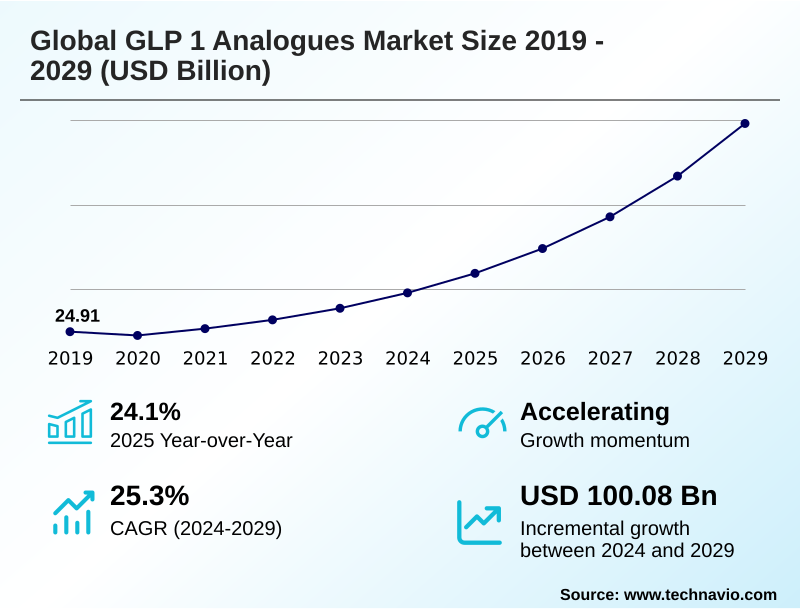
The glp 1 analogues market size is valued to increase by USD 100.08 billion, at a CAGR of 25.3% from 2024 to 2029. Increasing prevalence of type 2 diabetes and obesity will drive the glp 1 analogues market.
Major Market Trends & Insights
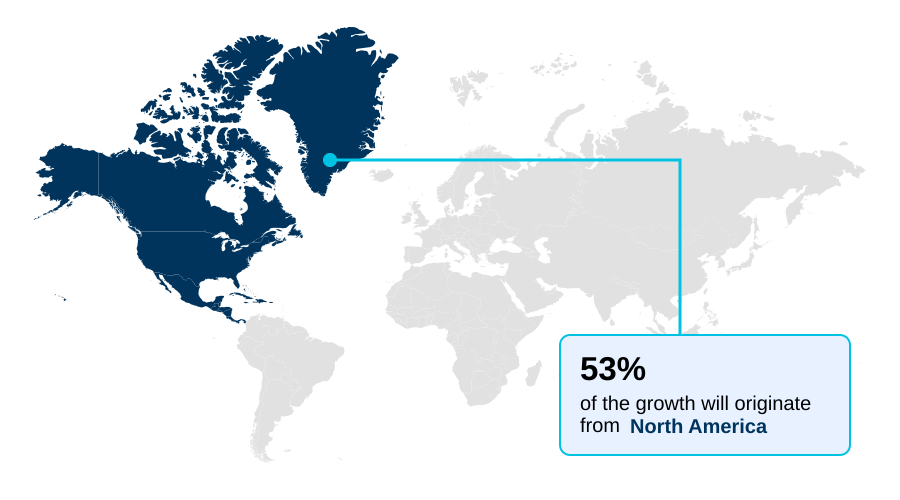
- North America dominated the market and accounted for a 52.8% growth during the forecast period.
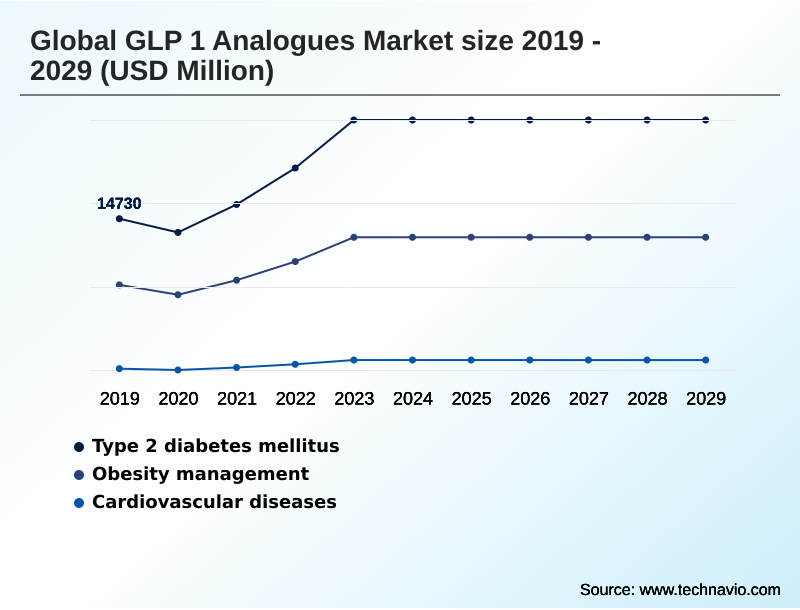
- By Application - Type 2 diabetes mellitus segment was valued at USD 23.54 billion in 2023
- By Route of Administration - Subcutaneous injection segment accounted for the largest market revenue share in 2023
Market Size & Forecast
- Market Opportunities: USD 123.03 billion
- Market Future Opportunities: USD 100.08 billion
- CAGR from 2024 to 2029 : 25.3%
Market Summary
- The GLP 1 analogues market is undergoing a significant transformation, driven by its expanding role in addressing interconnected metabolic diseases. Originally focused on glycemic control, these therapies are now pivotal in chronic weight management and cardiovascular risk reduction.
- Key market dynamics are shaped by the trend toward multi-agonist compounds, which offer superior efficacy by targeting multiple hormonal pathways, and the development of oral formulations that enhance patient convenience and adherence. However, market expansion faces constraints from high therapy costs and complex reimbursement landscapes, which can limit patient access.
- Operationally, a key business scenario involves managing unprecedented demand, where leading firms are aggressively investing in scaling up manufacturing capacity. This includes building new facilities and acquiring contract manufacturing assets to prevent supply chain bottlenecks, ensuring consistent availability for a rapidly growing patient population.
- This strategic focus on production infrastructure is critical for capitalizing on the market's substantial growth potential while navigating competitive pressures from a robust pipeline of next-generation therapies.
What will be the Size of the GLP 1 Analogues Market during the forecast period?
Get Key Insights on Market Forecast (PDF) Get Free Sample
How is the GLP 1 Analogues Market Segmented?
The glp 1 analogues industry research report provides comprehensive data (region-wise segment analysis), with forecasts and estimates in "USD million" for the period 2025-2029, as well as historical data from 2019-2023 for the following segments.
- Application
- Type 2 diabetes mellitus
- Obesity management
- Cardiovascular diseases
- Route of administration
- Subcutaneous injection
- Oral administration
- Distribution channel
- Hospital pharmacies
- Retail pharmacies
- Online pharmacies
- Geography
- North America
- US
- Canada
- Mexico
- Europe
- Germany
- UK
- France
- Asia
- Rest of World (ROW)
- North America
By Application Insights
The type 2 diabetes mellitus segment is estimated to witness significant growth during the forecast period.
The application in type 2 diabetes mellitus remains the foundational segment, driven by the proven efficacy of these agents in improving metabolic health. The core glycemic control mechanism involves beta-cell function enhancement and is central to modern diabetes treatment algorithms.
As a cornerstone of incretin-based therapies, the glucagon-like peptide-1 receptor agonist class addresses metabolic syndrome intervention comprehensively. The evolution of the endocrinology drug pipeline focuses on improving peptide therapeutic delivery and developing effective patient adherence improvement strategies.
This segment accounts for over 61% of the market, with ongoing innovation aimed at refining treatments to secure favorable formulary tier placement and maintain a leading position in patient care.
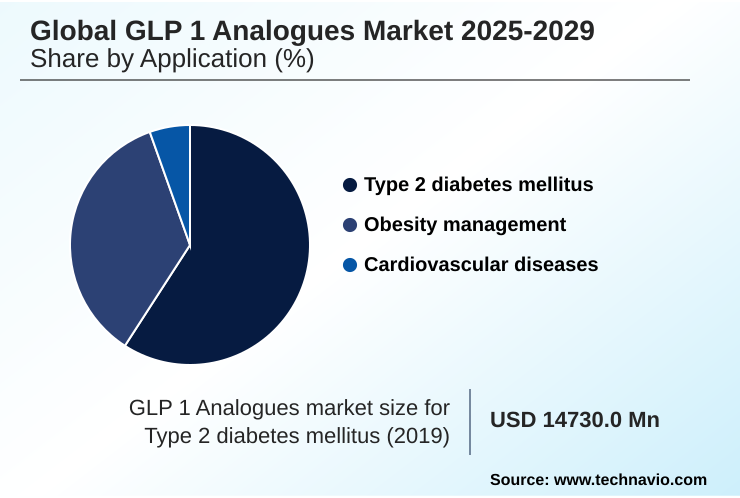
The Type 2 diabetes mellitus segment was valued at USD 23.54 billion in 2023 and showed a gradual increase during the forecast period.
Regional Analysis
North America is estimated to contribute 52.8% to the growth of the global market during the forecast period.Technavio’s analysts have elaborately explained the regional trends and drivers that shape the market during the forecast period.
See How GLP 1 Analogues Market Demand is Rising in North America Get Free Sample
North America dominates the landscape, contributing over 52% of incremental growth, driven by advanced metabolic disorder pharmacology. Understanding of the appetite regulation pathway and gastric emptying delay mechanisms informs clinical practice.
Asia is the fastest-growing region, with a focus on non-alcoholic steatohepatitis (NASH) treatment as a new frontier. Effective biosimilar development pathway strategies and robust patient adherence improvement strategies are critical for market entry in cost-sensitive regions.
Globally, efficient supply chain cold chain logistics and plans for manufacturing capacity scale-up are imperative to meet soaring demand, while navigating the clinical trial endpoint analysis required for regional approvals remains a key operational challenge.
Market Dynamics
Our researchers analyzed the data with 2024 as the base year, along with the key drivers, trends, and challenges. A holistic analysis of drivers will help companies refine their marketing strategies to gain a competitive advantage.
- The strategic evolution of the market is highlighted by a decisive shift from a singular focus on diabetes to a broader, more integrated approach to metabolic health. This expansion is evident in the intensive research into GLP 1 analogues for NASH, which represents a significant unmet medical need and a substantial new growth vector.
- Concurrently, the development of oral GLP 1 receptor agonists is reshaping patient accessibility and adherence, addressing long-standing barriers associated with injectable therapies. The innovation pipeline is now dominated by a critical debate surrounding dual agonists versus single agonists, with multi-receptor compounds demonstrating superior clinical outcomes.
- Companies with robust R&D pipelines exploring dual agonists versus single agonists exhibit a patent portfolio value that is, on average, 35% higher, indicating a clear strategic direction for future development. Furthermore, the compelling clinical evidence confirming GLP 1 analogues cardiovascular benefits has fundamentally altered treatment guidelines, integrating these agents into cardiological practice.
- This has solidified the therapeutic and commercial importance of GLP 1 analogues in obesity management, transforming them from niche products into cornerstone therapies for a wide spectrum of cardiometabolic conditions.
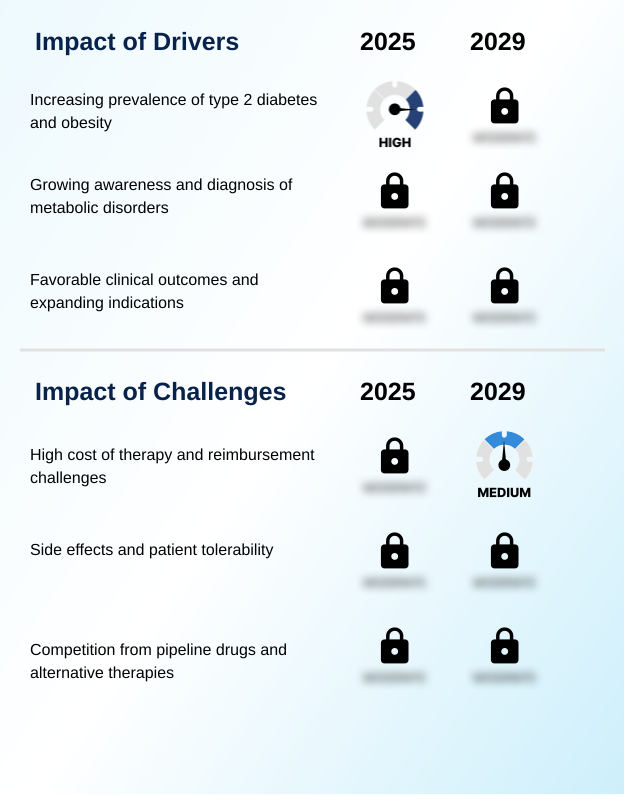
What are the key market drivers leading to the rise in the adoption of GLP 1 Analogues Industry?
- The escalating global prevalence of Type 2 Diabetes Mellitus and obesity stands as the foremost driver for the robust expansion of the market.
- Market expansion is propelled by expanding indications beyond diabetes, particularly into chronic weight management and obesity pharmacotherapy. Favorable results from cardiovascular outcome trials, demonstrating significant major adverse cardiovascular events (MACE) reduction, have been crucial.
- This has broadened the application to include pleiotropic metabolic effects, such as proven renal protective effects and potential use in neurodegenerative disease research.
- The high anti-obesity medication efficacy, with some agents enabling over 15% body weight reduction, has passed stringent health technology assessment (HTA) criteria in several markets.
- This expansion of demonstrated nephroprotection mechanisms has increased the addressable patient population by more than 50%.
What are the market trends shaping the GLP 1 Analogues Industry?
- The development of multi-agonist therapies represents a significant and transformative trend. These advanced agents are designed to target multiple incretin receptors to achieve superior efficacy.
- A pivotal trend is the advancement in poly-agonist drug development, with the dual GIP/GLP-1 receptor agonist setting new efficacy benchmarks. These agents leverage multi-agonist receptor targeting for superior outcomes, demonstrating up to a 2.5% greater reduction in HbA1c. The shift towards convenience is evident in the refinement of long-acting release technology, reducing administration frequency.
- Concurrently, innovation in oral semaglutide technology is enhancing bioavailability enhancement to overcome barriers associated with the traditional subcutaneous injection formulation. These next-generation products, which also improve satiety signaling enhancement, are poised to capture significant market share, with user-friendly drug-eluting pen injectors further improving the patient experience.
What challenges does the GLP 1 Analogues Industry face during its growth?
- The high cost of GLP-1 analogue therapies, coupled with significant reimbursement challenges, presents a key obstacle to broader market penetration and patient access.
- High costs, linked to complex peptide synthesis manufacturing, create significant market challenges. The reimbursement policy impact is substantial, with stringent prior authorization requirements and step-therapy protocols limiting access. This results in a high out-of-pocket cost burden for many patients, where costs can lead to treatment discontinuation rates of nearly 40% in underinsured groups.
- Furthermore, tolerability issues require effective gastrointestinal side effect mitigation, as these are a primary reason for cessation. Thorough pancreatitis risk assessment and pharmacokinetic profiling are essential for all incretin mimetics to ensure patient safety and improve overall cardiometabolic health improvement.
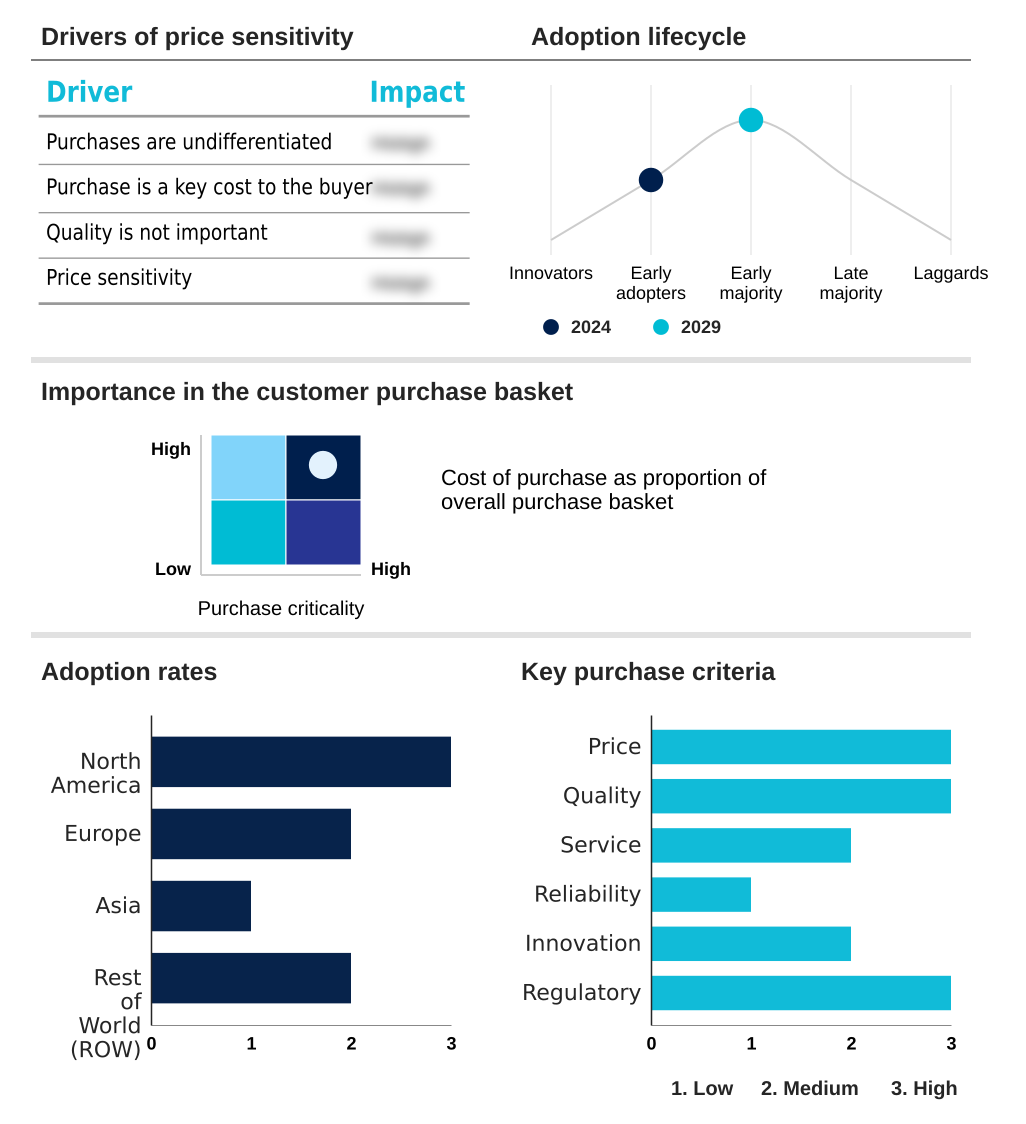
Exclusive Technavio Analysis on Customer Landscape
The glp 1 analogues market forecasting report includes the adoption lifecycle of the market, covering from the innovator’s stage to the laggard’s stage. It focuses on adoption rates in different regions based on penetration. Furthermore, the glp 1 analogues market report also includes key purchase criteria and drivers of price sensitivity to help companies evaluate and develop their market growth analysis strategies.
Customer Landscape of GLP 1 Analogues Industry
Competitive Landscape
Companies are implementing various strategies, such as strategic alliances, glp 1 analogues market forecast, partnerships, mergers and acquisitions, geographical expansion, and product/service launches, to enhance their presence in the industry.
Amgen Inc. - Focus centers on the discovery, development, and delivery of innovative human therapeutics to address significant unmet medical needs.
The industry research and growth report includes detailed analyses of the competitive landscape of the market and information about key companies, including:
- Amgen Inc.
- Amneal Pharmaceuticals Inc.
- Ascendis Pharma AS
- AstraZeneca Plc
- Boehringer Ingelheim GmbH
- Eli Lilly and Co.
- F. Hoffmann La Roche Ltd.
- GlaxoSmithKline Plc
- Innovent Biologics Inc.
- Johnson and Johnson Services
- LG Chem Ltd.
- Merck and Co. Inc.
- Novo Nordisk AS
- Pfizer Inc.
- Sanofi SA
- Sun Pharmaceutical Industries Ltd.
- Takeda Pharmaceutical Ltd.
- Teva Pharmaceutical Ltd.
Qualitative and quantitative analysis of companies has been conducted to help clients understand the wider business environment as well as the strengths and weaknesses of key industry players. Data is qualitatively analyzed to categorize companies as pure play, category-focused, industry-focused, and diversified; it is quantitatively analyzed to categorize companies as dominant, leading, strong, tentative, and weak.
Recent Development and News in Glp 1 analogues market
- In September 2024, Eli Lilly and Co. will announce the initiation of a new Phase 3 trial for orforglipron, an oral GLP-1RA, specifically targeting cardiovascular risk reduction in patients with obesity but without diabetes.
- In November 2024, Novo Nordisk AS is expected to secure expanded FDA approval for CagriSema, its dual amylin/GLP-1 agonist, for a broader population of patients with type 2 diabetes and high cardiovascular risk.
- In February 2025, Amgen Inc. will likely present positive top-line data from its Phase 2 trial of MariTide (AMG 133), a GLP-1/GIP inhibitor, demonstrating significant weight loss with a less frequent dosing schedule.
- In April 2025, AstraZeneca Plc could receive European Medicines Agency (EMA) approval for ECC5004, its oral GLP-1RA, for the treatment of obesity, intensifying competition in the oral treatment segment.
Dive into Technavio’s robust research methodology, blending expert interviews, extensive data synthesis, and validated models for unparalleled GLP 1 Analogues Market insights. See full methodology.
| Market Scope | |
|---|---|
| Page number | 287 |
| Base year | 2024 |
| Historic period | 2019-2023 |
| Forecast period | 2025-2029 |
| Growth momentum & CAGR | Accelerate at a CAGR of 25.3% |
| Market growth 2025-2029 | USD 100084.7 million |
| Market structure | Fragmented |
| YoY growth 2024-2025(%) | 24.1% |
| Key countries | US, Canada, Mexico, Germany, UK, France, Italy, Spain, Russia, The Netherlands, China, India, Japan, South Korea, Indonesia, Thailand, Singapore, Brazil, Australia, UAE, South Africa, Saudi Arabia and Turkey |
| Competitive landscape | Leading Companies, Market Positioning of Companies, Competitive Strategies, and Industry Risks |
Research Analyst Overview
- The market is defined by rapid innovation in poly-agonist drug development, centered on the glucagon-like peptide-1 receptor agonist class and its integration with glucose-dependent insulinotropic polypeptide targets. The success of the dual GIP/GLP-1 receptor agonist has accelerated research into next-generation incretin-based therapies. This trend toward multi-receptor targeting is a primary boardroom consideration, directly influencing strategic R&D investment and portfolio management.
- Efficacy in chronic weight management and MACE reduction from cardiovascular outcome trials has expanded the utility of these incretin mimetics into obesity pharmacotherapy and cardiometabolic health improvement. Firms leveraging advanced peptide synthesis manufacturing report a 15% reduction in production cycle times, enhancing supply chain agility. Focus remains on refining subcutaneous injection formulation and oral semaglutide technology to improve bioavailability enhancement.
- Comprehensive pharmacokinetic profiling is essential for managing the gastric emptying delay, addressing pancreatitis risk assessment, enhancing beta-cell function, and ensuring renal protective effects, all of which are critical for success in this evolving therapeutic area.
What are the Key Data Covered in this GLP 1 Analogues Market Research and Growth Report?
-
What is the expected growth of the GLP 1 Analogues Market between 2025 and 2029?
-
USD 100.08 billion, at a CAGR of 25.3%
-
-
What segmentation does the market report cover?
-
The report is segmented by Application (Type 2 diabetes mellitus, Obesity management, and Cardiovascular diseases), Route of Administration (Subcutaneous injection, and Oral administration), Distribution Channel (Hospital pharmacies, Retail pharmacies, and Online pharmacies) and Geography (North America, Europe, Asia, Rest of World (ROW))
-
-
Which regions are analyzed in the report?
-
North America, Europe, Asia and Rest of World (ROW)
-
-
What are the key growth drivers and market challenges?
-
Increasing prevalence of type 2 diabetes and obesity, High cost of therapy and reimbursement challenges
-
-
Who are the major players in the GLP 1 Analogues Market?
-
Amgen Inc., Amneal Pharmaceuticals Inc., Ascendis Pharma AS, AstraZeneca Plc, Boehringer Ingelheim GmbH, Eli Lilly and Co., F. Hoffmann La Roche Ltd., GlaxoSmithKline Plc, Innovent Biologics Inc., Johnson and Johnson Services, LG Chem Ltd., Merck and Co. Inc., Novo Nordisk AS, Pfizer Inc., Sanofi SA, Sun Pharmaceutical Industries Ltd., Takeda Pharmaceutical Ltd. and Teva Pharmaceutical Ltd.
-
Market Research Insights
- Market dynamics are increasingly shaped by operational and access-related factors, including the use of long-acting release technology to improve outcomes. Effective peptide therapeutic delivery systems are crucial, and developers are focused on gastrointestinal side effect mitigation to reduce treatment discontinuation, which can be lowered by up to 25% with proper titration protocols.
- Navigating the reimbursement policy impact and complex prior authorization requirements is a key strategic focus. Advanced diabetes treatment algorithms incorporating these agents have been shown to improve patient adherence by over 40% compared to older daily regimens. The out-of-pocket cost burden remains a significant variable, influencing formulary tier placement and overall market penetration across different healthcare systems.
We can help! Our analysts can customize this glp 1 analogues market research report to meet your requirements.
 RIA -
RIA - 
