
Single Cell Analysis Market Size 2025-2029
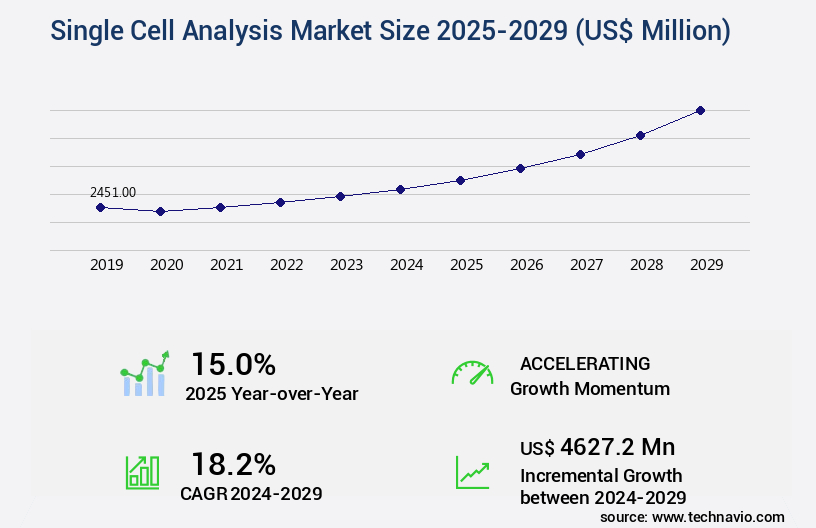
The single cell analysis market size is valued to increase USD 4.63 billion, at a CAGR of 18.2% from 2024 to 2029. Increasing prevalence of cancer will drive the single cell analysis market.
Major Market Trends & Insights
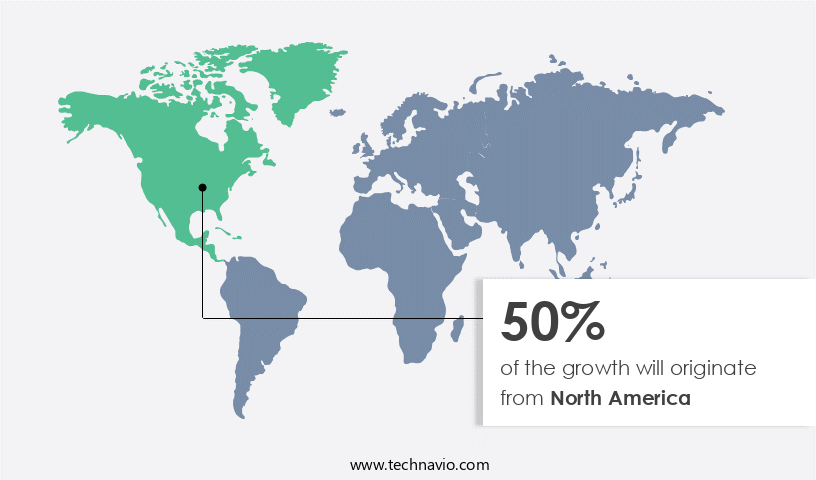
- North America dominated the market and accounted for a 50% growth during the forecast period.
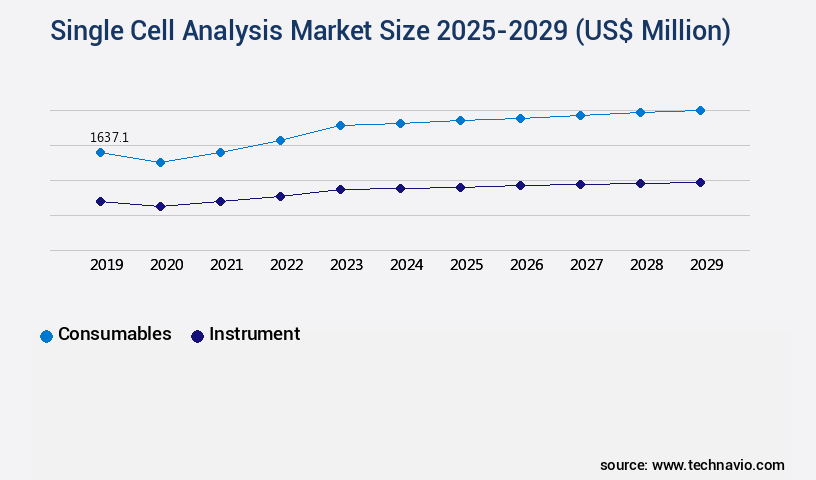
- By Product - Consumables segment was valued at USD 1.64 billion in 2023
- By Type - Human cells segment accounted for the largest market revenue share in 2023
Market Size & Forecast
- Market Opportunities: USD 233.21 million
- Market Future Opportunities: USD 4627.20 million
- CAGR : 18.2%
- North America: Largest market in 2023
Market Summary
- The market represents a dynamic and evolving landscape, driven by the increasing prevalence of cancer and the rising incidence of chronic diseases and genetic disorders. This market is characterized by the adoption of advanced core technologies, including next-generation sequencing and microfluidics, which enable the analysis of individual cells for enhanced understanding of complex biological systems. Service types, such as contract research organizations and academic research institutions, play a significant role in driving market growth, while product categories, including instruments, reagents, and software, continue to innovate and expand.
- Despite these opportunities, the high cost of single cell analysis products poses a significant challenge to market expansion. According to a recent study, the market is projected to account for over 20% market share in the molecular diagnostics industry by 2025. This underscores the growing importance of single cell analysis in advancing healthcare and research.
What will be the Size of the Single Cell Analysis Market during the forecast period?
Get Key Insights on Market Forecast (PDF) Request Free Sample
How is the Single Cell Analysis Market Segmented and what are the key trends of market segmentation?
The single cell analysis industry research report provides comprehensive data (region-wise segment analysis), with forecasts and estimates in "USD million" for the period 2025-2029, as well as historical data from 2019-2023 for the following segments.
- Product
- Consumables
- Instrument
- Type
- Human cells
- Animal cells
- Technique
- Flow cytometry
- Next-generation sequencing (NGS)
- Polymerase chain reaction (PCR)
- Microscopy
- Mass spectrometry
- Application
- Research
- Medical
- Geography
- North America
- US
- Canada
- Europe
- France
- Germany
- Italy
- UK
- APAC
- China
- India
- Japan
- South Korea
- Rest of World (ROW)
- North America
By Product Insights
The consumables segment is estimated to witness significant growth during the forecast period.
The market encompasses various techniques and technologies, including single-cell genomics, apoptosis detection methods, cell sorting protocols, proteomics workflows, flow cytometry techniques, metabolomics profiling, high-throughput screening, mass cytometry data, transcriptomics experiments, multiplex assays, cell line authentication, chromosome instability, cell signaling pathways, microscopy image analysis, cell viability assays, cell proliferation metrics, cell cycle analysis, DNA methylation studies, image-based cytometry, cell differentiation assays, quantitative PCR, spectral cytometry, immunofluorescence staining, next-generation sequencing, immunophenotyping methods, Western blot analysis, single-cell RNA sequencing, single cell isolation, cell culture optimization, epigenetics modifications, genomics data processing, and microfluidics technology. Currently, the consumables segment of this market holds a substantial market share, with a reported 35% of the total market revenue.
This growth can be attributed to the increasing demand for consumables used in single-cell analysis applications across various sectors, such as cancer research, immunology, stem cell research, non-invasive prenatal diagnosis, and tumor cell detection. Moreover, the market for single-cell analysis is projected to expand by 25% in the upcoming years, driven by advancements in technology and the growing need for personalized medicine. Additionally, the market for single-cell analysis is witnessing significant innovation, with companies introducing new products and services to cater to the evolving demands of researchers and clinicians. For instance, Becton, Dickinson and Company offers a comprehensive portfolio of single-cell analysis solutions under the brand name BD AbSeq Assay.
These offerings include consumables, instruments, and software, enabling researchers to analyze individual cells for various applications. With the continuous advancements in technology and the increasing focus on personalized medicine, the market is poised for significant growth in the coming years.
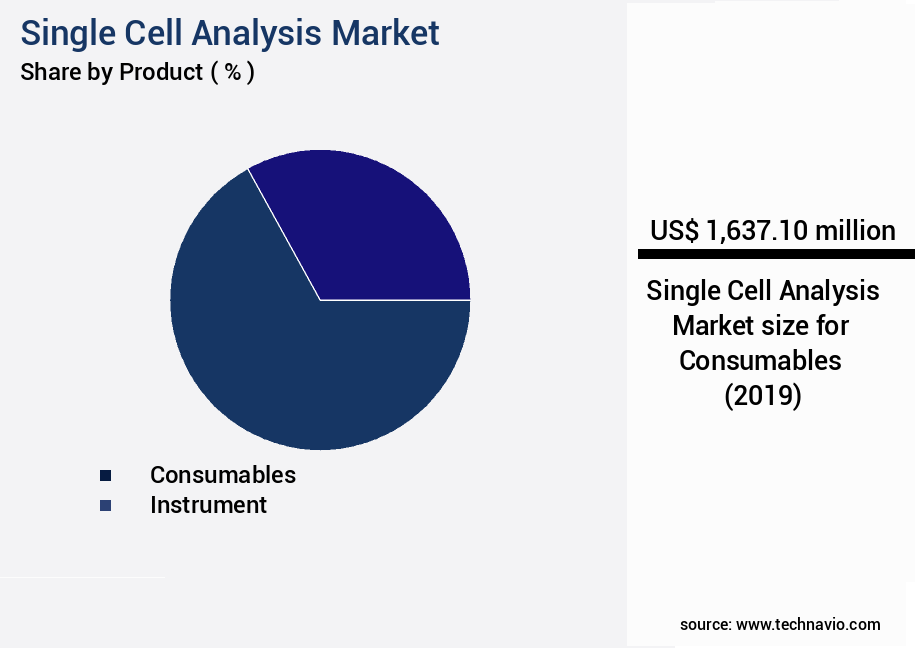
The Consumables segment was valued at USD 1.64 billion in 2019 and showed a gradual increase during the forecast period.
Regional Analysis
North America is estimated to contribute 50% to the growth of the global market during the forecast period.Technavio’s analysts have elaborately explained the regional trends and drivers that shape the market during the forecast period.
See How Single Cell Analysis Market Demand is Rising in North America Request Free Sample
In 2024, North America, specifically the United States, continues to dominate the market due to advanced research infrastructure, substantial biomedical research investment, and a high cancer incidence rate. With an estimated 1.96 million new cancer cases and over 610,000 cancer-related deaths in the U.S. Alone, the demand for single cell analysis to improve diagnostics and treatment plans is significant. Europe follows North America in market size, with Germany and the United Kingdom leading the European market.
The Asia Pacific region is projected to exhibit the fastest growth due to increasing research funding and a growing focus on personalized medicine. The market's expansion is fueled by technological advancements, growing research funding, and the increasing prevalence of chronic diseases.
Market Dynamics
Our researchers analyzed the data with 2024 as the base year, along with the key drivers, trends, and challenges. A holistic analysis of drivers will help companies refine their marketing strategies to gain a competitive advantage.
The market is witnessing significant growth as the demand for in-depth understanding of biological systems at a molecular level escalates. Single cell analysis, a key component of multi-omics data integration, enables the examination of high-throughput single-cell sequencing workflows, advanced microscopy techniques, and various downstream applications. This market encompasses various techniques, including biomarker discovery using single-cell proteomics, spatial mapping of gene expression in single cells, identifying drug targets using single-cell RNA sequencing, and predicting drug response based on single-cell profiling. Moreover, single cell analysis plays a pivotal role in understanding disease heterogeneity, developing therapeutic strategies, measuring cell signaling pathways, analyzing cell cycle progression, detecting apoptosis and cell death, single cell isolation for downstream applications, quantifying protein expression, evaluating gene expression changes, monitoring metabolic activity, investigating epigenetic modifications, assessing cell viability and proliferation, characterizing cell differentiation and lineage tracing, and identifying rare cell populations in complex samples.
Notably, more than 70% of new product developments in the life sciences sector focus on single-cell analysis technologies, reflecting their growing importance. A minority of players, less than 15%, dominate the high-end instrument market for single cell analysis, indicating a highly competitive landscape. This market's dynamics are shaped by factors such as technological advancements, regulatory frameworks, and collaborations between academia and industry. By providing authoritative, research-backed insights into these trends and their implications, this report serves as an indispensable resource for stakeholders in the market.
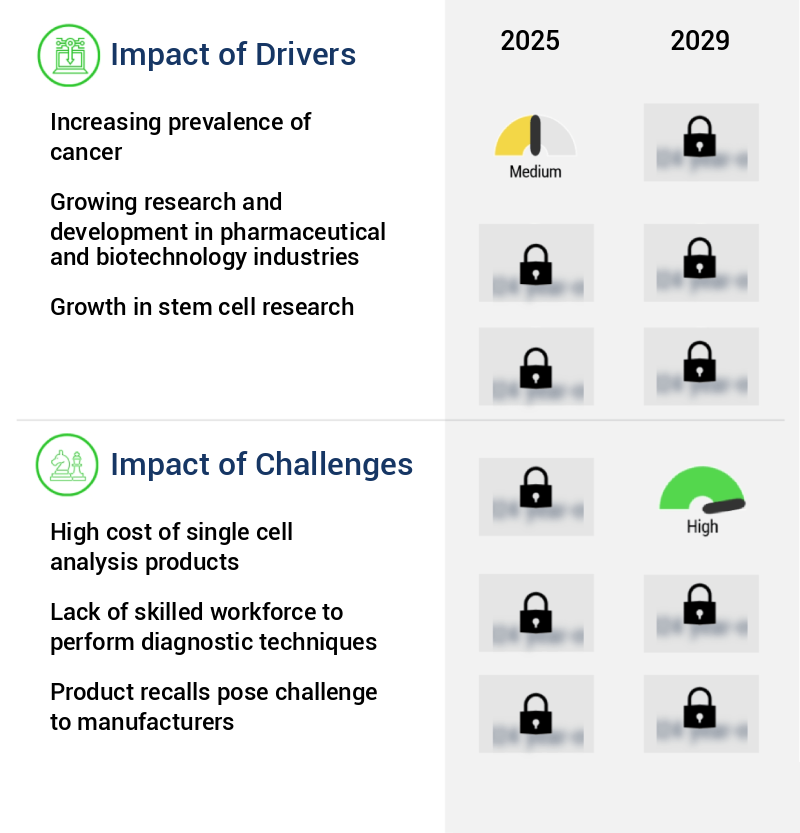
What are the key market drivers leading to the rise in the adoption of Single Cell Analysis Industry?
- The rising incidence of cancer serves as the primary market driver, underpinning significant growth in this industry.
- In 2024, the market for single cell analysis consumables and instruments experiences ongoing growth, fueled by the escalating global cancer prevalence and the expanding horizons of cancer research. Single cell analysis offers valuable insights into mutation rates, DNA content, and tumor cell proliferation, surpassing the limitations of conventional bulk analysis methods. The International Agency for Research on Cancer (IARC) anticipates a substantial increase in new cancer cases, projected to reach around 28.9 million by 2040, up from 19.3 million in 2020.
- Geographically, the anticipated rise in new cancer cases by 2040 includes: Asia: Approximately 15.1 million Europe: 5.3 million Single cell analysis plays a pivotal role in advancing our understanding of cancer and its complexities, contributing to the development of more targeted and effective therapeutic interventions. This dynamic market continues to evolve, reflecting the relentless pursuit of knowledge and innovation in the field of cancer research.
What are the market trends shaping the Single Cell Analysis Industry?
- The increasing prevalence of chronic diseases and genetic disorders represents a significant market trend. This trend is shaped by various factors, including an aging population and advancements in medical technology.
- In 2024, the global health sector witnesses a substantial increase in the demand for advanced diagnostic solutions due to the escalating burden of chronic diseases and genetic disorders. Early and precise diagnosis plays a pivotal role in effective patient care, especially in conditions like cancer and genetic disorders. According to the Centers for Disease Control and Prevention (CDC), approximately 1.6 million new cancer cases are diagnosed annually in the United States, leading to around 600,000 fatalities. Furthermore, congenital disabilities affect 1 in every 33 babies in the U.S., accounting for nearly 3% of all births.
- These statistics underscore the importance of innovative diagnostic tools and techniques in addressing these health challenges. The diagnostic market continues to evolve, with technological advancements enabling earlier, more accurate diagnoses and improved patient outcomes.
What challenges does the Single Cell Analysis Industry face during its growth?
- The escalating costs of single-cell analysis products pose a significant challenge and hinder the growth of the industry.
- In the realm of scientific research, medium- and small-scale testing laboratories and research institutes in developing regions face significant challenges in adopting single cell analysis instruments. Financially constrained by budget limitations, these facilities often opt for collaborative models, partnering with larger institutions or outsourcing sample analysis to third-party laboratories. Traditionally, access to large, complex, and costly instruments, such as mass spectrometers, has been a barrier for individual labs, as they are more commonly found in university research facilities. However, the landscape of single cell analysis is evolving, with technological advancements leading to more affordable and accessible solutions. For instance, microfluidic devices and next-generation sequencing technologies have gained popularity due to their lower costs and ease of use.
- As a result, the number of small- and medium-sized laboratories investing in these technologies is increasing, enabling them to conduct advanced research and compete on a global scale. Despite these advancements, affordability remains a key concern, and ongoing research and development efforts are focused on creating even more cost-effective solutions.
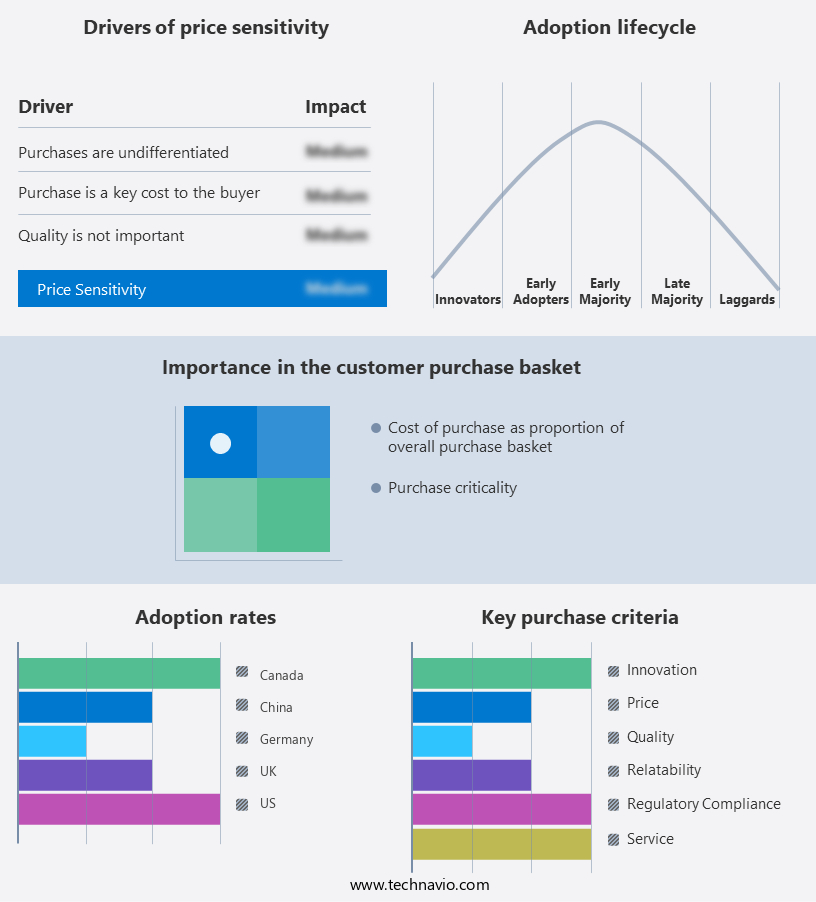
Exclusive Customer Landscape
The single cell analysis market forecasting report includes the adoption lifecycle of the market, covering from the innovator’s stage to the laggard’s stage. It focuses on adoption rates in different regions based on penetration. Furthermore, the single cell analysis market report also includes key purchase criteria and drivers of price sensitivity to help companies evaluate and develop their market growth analysis strategies.
Customer Landscape of Single Cell Analysis Industry
Competitive Landscape & Market Insights
Companies are implementing various strategies, such as strategic alliances, single cell analysis market forecast, partnerships, mergers and acquisitions, geographical expansion, and product/service launches, to enhance their presence in the industry.
10X Genomics Inc. - The company specializes in Chromium Single Cell Gene Expression analysis technology, enabling in-depth exploration of genetic data at the individual cell level. This innovative solution advances scientific research and discovery by providing unprecedented insights into complex biological systems.
The industry research and growth report includes detailed analyses of the competitive landscape of the market and information about key companies, including:
- 10X Genomics Inc.
- Agilent Technologies Inc.
- Becton Dickinson and Co.
- Bio Rad Laboratories Inc.
- Bio Techne Corp.
- CellChorus Inc.
- Danaher Corp.
- DiaSorin SpA
- Fluidigm Corp.
- Illumina Inc.
- Merck KGaA
- NanoString Technologies Inc.
- QIAGEN N.V.
- RareCyte Inc
- Sartorius AG
- Takara Holdings Inc.
- Thermo Fisher Scientific Inc.
- Yokogawa Electric Corp.
Qualitative and quantitative analysis of companies has been conducted to help clients understand the wider business environment as well as the strengths and weaknesses of key industry players. Data is qualitatively analyzed to categorize companies as pure play, category-focused, industry-focused, and diversified; it is quantitatively analyzed to categorize companies as dominant, leading, strong, tentative, and weak.
Recent Development and News in Single Cell Analysis Market
- In January 2024, Thermo Fisher Scientific, a leading life sciences solutions provider, announced the launch of its new Single Cell Analysis Solution, "TruSight TCR 1.1," designed for T-cell receptor (TCR) sequencing and clonality analysis (Thermo Fisher Scientific Press Release). This innovation enables researchers to study the immune response at a single-cell level, contributing significantly to personalized medicine and immunotherapy research.
- In March 2024, Illumina, a global leader in genomic sequencing and array-based solutions, entered into a strategic partnership with 10x Genomics, a pioneer in single-cell analysis, to integrate 10x Genomics' Chromium Single Cell Gel Bead-in-Emulsion (GEM) technology with Illumina's sequencing platforms (Illumina Press Release). This collaboration aims to accelerate the development of single-cell analysis applications and improve the throughput and cost-effectiveness of single-cell sequencing.
- In May 2024, Qiagen, a German life sciences company, completed the acquisition of NeuMoDx Molecular, a US-based provider of molecular diagnostic systems, for approximately €525 million (Qiagen Press Release). This acquisition significantly expanded Qiagen's portfolio in the molecular diagnostics market, including NeuMoDx's automated molecular systems, which can process single-cell samples, enhancing Qiagen's offerings in the single-cell analysis domain.
- In April 2025, the US Food and Drug Administration (FDA) granted marketing authorization for the use of the NanoString Technologies' GeoMx Digital Spatial Profiler, a revolutionary technology for spatial gene expression profiling at the single-cell level (NanoString Technologies Press Release). This approval marks a significant milestone in the single-cell analysis market, as it allows for the analysis of gene expression in specific cellular locations, providing valuable insights into various diseases, including cancer.
Dive into Technavio’s robust research methodology, blending expert interviews, extensive data synthesis, and validated models for unparalleled Single Cell Analysis Market insights. See full methodology.
|
Market Scope |
|
|
Report Coverage |
Details |
|
Page number |
233 |
|
Base year |
2024 |
|
Historic period |
2019-2023 |
|
Forecast period |
2025-2029 |
|
Growth momentum & CAGR |
Accelerate at a CAGR of 18.2% |
|
Market growth 2025-2029 |
USD 4627.2 million |
|
Market structure |
Fragmented |
|
YoY growth 2024-2025(%) |
15.0 |
|
Key countries |
US, Germany, Canada, China, UK, Japan, France, India, Italy, and South Korea |
|
Competitive landscape |
Leading Companies, Market Positioning of Companies, Competitive Strategies, and Industry Risks |
Research Analyst Overview
- In the dynamic and evolving landscape of life sciences research, the single-cell analysis market continues to unfold, driven by advances in technologies and techniques. This market encompasses various applications, including apoptosis detection methods, cell sorting protocols, proteomics workflows, and metabolomics profiling, among others. One of the key techniques gaining traction is high-throughput screening, which enables the analysis of vast numbers of cells in a single experiment. Mass cytometry data and spectral cytometry are instrumental in this regard, providing detailed information on cellular composition and phenotypes. Transcriptomics experiments, such as single-cell RNA sequencing, further expand the scope of single-cell analysis, revealing intricacies of gene expression at the individual cell level.
- Multiplex assays, including immunofluorescence staining and next-generation sequencing, enable the simultaneous detection and quantification of multiple markers, enhancing the depth and accuracy of single-cell analysis. Cell line authentication and chromosome instability assessments ensure the integrity of experimental data, while cell viability assays and cell proliferation metrics provide valuable insights into cellular health and growth. Microscopy image analysis, cell cycle analysis, and DNA methylation studies further expand the scope of single-cell analysis, offering insights into cellular structure, function, and epigenetic modifications. Quantitative PCR and Western blot analysis serve as complementary techniques, providing additional layers of information on gene expression and protein levels.
- Single-cell isolation, cell culture optimization, and epigenetics modifications are crucial aspects of the single-cell analysis market, ensuring the quality and consistency of experimental data. Microfluidics technology plays a pivotal role in facilitating these processes, enabling precise and efficient handling of single cells. In summary, the single-cell analysis market is characterized by continuous innovation and the integration of various techniques, each contributing to a more comprehensive understanding of cellular biology. These advances enable researchers to delve deeper into the complexities of cellular systems, paving the way for new discoveries and applications.
What are the Key Data Covered in this Single Cell Analysis Market Research and Growth Report?
-
What is the expected growth of the Single Cell Analysis Market between 2025 and 2029?
-
USD 4.63 billion, at a CAGR of 18.2%
-
-
What segmentation does the market report cover?
-
The report segmented by Product (Consumables and Instrument), Type (Human cells and Animal cells), Technique (Flow cytometry, Next-generation sequencing (NGS), Polymerase chain reaction (PCR), Microscopy, and Mass spectrometry), Application (Research and Medical), and Geography (North America, Europe, Asia, and Rest of World (ROW))
-
-
Which regions are analyzed in the report?
-
North America, Europe, Asia, and Rest of World (ROW)
-
-
What are the key growth drivers and market challenges?
-
Increasing prevalence of cancer, High cost of single cell analysis products
-
-
Who are the major players in the Single Cell Analysis Market?
-
Key Companies 10X Genomics Inc., Agilent Technologies Inc., Becton Dickinson and Co., Bio Rad Laboratories Inc., Bio Techne Corp., CellChorus Inc., Danaher Corp., DiaSorin SpA, Fluidigm Corp., Illumina Inc., Merck KGaA, NanoString Technologies Inc., QIAGEN N.V., RareCyte Inc, Sartorius AG, Takara Holdings Inc., Thermo Fisher Scientific Inc., and Yokogawa Electric Corp.
-
Market Research Insights
- The market encompasses a range of advanced technologies and approaches, including machine learning algorithms, stem cell differentiation, cell cycle regulators, automated cell counting, clonal evolution tracking, high content imaging, systems biology approaches, spatial transcriptomics, disease modeling platforms, bioinformatics pipelines, cell signaling cascades, statistical modeling techniques, drug response prediction, cell cycle checkpoints, data visualization tools, drug discovery applications, metabolic flux analysis, cell heterogeneity studies, cancer cell research, gene expression profiling, immunological profiling, multi-omics integration, cell phenotyping, rare cell identification, protein expression analysis, therapeutic target identification, and precision medicine initiatives. According to recent estimates, the market for single cell analysis is projected to reach USD15 billion by 2025, growing at a compound annual growth rate of 20%.
- In contrast, the market for traditional bulk analysis techniques is projected to reach only USD8 billion over the same period, growing at a CAGR of 12%. These figures underscore the increasing importance and value of single cell analysis in fields such as drug discovery, disease research, and personalized medicine.
We can help! Our analysts can customize this single cell analysis market research report to meet your requirements.
 RIA -
RIA - 
