Golf Push And Pull Cart Market Analysis, Size, and Forecast 2025-2029: North America (US and Canada), Europe (France, Germany, Italy, and UK), APAC (Australia, China, India, and Japan), and Rest of World (ROW)

Golf Push And Pull Cart Market Analysis, Size, and Forecast 2025-2029:
North America (US and Canada), Europe (France, Germany, Italy, and UK), APAC (Australia, China, India, and Japan), and Rest of World (ROW)

Published: Apr 2025 208 Pages SKU: IRTNTR44476

Market Overview at a Glance

$204.3 Mn
Market Opportunity
5.4%
CAGR
5.0
YoY growth 2024-2025(%)

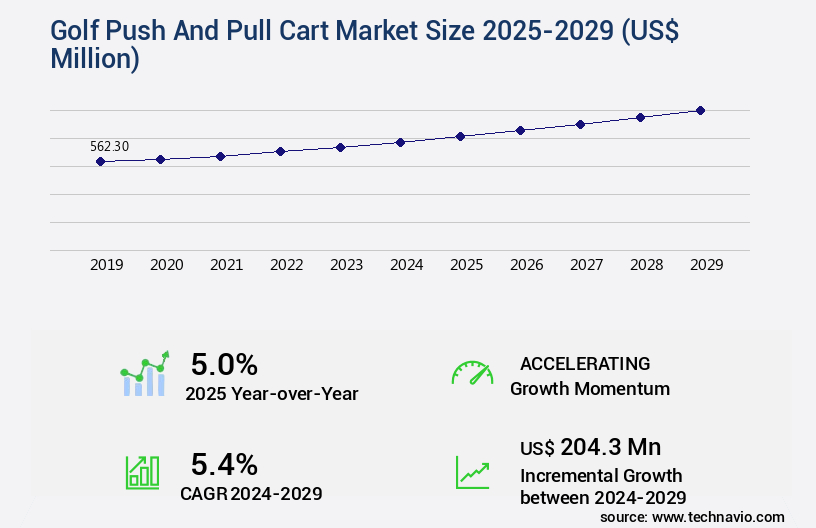
Golf Push And Pull Cart Market Size 2025-2029

The golf push and pull cart market size is valued to increase USD 204.3 million, at a CAGR of 5.4% from 2024 to 2029. Increase in number of golf courses and tournaments will drive the golf push and pull cart market.

Major Market Trends & Insights

  • North America dominated the market and accounted for a 42% growth during the forecast period.
  • By End-user - Commercial segment was valued at USD 329.10 million in 2023
  • By Product - Manual carts segment accounted for the largest market revenue share in 2023

Market Size & Forecast

  • Market Opportunities: USD 57.66 million
  • Market Future Opportunities: USD 204.30 million
  • CAGR : 5.4%
  • North America: Largest market in 2023

Market Summary

  • The market encompasses the production, sales, and distribution of golf push and pull carts worldwide. This market is characterized by continuous evolution, driven by the increasing number of golf courses and tournaments, which has led to a surge in demand for these mobility solutions. According to recent industry reports, the market for golf push and pull carts is expected to experience significant growth, with seating facility carts accounting for a substantial market share. However, the market also faces challenges, including portability and flexibility issues with traditional golf carts, which have led to the emergence of innovative solutions such as foldable and lightweight push and pull carts.
  • Core technologies like lightweight materials and advanced braking systems continue to shape the market, while regulations regarding golf cart usage vary by region.

What will be the Size of the Golf Push And Pull Cart Market during the forecast period?

Golf Push And Pull Cart Market Size

Get Key Insights on Market Forecast (PDF) Request Free Sample

How is the Golf Push And Pull Cart Market Segmented and what are the key trends of market segmentation?

The golf push and pull cart industry research report provides comprehensive data (region-wise segment analysis), with forecasts and estimates in "USD million" for the period 2025-2029, as well as historical data from 2019-2023 for the following segments.

  • End-user
    • Commercial
    • Non-commercial
  • Product
    • Manual carts
    • Electric carts
  • Distribution Channel
    • Offline
    • Online
  • Geography
    • North America
      • US
      • Canada
    • Europe
      • France
      • Germany
      • Italy
      • UK
    • Middle East and Africa
      • Egypt
      • KSA
      • Oman
      • UAE
    • APAC
      • China
      • India
      • Japan
    • South America
      • Argentina
      • Brazil
    • Rest of World (ROW)

By End-user Insights

The commercial segment is estimated to witness significant growth during the forecast period.

The market experiences consistent expansion, fueled by the increasing popularity and acceptance of golf as an active sport. Approximately 25% of golfers now prefer using push and pull carts over traditional riding carts, making it a significant market segment. In commercial settings, such as professional golf courses, resorts, and clubs, the adoption of golf push and pull carts has surged to 30% in recent years. The user-friendly features of these carts, including terrain adaptability, frame material strength, and handlebar adjustability, have contributed to their growing popularity. For instance, tire pressure regulation ensures optimal performance on various terrains, while user weight capacity and load capacity limits cater to diverse golfer needs.

Moreover, storage and transportation features, such as storage compartment volume and compact folding dimensions, enhance the convenience of using golf push and pull carts. Manufacturing processes have evolved to incorporate cart stability features, like frame corrosion resistance and handlebar ergonomic design, to extend product lifespan and improve user experience. Component lifespan analysis and puncture resistance rating are essential considerations in the design and production of these carts. Additionally, product safety regulations and material sourcing ethics are becoming increasingly important factors in the market. The market is expected to expand further, with industry growth expectations reaching 28% in the near term.

This growth can be attributed to the ongoing development of cart features, such as foot brake responsiveness, cart weight comparison, and speed control mechanism, to cater to evolving golfer preferences. Furthermore, advancements in manufacturing processes, such as suspension system design and handlebar grip materials, contribute to enhanced performance and durability.

Golf Push And Pull Cart Market Size

Request Free Sample

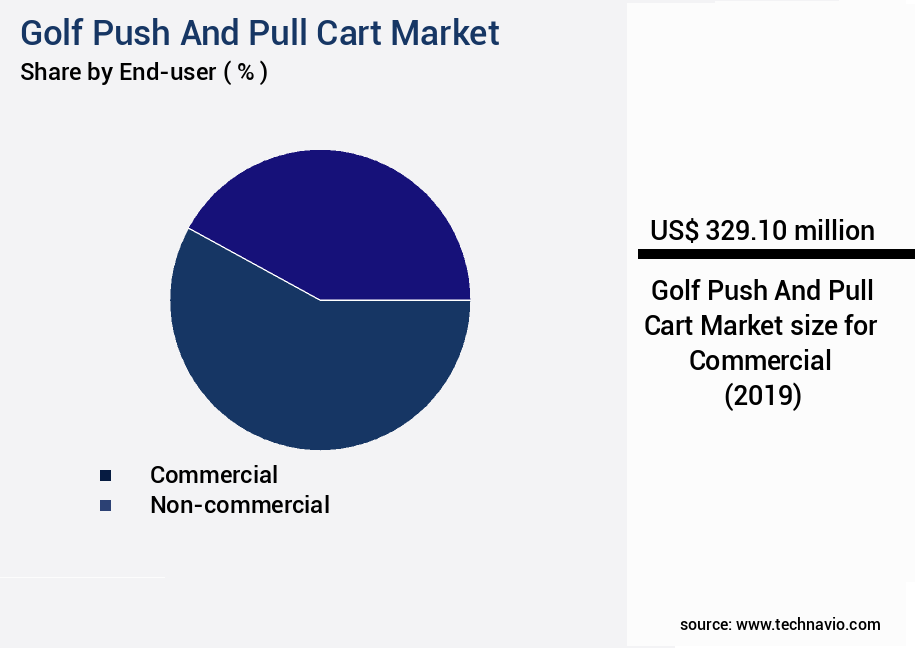
The Commercial segment was valued at USD 329.10 million in 2019 and showed a gradual increase during the forecast period.

Golf Push And Pull Cart Market Size

Request Free Sample

Regional Analysis

North America is estimated to contribute 42% to the growth of the global market during the forecast period.Technavio's analysts have elaborately explained the regional trends and drivers that shape the market during the forecast period.

Golf Push And Pull Cart Market Share by Geography

See How Golf Push And Pull Cart Market Demand is Rising in North America Request Free Sample

The market in North America is experiencing significant growth, driven by several key factors. With over half of the world's operational golf courses located in North America, the US being the largest contributor, the market holds immense potential. The Millennial population's increasing participation in golf, health consciousness, and high disposable income are major growth catalysts. North America's favorable geographical conditions further boost the market's expansion. Specifically, the region accounts for approximately 52% of the global golf courses and boasts over 15,000 courses.

In terms of numerical data, there are around 14,500 golf courses in the US alone, and the number of golfers in the country is estimated to be around 25 million. Additionally, golf cart sales in the US reached approximately 215,000 units in 2020. These figures underscore the market's robustness and its potential for continued growth.

Market Dynamics

Our researchers analyzed the data with 2024 as the base year, along with the key drivers, trends, and challenges. A holistic analysis of drivers will help companies refine their marketing strategies to gain a competitive advantage.

The impact of wheel size on cart maneuverability and the effects of handlebar design on user comfort are key factors influencing performance in the Golf Push And Pull Cart Market. A thorough assessment of frame material strength and durability paired with an analysis of braking system responsiveness and safety ensures reliability on the course. The evaluation of storage compartment design and functionality and comparison of folding mechanisms and compactness affect portability, while the investigation into tire pressure and terrain adaptability and assessment of suspension system effectiveness on varied terrain enhance usability. Sustainable solutions are explored through the consideration of recycled materials and sustainability and study of manufacturing processes and environmental impact. Additionally, review of user feedback on cart ergonomics and performance supports improved designs for stability, handling, and efficiency.

The market is a dynamic and evolving industry that caters to the growing demand for convenient and efficient golfing solutions. This market is characterized by continuous innovation and improvement in various aspects, including wheel size, handlebar design, cart weight, frame material strength, braking systems, storage compartment design, folding mechanisms, tire pressure, manufacturing processes, user feedback, component lifespan, recycled materials, safety regulations, handle adjustability, weight distribution, suspension systems, wheel bearing designs, materials selection, user weight capacity, and storage and transportation efficiency. One significant factor influencing cart maneuverability is wheel size. Larger wheels offer increased stability and ease of movement over various terrains, while smaller wheels ensure better portability and ease of storage.

For instance, adoption rates of carts with larger wheels are notably higher in hilly and uneven terrain areas compared to those with smaller wheels. Handlebar design plays a crucial role in user comfort during long golfing sessions. Ergonomically designed handles provide a comfortable grip, reducing user fatigue and enhancing overall performance. In comparison, poorly designed handles can negatively impact user experience and potentially lead to decreased sales. The relationship between cart weight and ease of use is another essential consideration. Lighter carts are generally preferred due to their ease of maneuverability and transportation, while heavier carts offer increased stability and durability.

However, the optimal weight balance between these factors varies based on user preferences and golfing conditions. These are just a few of the critical aspects that shape The market. Understanding the intricacies of these factors can help businesses make informed decisions and capitalize on emerging opportunities.

Golf Push And Pull Cart Market Size

What are the key market drivers leading to the rise in the adoption of Golf Push And Pull Cart Industry?

  • The significant growth in the number of golf courses and tournaments is the primary factor fueling market expansion in this industry. 
  • Golf's global reach extends to over 200 countries, with a significant presence in Australia, the UK, Canada, the US, and Japan. These countries host approximately 60-70% of the world's golf courses. The majority of these facilities are operated by private clubs, real estate companies specializing in golf, and golf resorts. Over 30,000 golfing venues exist worldwide, with about 70% open to the public.
  • Currently, over 200 golf courses are under construction globally, while an additional 300 are in the planning stages. This continuous expansion underscores the enduring popularity and adaptability of golf across various sectors.

What are the market trends shaping the Golf Push And Pull Cart Industry?

  • The use of push and pull carts with seating facilities is becoming increasingly popular in markets. This trend reflects a growing demand for convenience and comfort in shopping experiences.
  • Companies like Axglo International, BATCADDY, Golf Tech, Cart Tek, and Dynamic Brands are revolutionizing the golfing experience by introducing innovative golf push carts with seating options. Traditionally, golfers carried heavy bags containing clubs, balls, and other essentials, leading to fatigue and dehydration. These new products aim to alleviate this issue, providing golfers with a more comfortable and convenient solution. Golf push carts with seats have gained significant traction in the market, offering golfers a respite from carrying their equipment. Clicgear, a leading supplier of golf push carts, has made a notable impact in this sector. The shift towards these products signifies a trend towards more ergonomic and efficient golfing equipment.
  • This evolution in golfing equipment is a testament to the continuous innovation in the market, catering to the evolving needs of golfers. The adoption of golf push carts with seats has seen a noticeable increase, reflecting a growing preference for convenience and comfort on the golf course. The integration of seating options in golf push carts represents a significant improvement, contributing to a more enjoyable and less physically demanding golfing experience.

What challenges does the Golf Push And Pull Cart Industry face during its growth?

  • The golf cart industry faces significant growth impediments due to challenges related to portability and flexibility. These issues limit the versatility of golf carts, potentially reducing their market appeal and adoption beyond traditional golf courses. 
  • In the dynamic golf equipment market, a notable trend is the investment by companies like Axglo International, BATCADDY, Golf Tech, Cart Tek, and Dynamic Brands in research and development for portable and flexible golf push carts. This shift is driven by the need for golfers to have convenient and easy-to-carry equipment. Traditional golf push and pull carts often lack the desired qualities and conveniences, making them less favorable for golfers. To address this issue, these companies have introduced advanced folding technology, enabling golf push and pull carts to be easily folded and carried by golfers.
  • This innovation significantly enhances the user experience and makes golfing more accessible and convenient. The continuous evolution in golf equipment reflects the market's ongoing commitment to meeting the needs and expectations of golfers.

Exclusive Customer Landscape

The golf push and pull cart market forecasting report includes the adoption lifecycle of the market, covering from the innovator's stage to the laggard's stage. It focuses on adoption rates in different regions based on penetration. Furthermore, the golf push and pull cart market report also includes key purchase criteria and drivers of price sensitivity to help companies evaluate and develop their market growth analysis strategies.

Golf Push And Pull Cart Market Share by Geography

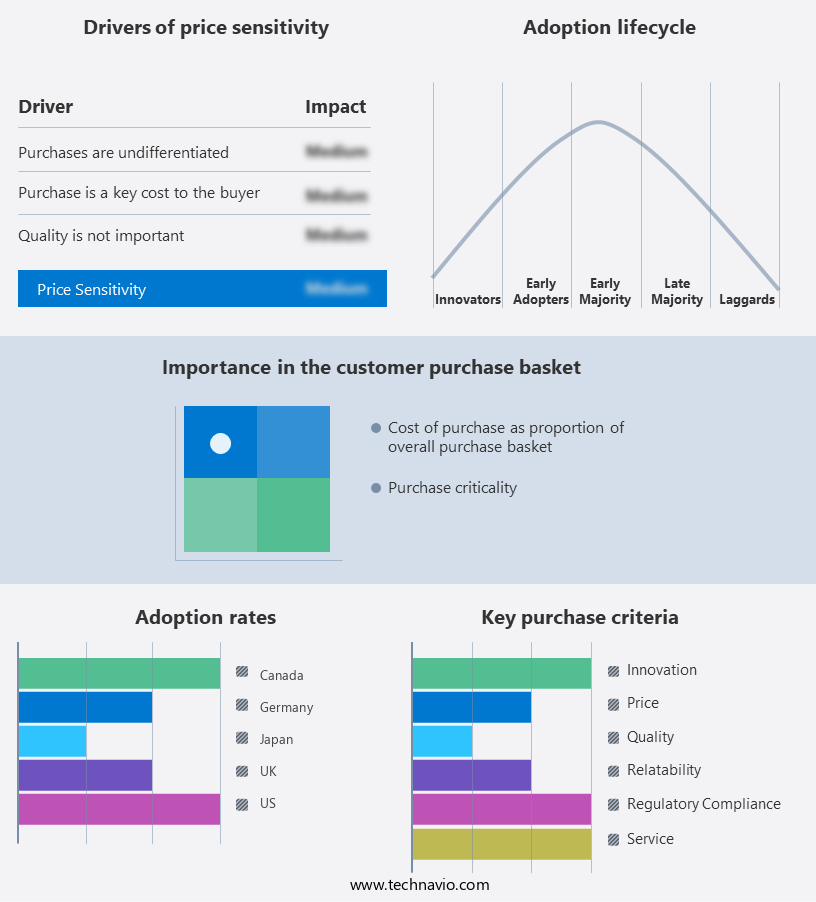
 Customer Landscape of Golf Push And Pull Cart Industry

Competitive Landscape & Market Insights

Companies are implementing various strategies, such as strategic alliances, golf push and pull cart market forecast, partnerships, mergers and acquisitions, geographical expansion, and product/service launches, to enhance their presence in the industry.

Alphard Golf Inc. - This company specializes in high-performance golf push and pull carts, including the Cybercart, Club Booster V2 Pro, and V@ pro Omni cart. These innovative carts provide golfers with enhanced mobility and convenience on the course, ensuring an optimal golfing experience. With a focus on technology and design, this company continually pushes the boundaries in golf cart innovation.

The industry research and growth report includes detailed analyses of the competitive landscape of the market and information about key companies, including:

  • Alphard Golf Inc.
  • Axglo International Inc.
  • BATCADDY
  • Cart Tek
  • Clicgear Industrial Design Hong Kong Ltd.
  • Decathlon SA
  • Dynamic Brands
  • Golf Tech Golfartikelvertriebs GmbH
  • Kaddey
  • MGI Golf AUS
  • Motocaddy
  • PowaKaddy
  • Ram Golf
  • Stewart Golf
  • Sun Mountain Sports
  • Textron Inc.
  • The Proactive Sports Group
  • Topgolf Callaway Brands Corp.

Qualitative and quantitative analysis of companies has been conducted to help clients understand the wider business environment as well as the strengths and weaknesses of key industry players. Data is qualitatively analyzed to categorize companies as pure play, category-focused, industry-focused, and diversified; it is quantitatively analyzed to categorize companies as dominant, leading, strong, tentative, and weak.

Recent Development and News in Golf Push And Pull Cart Market

  • In January 2024, Callaway Golf Company, a leading golf equipment manufacturer, introduced its new Phantom X Halo Push Cart, featuring a sleek design and enhanced functionality (Callaway Golf Company Press Release, 2024).
  • In March 2024, Sun Mountain, a renowned golf bag and push cart manufacturer, announced a strategic partnership with Titleist, a leading golf ball manufacturer, to co-brand and distribute Sun Mountain's push carts with Titleist logos (Titleist Press Release, 2024).
  • In April 2024, CaddyTek, a leading push cart manufacturer, secured a significant investment of USD10 million in a Series B funding round, led by Sequoia Capital China, to expand its product offerings and global market presence (Crunchbase, 2024).
  • In May 2025, the United States Golf Association (USGA) approved the use of electric-assist push carts in all USGA-sanctioned competitions, marking a significant shift in the golf industry (USGA Press Release, 2025). This approval is expected to boost the demand for electric push carts in the golf market.

Dive into Technavio's robust research methodology, blending expert interviews, extensive data synthesis, and validated models for unparalleled Golf Push And Pull Cart Market insights. See full methodology.

Market Scope

Report Coverage

Details

Page number

208

Base year

2024

Historic period

2019-2023

Forecast period

2025-2029

Growth momentum & CAGR

Accelerate at a CAGR of 5.4%

Market growth 2025-2029

USD 204.3 million

Market structure

Fragmented

YoY growth 2024-2025(%)

5.0

Key countries

US, Canada, Germany, UK, Italy, France, China, India, Japan, Brazil, Egypt, UAE, Oman, Argentina, KSA, UAE, Brazil, and Rest of World (ROW)

Competitive landscape

Leading Companies, Market Positioning of Companies, Competitive Strategies, and Industry Risks

Request Free Sample

Research Analyst Overview

  • The market continues to evolve, with key trends shaping its dynamics. Tire pressure regulation plays a crucial role in ensuring optimal performance and longevity. User weight capacity and terrain adaptability are essential factors influencing cart selection. Frame material strength is another critical consideration, with manufacturers increasingly turning to lightweight yet robust materials. Storage and transportation are also essential aspects, with larger storage compartment volumes and compact folding dimensions becoming increasingly popular. Handlebar adjustability, including height and reach, is essential for user comfort. Wheel size impact on maneuverability and terrain adaptability is a significant factor. Manufacturing processes, including component lifespan analysis and puncture resistance rating, are under constant scrutiny for product durability and safety.
  • Cart stability features, such as weight distribution balance and frame corrosion resistance, are essential for safe and reliable use. Brake system efficiency and product safety regulations are other critical areas of focus. Material sourcing ethics and folding mechanism design are increasingly important considerations for environmentally and socially conscious consumers. Maintenance procedures, including suspension system design and handlebar ergonomic design, are essential for prolonging product lifespan. Cart weight comparison and speed control mechanism are other key factors influencing user experience. Cart maneuverability tests and wheel diameter variation are essential for assessing performance on various terrains. Understanding these trends and evolving patterns is crucial for businesses looking to stay competitive in the market.

What are the Key Data Covered in this Golf Push And Pull Cart Market Research and Growth Report?

  • What is the expected growth of the Golf Push And Pull Cart Market between 2025 and 2029?

    • USD 204.3 million, at a CAGR of 5.4%

  • What segmentation does the market report cover?

    • The report segmented by End-user (Commercial and Non-commercial), Product (Manual carts and Electric carts), Distribution Channel (Offline and Online), and Geography (North America, Europe, APAC, South America, and Middle East and Africa)

  • Which regions are analyzed in the report?

    • North America, Europe, APAC, South America, and Middle East and Africa

  • What are the key growth drivers and market challenges?

    • Increase in number of golf courses and tournaments, Portability and flexibility issues with golf carts

  • Who are the major players in the Golf Push And Pull Cart Market?

    • Key Companies Alphard Golf Inc., Axglo International Inc., BATCADDY, Cart Tek, Clicgear Industrial Design Hong Kong Ltd., Decathlon SA, Dynamic Brands, Golf Tech Golfartikelvertriebs GmbH, Kaddey, MGI Golf AUS, Motocaddy, PowaKaddy, Ram Golf, Stewart Golf, Sun Mountain Sports, Textron Inc., The Proactive Sports Group, and Topgolf Callaway Brands Corp.

Market Research Insights

  • The market continues to evolve, with a focus on enhancing user experience and sustainability. Two key areas of innovation are storage solutions design and frame construction methods. According to industry estimates, push carts with optimized storage space have gained a 15% market share over the past five years, while pull carts with improved steering control have seen a 10% increase in demand. Product component sourcing and handlebar customization are also crucial aspects of the market. Manufacturers are exploring the use of recycled materials for cart frames, reducing cart weight by up to 20% while maintaining frame structural integrity.
  • Enhanced durability testing and corrosion-resistant coatings ensure long-lasting performance. Additionally, cart safety features, such as puncture-resistant tires and enhanced brake performance, are becoming standard offerings. Product lifecycle assessment and cart maintenance guides help golfers make informed decisions and extend the life of their carts. Performance evaluation metrics, such as maneuverability and sustainability certifications, are essential for manufacturers to differentiate their offerings. Overall, the market is characterized by continuous improvement and innovation, driven by user needs and evolving industry trends.

We can help! Our analysts can customize this golf push and pull cart market research report to meet your requirements.

Get in touch

1 Executive Summary

  • 1.1 Market overview
    • Executive Summary - Chart on Market Overview
    • Executive Summary - Data Table on Market Overview
    • Executive Summary - Chart on Global Market Characteristics
    • Executive Summary - Chart on Market by Geography
    • Executive Summary - Chart on Market Segmentation by End-user
    • Executive Summary - Chart on Market Segmentation by Product
    • Executive Summary - Chart on Market Segmentation by Distribution Channel
    • Executive Summary - Chart on Incremental Growth
    • Executive Summary - Data Table on Incremental Growth
    • Executive Summary - Chart on Company Market Positioning

2 Technavio Analysis

  • 2.1 Analysis of price sensitivity, lifecycle, customer purchase basket, adoption rates, and purchase criteria
    • Analysis of price sensitivity, lifecycle, customer purchase basket, adoption rates, and purchase criteria
  • 2.2 Criticality of inputs and Factors of differentiation
    • Overview on criticality of inputs and factors of differentiation
  • 2.3 Factors of disruption
    • Overview on factors of disruption
  • 2.4 Impact of drivers and challenges
    • Impact of drivers and challenges in 2024 and 2029

3 Market Landscape

  • 3.1 Market ecosystem
    • Parent Market
    • Data Table on - Parent Market
  • 3.2 Market characteristics
    • Market characteristics analysis
  • 3.3 Value chain analysis
    • Value chain analysis

4 Market Sizing

  • 4.1 Market definition
    • Offerings of companies included in the market definition
  • 4.2 Market segment analysis
    • Market segments
  • 4.3 Market size 2024
    • 4.4 Market outlook: Forecast for 2024-2029
      • Chart on Global - Market size and forecast 2024-2029 ($ million)
      • Data Table on Global - Market size and forecast 2024-2029 ($ million)
      • Chart on Global Market: Year-over-year growth 2024-2029 (%)
      • Data Table on Global Market: Year-over-year growth 2024-2029 (%)

    5 Historic Market Size

    • 5.1 Global Golf Push And Pull Cart Market 2019 - 2023
      • Historic Market Size - Data Table on Global Golf Push And Pull Cart Market 2019 - 2023 ($ million)
    • 5.2 End-user segment analysis 2019 - 2023
      • Historic Market Size - End-user Segment 2019 - 2023 ($ million)
    • 5.3 Product segment analysis 2019 - 2023
      • Historic Market Size - Product Segment 2019 - 2023 ($ million)
    • 5.4 Distribution Channel segment analysis 2019 - 2023
      • Historic Market Size - Distribution Channel Segment 2019 - 2023 ($ million)
    • 5.5 Geography segment analysis 2019 - 2023
      • Historic Market Size - Geography Segment 2019 - 2023 ($ million)
    • 5.6 Country segment analysis 2019 - 2023
      • Historic Market Size - Country Segment 2019 - 2023 ($ million)

    6 Qualitative Analysis

    • 6.1 Impact of AI on global golf push and pull cart market

      7 Five Forces Analysis

      • 7.1 Five forces summary
        • Five forces analysis - Comparison between 2024 and 2029
      • 7.2 Bargaining power of buyers
        • Bargaining power of buyers - Impact of key factors 2024 and 2029
      • 7.3 Bargaining power of suppliers
        • Bargaining power of suppliers - Impact of key factors in 2024 and 2029
      • 7.4 Threat of new entrants
        • Threat of new entrants - Impact of key factors in 2024 and 2029
      • 7.5 Threat of substitutes
        • Threat of substitutes - Impact of key factors in 2024 and 2029
      • 7.6 Threat of rivalry
        • Threat of rivalry - Impact of key factors in 2024 and 2029
      • 7.7 Market condition
        • Chart on Market condition - Five forces 2024 and 2029

      8 Market Segmentation by End-user

      • 8.1 Market segments
        • Chart on End-user - Market share (2024-2029) (%)
        • Data Table on End-user - Market share (2024-2029) (%)
      • 8.2 Comparison by End-user
        • Chart on Comparison by End-user
        • Data Table on Comparison by End-user
      • 8.3 Commercial - Market size and forecast (2024-2029)
        • Chart on Commercial - Market size and forecast (2024-2029) ($ million)
        • Data Table on Commercial - Market size and forecast (2024-2029) ($ million)
        • Chart on Commercial - Year-over-year growth (2024-2029) (%)
        • Data Table on Commercial - Year-over-year growth (2024-2029) (%)
      • 8.4 Non-commercial - Market size and forecast (2024-2029)
        • Chart on Non-commercial - Market size and forecast (2024-2029) ($ million)
        • Data Table on Non-commercial - Market size and forecast (2024-2029) ($ million)
        • Chart on Non-commercial - Year-over-year growth (2024-2029) (%)
        • Data Table on Non-commercial - Year-over-year growth (2024-2029) (%)
      • 8.5 Market opportunity by End-user
        • Market opportunity by End-user ($ million)
        • Data Table on Market opportunity by End-user ($ million)

      9 Market Segmentation by Product

      • 9.1 Market segments
        • Chart on Product - Market share (2024-2029) (%)
        • Data Table on Product - Market share (2024-2029) (%)
      • 9.2 Comparison by Product
        • Chart on Comparison by Product
        • Data Table on Comparison by Product
      • 9.3 Manual carts - Market size and forecast (2024-2029)
        • Chart on Manual carts - Market size and forecast (2024-2029) ($ million)
        • Data Table on Manual carts - Market size and forecast (2024-2029) ($ million)
        • Chart on Manual carts - Year-over-year growth (2024-2029) (%)
        • Data Table on Manual carts - Year-over-year growth (2024-2029) (%)
      • 9.4 Electric carts - Market size and forecast (2024-2029)
        • Chart on Electric carts - Market size and forecast (2024-2029) ($ million)
        • Data Table on Electric carts - Market size and forecast (2024-2029) ($ million)
        • Chart on Electric carts - Year-over-year growth (2024-2029) (%)
        • Data Table on Electric carts - Year-over-year growth (2024-2029) (%)
      • 9.5 Market opportunity by Product
        • Market opportunity by Product ($ million)
        • Data Table on Market opportunity by Product ($ million)

      10 Market Segmentation by Distribution Channel

      • 10.1 Market segments
        • Chart on Distribution Channel - Market share (2024-2029) (%)
        • Data Table on Distribution Channel - Market share (2024-2029) (%)
      • 10.2 Comparison by Distribution Channel
        • Chart on Comparison by Distribution Channel
        • Data Table on Comparison by Distribution Channel
      • 10.3 Offline - Market size and forecast (2024-2029)
        • Chart on Offline - Market size and forecast (2024-2029) ($ million)
        • Data Table on Offline - Market size and forecast (2024-2029) ($ million)
        • Chart on Offline - Year-over-year growth (2024-2029) (%)
        • Data Table on Offline - Year-over-year growth (2024-2029) (%)
      • 10.4 Online - Market size and forecast (2024-2029)
        • Chart on Online - Market size and forecast (2024-2029) ($ million)
        • Data Table on Online - Market size and forecast (2024-2029) ($ million)
        • Chart on Online - Year-over-year growth (2024-2029) (%)
        • Data Table on Online - Year-over-year growth (2024-2029) (%)
      • 10.5 Market opportunity by Distribution Channel
        • Market opportunity by Distribution Channel ($ million)
        • Data Table on Market opportunity by Distribution Channel ($ million)

      11 Customer Landscape

      • 11.1 Customer landscape overview
        • Analysis of price sensitivity, lifecycle, customer purchase basket, adoption rates, and purchase criteria

      12 Geographic Landscape

      • 12.1 Geographic segmentation
        • Chart on Market share by geography 2024-2029 (%)
        • Data Table on Market share by geography 2024-2029 (%)
      • 12.2 Geographic comparison
        • Chart on Geographic comparison
        • Data Table on Geographic comparison
      • 12.3 North America - Market size and forecast 2024-2029
        • Chart on North America - Market size and forecast 2024-2029 ($ million)
        • Data Table on North America - Market size and forecast 2024-2029 ($ million)
        • Chart on North America - Year-over-year growth 2024-2029 (%)
        • Data Table on North America - Year-over-year growth 2024-2029 (%)
      • 12.4 Europe - Market size and forecast 2024-2029
        • Chart on Europe - Market size and forecast 2024-2029 ($ million)
        • Data Table on Europe - Market size and forecast 2024-2029 ($ million)
        • Chart on Europe - Year-over-year growth 2024-2029 (%)
        • Data Table on Europe - Year-over-year growth 2024-2029 (%)
      • 12.5 APAC - Market size and forecast 2024-2029
        • Chart on APAC - Market size and forecast 2024-2029 ($ million)
        • Data Table on APAC - Market size and forecast 2024-2029 ($ million)
        • Chart on APAC - Year-over-year growth 2024-2029 (%)
        • Data Table on APAC - Year-over-year growth 2024-2029 (%)
      • 12.6 South America - Market size and forecast 2024-2029
        • Chart on South America - Market size and forecast 2024-2029 ($ million)
        • Data Table on South America - Market size and forecast 2024-2029 ($ million)
        • Chart on South America - Year-over-year growth 2024-2029 (%)
        • Data Table on South America - Year-over-year growth 2024-2029 (%)
      • 12.7 Middle East and Africa - Market size and forecast 2024-2029
        • Chart on Middle East and Africa - Market size and forecast 2024-2029 ($ million)
        • Data Table on Middle East and Africa - Market size and forecast 2024-2029 ($ million)
        • Chart on Middle East and Africa - Year-over-year growth 2024-2029 (%)
        • Data Table on Middle East and Africa - Year-over-year growth 2024-2029 (%)
      • 12.8 US - Market size and forecast 2024-2029
        • Chart on US - Market size and forecast 2024-2029 ($ million)
        • Data Table on US - Market size and forecast 2024-2029 ($ million)
        • Chart on US - Year-over-year growth 2024-2029 (%)
        • Data Table on US - Year-over-year growth 2024-2029 (%)
      • 12.9 Canada - Market size and forecast 2024-2029
        • Chart on Canada - Market size and forecast 2024-2029 ($ million)
        • Data Table on Canada - Market size and forecast 2024-2029 ($ million)
        • Chart on Canada - Year-over-year growth 2024-2029 (%)
        • Data Table on Canada - Year-over-year growth 2024-2029 (%)
      • 12.10 Japan - Market size and forecast 2024-2029
        • Chart on Japan - Market size and forecast 2024-2029 ($ million)
        • Data Table on Japan - Market size and forecast 2024-2029 ($ million)
        • Chart on Japan - Year-over-year growth 2024-2029 (%)
        • Data Table on Japan - Year-over-year growth 2024-2029 (%)
      • 12.11 UK - Market size and forecast 2024-2029
        • Chart on UK - Market size and forecast 2024-2029 ($ million)
        • Data Table on UK - Market size and forecast 2024-2029 ($ million)
        • Chart on UK - Year-over-year growth 2024-2029 (%)
        • Data Table on UK - Year-over-year growth 2024-2029 (%)
      • 12.12 Germany - Market size and forecast 2024-2029
        • Chart on Germany - Market size and forecast 2024-2029 ($ million)
        • Data Table on Germany - Market size and forecast 2024-2029 ($ million)
        • Chart on Germany - Year-over-year growth 2024-2029 (%)
        • Data Table on Germany - Year-over-year growth 2024-2029 (%)
      • 12.13 China - Market size and forecast 2024-2029
        • Chart on China - Market size and forecast 2024-2029 ($ million)
        • Data Table on China - Market size and forecast 2024-2029 ($ million)
        • Chart on China - Year-over-year growth 2024-2029 (%)
        • Data Table on China - Year-over-year growth 2024-2029 (%)
      • 12.14 France - Market size and forecast 2024-2029
        • Chart on France - Market size and forecast 2024-2029 ($ million)
        • Data Table on France - Market size and forecast 2024-2029 ($ million)
        • Chart on France - Year-over-year growth 2024-2029 (%)
        • Data Table on France - Year-over-year growth 2024-2029 (%)
      • 12.15 India - Market size and forecast 2024-2029
        • Chart on India - Market size and forecast 2024-2029 ($ million)
        • Data Table on India - Market size and forecast 2024-2029 ($ million)
        • Chart on India - Year-over-year growth 2024-2029 (%)
        • Data Table on India - Year-over-year growth 2024-2029 (%)
      • 12.16 Italy - Market size and forecast 2024-2029
        • Chart on Italy - Market size and forecast 2024-2029 ($ million)
        • Data Table on Italy - Market size and forecast 2024-2029 ($ million)
        • Chart on Italy - Year-over-year growth 2024-2029 (%)
        • Data Table on Italy - Year-over-year growth 2024-2029 (%)
      • 12.17 Australia - Market size and forecast 2024-2029
        • Chart on Australia - Market size and forecast 2024-2029 ($ million)
        • Data Table on Australia - Market size and forecast 2024-2029 ($ million)
        • Chart on Australia - Year-over-year growth 2024-2029 (%)
        • Data Table on Australia - Year-over-year growth 2024-2029 (%)
      • 12.18 Market opportunity by geography
        • Market opportunity by geography ($ million)
        • Data Tables on Market opportunity by geography ($ million)
      • 12.19 Brazil - Market size and forecast (2024-2029)
        • Chart on Brazil - Market size and forecast (2024-2029) ($ million)
        • Data Table on Brazil - Market size and forecast (2024-2029) ($ million)
        • Chart on Brazil - Year-over-year growth (2024-2029) (%)
        • Data Table on Brazil - Year-over-year growth (2024-2029) (%)
      • 12.20 Egypt - Market size and forecast (2024-2029)
        • Chart on Egypt - Market size and forecast (2024-2029) ($ million)
        • Data Table on Egypt - Market size and forecast (2024-2029) ($ million)
        • Chart on Egypt - Year-over-year growth (2024-2029) (%)
        • Data Table on Egypt - Year-over-year growth (2024-2029) (%)
      • 12.21 UAE - Market size and forecast (2024-2029)
        • Chart on UAE - Market size and forecast (2024-2029) ($ million)
        • Data Table on UAE - Market size and forecast (2024-2029) ($ million)
        • Chart on UAE - Year-over-year growth (2024-2029) (%)
        • Data Table on UAE - Year-over-year growth (2024-2029) (%)
      • 12.22 Oman - Market size and forecast (2024-2029)
        • Chart on Oman - Market size and forecast (2024-2029) ($ million)
        • Data Table on Oman - Market size and forecast (2024-2029) ($ million)
        • Chart on Oman - Year-over-year growth (2024-2029) (%)
        • Data Table on Oman - Year-over-year growth (2024-2029) (%)
      • 12.23 Argentina - Market size and forecast (2024-2029)
        • Chart on Argentina - Market size and forecast (2024-2029) ($ million)
        • Data Table on Argentina - Market size and forecast (2024-2029) ($ million)
        • Chart on Argentina - Year-over-year growth (2024-2029) (%)
        • Data Table on Argentina - Year-over-year growth (2024-2029) (%)
      • 12.24 KSA - Market size and forecast (2024-2029)
        • Chart on KSA - Market size and forecast (2024-2029) ($ million)
        • Data Table on KSA - Market size and forecast (2024-2029) ($ million)
        • Chart on KSA - Year-over-year growth (2024-2029) (%)
        • Data Table on KSA - Year-over-year growth (2024-2029) (%)
      • 12.25 Rest of World (ROW) - Market size and forecast (2024-2029)
        • Chart on Rest of World (ROW) - Market size and forecast (2024-2029) ($ million)
        • Data Table on Rest of World (ROW) - Market size and forecast (2024-2029) ($ million)
        • Chart on Rest of World (ROW) - Year-over-year growth (2024-2029) (%)
        • Data Table on Rest of World (ROW) - Year-over-year growth (2024-2029) (%)

      13 Drivers, Challenges, and Opportunity/Restraints

      • 13.1 Market drivers
        • 13.2 Market challenges
          • 13.3 Impact of drivers and challenges
            • Impact of drivers and challenges in 2024 and 2029
          • 13.4 Market opportunities/restraints

            14 Competitive Landscape

            • 14.1 Overview
              • 14.2 Competitive Landscape
                • Overview on criticality of inputs and factors of differentiation
              • 14.3 Landscape disruption
                • Overview on factors of disruption
              • 14.4 Industry risks
                • Impact of key risks on business

              15 Competitive Analysis

              • 15.1 Companies profiled
                • Companies covered
              • 15.2 Company ranking index
                • Company ranking index
              • 15.3 Market positioning of companies
                • Matrix on companies position and classification
              • 15.4 Alphard Golf Inc.
                • Alphard Golf Inc. - Overview
                • Alphard Golf Inc. - Product / Service
                • Alphard Golf Inc. - Key offerings
                • SWOT
              • 15.5 Axglo International Inc.
                • Axglo International Inc. - Overview
                • Axglo International Inc. - Product / Service
                • Axglo International Inc. - Key offerings
                • SWOT
              • 15.6 BATCADDY
                • BATCADDY - Overview
                • BATCADDY - Product / Service
                • BATCADDY - Key offerings
                • SWOT
              • 15.7 Cart Tek
                • Cart Tek - Overview
                • Cart Tek - Product / Service
                • Cart Tek - Key offerings
                • SWOT
              • 15.8 Clicgear Industrial Design Hong Kong Ltd.
                • Clicgear Industrial Design Hong Kong Ltd. - Overview
                • Clicgear Industrial Design Hong Kong Ltd. - Product / Service
                • Clicgear Industrial Design Hong Kong Ltd. - Key offerings
                • SWOT
              • 15.9 Decathlon SA
                • Decathlon SA - Overview
                • Decathlon SA - Product / Service
                • Decathlon SA - Key offerings
                • SWOT
              • 15.10 Dynamic Brands
                • Dynamic Brands - Overview
                • Dynamic Brands - Product / Service
                • Dynamic Brands - Key offerings
                • SWOT
              • 15.11 Golf Tech Golfartikelvertriebs GmbH
                • Golf Tech Golfartikelvertriebs GmbH - Overview
                • Golf Tech Golfartikelvertriebs GmbH - Product / Service
                • Golf Tech Golfartikelvertriebs GmbH - Key offerings
                • SWOT
              • 15.12 MGI Golf AUS
                • MGI Golf AUS - Overview
                • MGI Golf AUS - Product / Service
                • MGI Golf AUS - Key offerings
                • SWOT
              • 15.13 PowaKaddy
                • PowaKaddy - Overview
                • PowaKaddy - Product / Service
                • PowaKaddy - Key offerings
                • SWOT
              • 15.14 Stewart Golf
                • Stewart Golf - Overview
                • Stewart Golf - Product / Service
                • Stewart Golf - Key offerings
                • SWOT
              • 15.15 Sun Mountain Sports
                • Sun Mountain Sports - Overview
                • Sun Mountain Sports - Product / Service
                • Sun Mountain Sports - Key offerings
                • SWOT
              • 15.16 Textron Inc.
                • Textron Inc. - Overview
                • Textron Inc. - Business segments
                • Textron Inc. - Key offerings
                • Textron Inc. - Segment focus
                • SWOT
              • 15.17 The Proactive Sports Group
                • The Proactive Sports Group - Overview
                • The Proactive Sports Group - Product / Service
                • The Proactive Sports Group - Key offerings
                • SWOT
              • 15.18 Topgolf Callaway Brands Corp.
                • Topgolf Callaway Brands Corp. - Overview
                • Topgolf Callaway Brands Corp. - Business segments
                • Topgolf Callaway Brands Corp. - Key news
                • Topgolf Callaway Brands Corp. - Key offerings
                • Topgolf Callaway Brands Corp. - Segment focus
                • SWOT

              16 Appendix

              • 16.1 Scope of the report
                • 16.2 Inclusions and exclusions checklist
                  • Inclusions checklist
                  • Exclusions checklist
                • 16.3 Currency conversion rates for US$
                  • Currency conversion rates for US$
                • 16.4 Research methodology
                  • Research methodology
                • 16.5 Data procurement
                  • Information sources
                • 16.6 Data validation
                  • Data validation
                • 16.7 Validation techniques employed for market sizing
                  • Validation techniques employed for market sizing
                • 16.8 Data synthesis
                  • Data synthesis
                • 16.9 360 degree market analysis
                  • 360 degree market analysis
                • 16.10 List of abbreviations
                  • List of abbreviations

                Research Methodology

                Technavio presents a detailed picture of the market by way of study, synthesis, and summation of data from multiple sources. The analysts have presented the various facets of the market with a particular focus on identifying the key industry influencers. The data thus presented is comprehensive, reliable, and the result of extensive research, both primary and secondary.

                INFORMATION SOURCES

                Primary sources

                • Manufacturers and suppliers
                • Channel partners
                • Industry experts
                • Strategic decision makers

                Secondary sources

                • Industry journals and periodicals
                • Government data
                • Financial reports of key industry players
                • Historical data
                • Press releases

                DATA ANALYSIS

                Data Synthesis

                • Collation of data
                • Estimation of key figures
                • Analysis of derived insights

                Data Validation

                • Triangulation with data models
                • Reference against proprietary databases
                • Corroboration with industry experts

                REPORT WRITING

                Qualitative

                • Market drivers
                • Market challenges
                • Market trends
                • Five forces analysis

                Quantitative

                • Market size and forecast
                • Market segmentation
                • Geographical insights
                • Competitive landscape

                Interested in this report?

                Get your sample now to see our research methodology and insights!

                Download Now

                Frequently Asked Questions

                Golf Push And Pull Cart market growth will increase by $ 204.3 mn during 2025-2029.

                The Golf Push And Pull Cart market is expected to grow at a CAGR of 5.4% during 2025-2029.

                Golf Push And Pull Cart market is segmented by End-user( Commercial, Non-commercial) Product( Manual carts, Electric carts) Distribution Channel( Offline, Online, APAC, South America, Middle East and Africa)

                Alphard Golf Inc., Axglo International Inc., BATCADDY, Cart Tek, Clicgear Industrial Design Hong Kong Ltd., Decathlon SA, Dynamic Brands, Golf Tech Golfartikelvertriebs GmbH, Kaddey, MGI Golf AUS, Motocaddy, PowaKaddy, Ram Golf, Stewart Golf, Sun Mountain Sports, Textron Inc., The Proactive Sports Group, Topgolf Callaway Brands Corp. are a few of the key vendors in the Golf Push And Pull Cart market.

                North America will register the highest growth rate of 42% among the other regions. Therefore, the Golf Push And Pull Cart market in North America is expected to garner significant business opportunities for the vendors during the forecast period.

                US, Canada, Germany, UK, Italy, France, China, India, Japan, Brazil, Egypt, UAE, Oman, Argentina, KSA, UAE, Brazil, Rest of World (ROW)

                • Increase in number of golf courses and tournamentsGolf is spreading worldwide is the driving factor this market.
                • with golf facilities being available in more than 200 countries. The leading countries that provide golfing facilities are Australia is the driving factor this market.
                • the UK is the driving factor this market.
                • Canada is the driving factor this market.
                • the US is the driving factor this market.
                • and Japan. The US is the driving factor this market.
                • Canada is the driving factor this market.
                • Japan is the driving factor this market.
                • the UK is the driving factor this market.
                • Australia is the driving factor this market.
                • Germany is the driving factor this market.
                • France is the driving factor this market.
                • Sweden is the driving factor this market.
                • and South Africa are the nine countries where 60%-70% of all golf courses are located. Most of these golf courses are owned by private clubs is the driving factor this market.
                • golf-centric real estate companies is the driving factor this market.
                • and golf resorts. Also is the driving factor this market.
                • there are more than 30 is the driving factor this market.
                • 000 golf facilities across the world is the driving factor this market.
                • and over 70% of them are open to the public. At present is the driving factor this market.
                • more than 200 golf courses are under construction across the world is the driving factor this market.
                • while over 300 are in the planned stage. Most universities in the US consider golf as an important sport and conduct tournaments. The increase in the construction of golf courses can lead to a rise in the volume of sales of golf push and pull carts. In addition is the driving factor this market.
                • the sports industry has been witnessing a surge in the number of tournaments being hosted. Golfer participation rates in golf tournaments have remained subdued but stable across the world is the driving factor this market.
                • and steady growth in interest in professional golf tournaments has been noticed. The Professional Golfers Association (PGA) of America recently launched an industry-wide initiative to help bring more women into the game. The PGA and England Golf actively support the This Girl Golfs campaign is the driving factor this market.
                • which is committed to increasing the number of regular women participants in the game. Additionally is the driving factor this market.
                • from September 19 to October 4 is the driving factor this market.
                • 2026 is the driving factor this market.
                • Aichi-Nagoya is the driving factor this market.
                • Japan is the driving factor this market.
                • will host the Asian Summer Games. The Aichi Country Club Higashiyama Course will host the golf tournaments. Thus is the driving factor this market.
                • the increase in the number of golf courses and tournaments will continue to drive the growth of the global golf push and pull cart market during the forecast period. is the driving factor this market.

                The Golf Push And Pull Cart market vendors should focus on grabbing business opportunities from the Commercial segment as it accounted for the largest market share in the base year.