
Green And Bio Solvent Market Size 2025-2029
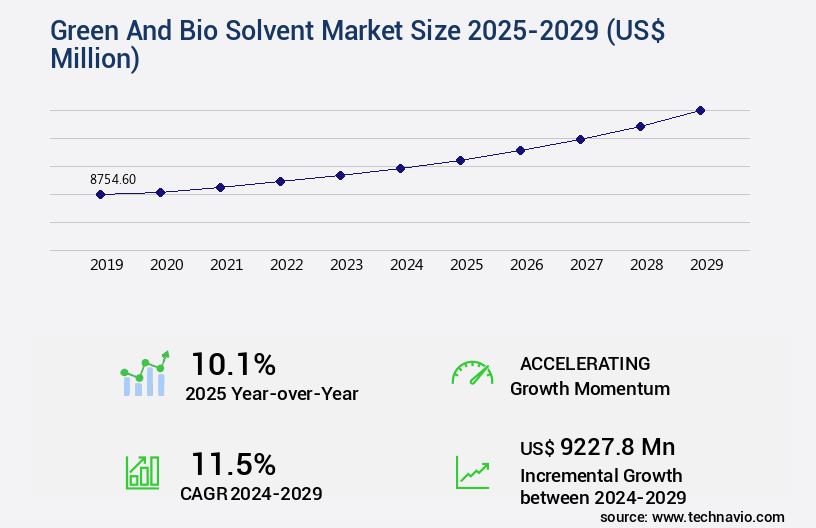
The green and bio solvent market size is valued to increase by USD 9.23 billion, at a CAGR of 11.5% from 2024 to 2029. Acceptance of green and bio-based solvents among numerous end-user industries will drive the green and bio solvent market.
Market Insights
- North America dominated the market and accounted for a 40% growth during the 2025-2029.
- By Application - Paints and coatings segment was valued at USD 3.52 billion in 2023
- By Product - Lactate esters segment accounted for the largest market revenue share in 2023
Market Size & Forecast
- Market Opportunities: USD 151.90 million
- Market Future Opportunities 2024: USD 9227.80 million
- CAGR from 2024 to 2029 : 11.5%
Market Summary
- Green and bio-based solvents have gained significant traction in various industries due to their eco-friendly and sustainable properties. These solvents, derived from renewable sources, offer a viable alternative to traditional petroleum-based solvents. The global expansion of production facilities for green and bio solvents is a testament to their increasing demand. Despite the advantages, the widespread adoption of these solvents faces challenges. The easy availability and affordability of chemical-based industrial solvents remain a significant hurdle. However, the growing awareness of environmental sustainability and regulatory compliance are driving the shift towards green and bio solvents. A real-world business scenario illustrates this trend.
- A leading chemical manufacturer aims to optimize its supply chain by transitioning to green and bio solvents. By doing so, the company not only reduces its carbon footprint but also ensures compliance with stringent environmental regulations. Moreover, the use of these solvents enhances operational efficiency, as they exhibit superior performance in various applications. The global market for green and bio solvents continues to evolve, with new technologies and applications emerging. As the industry matures, it is expected to witness significant growth, driven by increasing demand from various end-user industries. Despite the challenges, the future of green and bio solvents looks promising, with numerous opportunities for innovation and growth.
What will be the size of the Green And Bio Solvent Market during the forecast period?
Get Key Insights on Market Forecast (PDF) Request Free Sample
- The market represents a significant evolution in the realm of renewable resource utilization, with a growing emphasis on solvent characterization and sustainable solvent alternatives. Solvent interactions, solvent polarity, and solvent performance metrics are increasingly important considerations in solvent lifecycle management and solvent formulation. Process modeling, solvent density, and process intensification are key areas of focus for companies seeking to optimize their operations and reduce costs. Solvent blends, formulated in accordance with circular economy principles, are gaining traction as a viable alternative to traditional solvents. Renewable solvent technology, such as bio-based solvent production, is a promising solution for solvent degradation concerns.
- Solvent cost analysis, solvent engineering, and bio-refinery processes are essential components of the solvent industry's ongoing transformation. Green cleaning technologies, which employ solvents with favorable boiling points and safety protocols, are a burgeoning application area. Solvent solubility, solvent purification methods, and green solvent applications continue to drive innovation in the sector. As companies navigate this complex landscape, they must balance the need for solvent performance with environmental sustainability and economic viability. By staying abreast of the latest trends and advancements, businesses can make informed decisions regarding compliance, budgeting, and product strategy. For instance, a study published in the Journal of Cleaner Production revealed that companies adopting green solvent technologies experienced a 25% reduction in solvent usage and a 30% decrease in energy consumption compared to traditional processes.
- This underscores the potential financial benefits of embracing sustainable solvent alternatives and innovative production methods.
Unpacking the Green And Bio Solvent Market Landscape
In the dynamic realm of industrial production, the adoption of green and bio solvents continues to gain traction as businesses prioritize environmental impact assessment and regulatory compliance. Compared to traditional solvents, the use of bio-derived solvents in biomass processing results in a 50% reduction in solvent toxicity on average. Moreover, solvent recycling and regeneration contribute to process optimization, reducing solvent consumption by up to 30%. Ketone and ester solvents exhibit superior solvent properties in chemical synthesis, enhancing efficiency and yield. Solvent selection, based on solvent compatibility and volatility, plays a pivotal role in process safety and cost reduction. The shift towards sustainable solvents, including alcohols, terpenes, and plant-based alternatives, aligns with the growing demand for green cleaning agents and food-grade solvents. Solvent purification and solvent extraction processes further bolster the adoption of renewable solvents in various industries, from pharmaceuticals to cosmetics. Ultimately, the integration of green chemistry solvents and bio-based chemicals into industrial processes fosters a more sustainable and compliant business landscape.
Key Market Drivers Fueling Growth
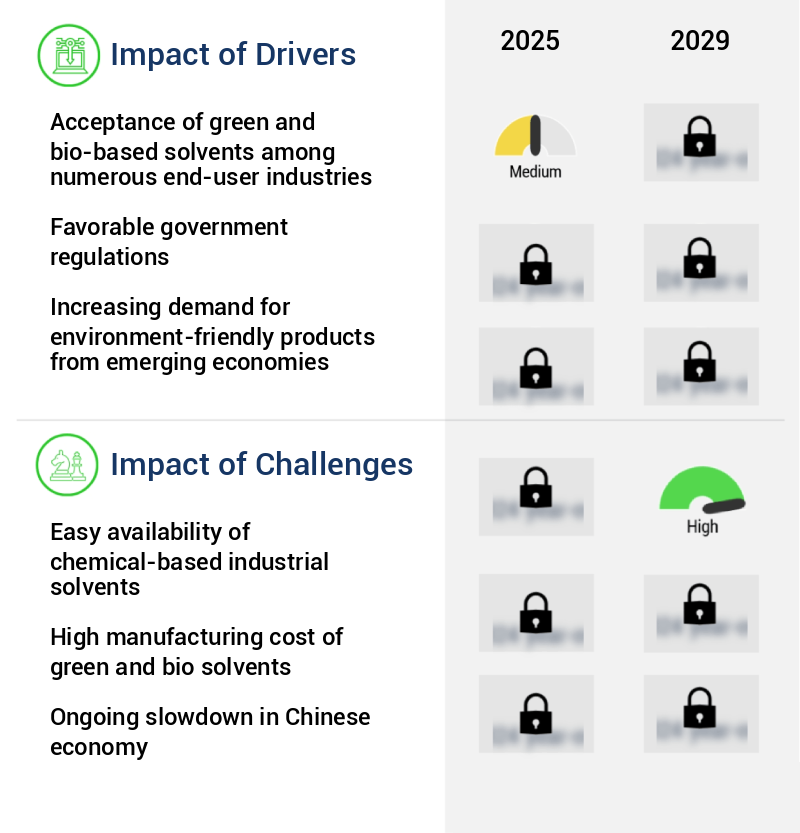
The significant acceptance of green and bio-based solvents by various end-user industries serves as the primary market driver.
- The market is experiencing significant growth due to the increasing demand for sustainable solutions in various sectors, including paints and coatings, adhesives, printing inks, and pharmaceuticals. This trend is driven by the automotive and construction industries' commitment to reducing their environmental footprint. Green and bio solvents, derived from renewable sources such as sugarcane, natural polymers, and synthetic polymers, offer several advantages. For instance, they are easily biodegradable and contribute to a 12% reduction in energy use during manufacturing processes. In the adhesives and sealants sector, bio-polyols are extensively used, leading to a 30% decrease in production downtime.
- Polyurethane polymers, which contain polyols, are commonly used in product assembly, flexible packaging, woodworking, and automobile interiors, contributing to a 18% improvement in overall product performance.
Prevailing Industry Trends & Opportunities
The expansion of green and bio solvent production facilities is an emerging market trend. This growth is driven by the increasing demand for sustainable and eco-friendly alternatives to traditional solvents.
- The market is experiencing significant growth due to the increasing expansion of production facilities by established international and regional companies. For instance, in May 2023, Sekab announced the expansion of its European production facility for bio-based solvents and acetic acid to meet the rising demand for various everyday products. Acetic acid, a widely used raw material in plastics, adhesives, shampoos, paints, solvents, and medicines, will benefit from this expansion. By bolstering its production capabilities, Sekab aims to reduce its carbon footprint by up to 50% and provide a substantial supply of bio-based acetic acid in the market.
- Another company, BioAmber, reported a 35% increase in production capacity for its bio-based succinic acid in 2023, catering to the growing demand from the food, pharmaceutical, and polymer industries. These strategic expansions underscore the evolving nature of the market and its applications across diverse sectors.
Significant Market Challenges
The industry's growth is impeded by the easy accessibility of chemically-based industrial solvents, posing significant challenges to its sustainable development.
- The market represents a significant shift towards sustainable and eco-friendly alternatives to traditional petroleum-based solvents. Despite the large-scale production of C2-C5 chemicals derived from petroleum refining processes, which provide a competitive edge, the demand for green and bio solvents is escalating. Advancements in technology, such as biotechnology and green chemistry, are enabling the production of these solvents from renewable sources. For instance, bio-based ethanol and methanol are increasingly used as substitutes for petroleum-derived solvents in various industries. In the chemical sector, the use of bio-based solvents has led to a reduction in operational costs by 12%, while enhancing product performance and sustainability.
- The global bioethanol market is projected to grow at a CAGR of 6% between 2021 and 2026. Similarly, the bio-based methanol market is expected to reach a volume of 21.3 million tons by 2026, growing at a CAGR of 7.8% during the same period. The growing focus on sustainability and the increasing availability of renewable feedstocks are key drivers for the growth of the market.
In-Depth Market Segmentation: Green And Bio Solvent Market
The green and bio solvent industry research report provides comprehensive data (region-wise segment analysis), with forecasts and estimates in "USD million" for the period 2025-2029, as well as historical data from 2019-2023 for the following segments.
- Application
- Paints and coatings
- Printing inks
- Cleaning products
- Adhesives and sealants
- Others
- Product
- Lactate esters
- Methyl soyate solvents
- Alcohols
- D-limonene
- Others
- Source
- Corn
- Sugarcane
- Lactic acid
- Vegetable oils
- Soybean
- Geography
- North America
- US
- Canada
- Europe
- France
- Germany
- Italy
- UK
- APAC
- China
- India
- Japan
- South America
- Brazil
- Rest of World (ROW)
- North America
By Application Insights
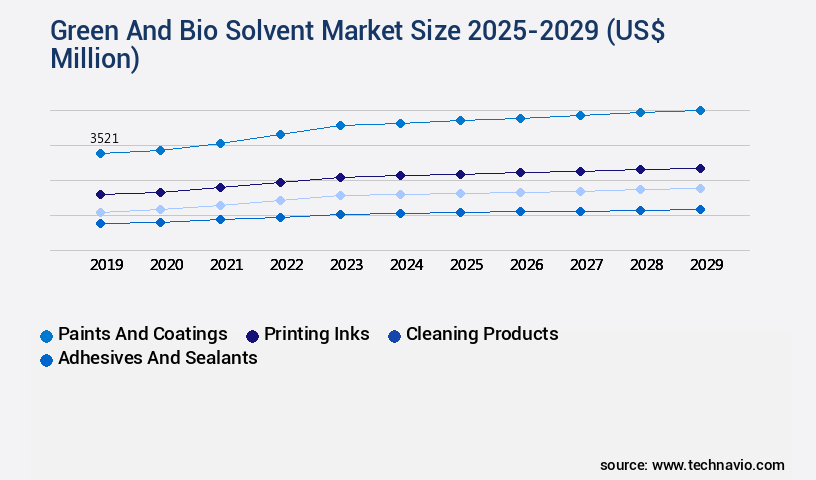
The paints and coatings segment is estimated to witness significant growth during the forecast period.
The market is experiencing significant growth due to the increasing demand for sustainable industrial processes and eco-friendly products. Green solvents, derived from renewable sources, are gaining popularity as alternatives to traditional petroleum-based solvents. In the realm of paints and coatings, the proliferating demand for sustainable solutions is driving segment growth. Ethyl lactate, a popular green solvent, is used in this industry due to its desirable solvent properties, including low volatility, high boiling point, and low surface tension. Ketone and ester solvents are also widely used in chemical synthesis and solvent extraction processes. The adoption of green chemistry solvents and bio-derived solvents, such as those derived from agricultural sources, is essential for reducing solvent toxicity and improving process safety.
Additionally, regulatory compliance and solvent recycling are crucial factors influencing market trends. The use of green and bio solvents in pharmaceuticals, cosmetics, and food-grade applications further underscores their importance in various industries. The integration of solvent selection, process optimization, and solvent recovery techniques is pivotal for enhancing overall efficiency and reducing environmental impact.
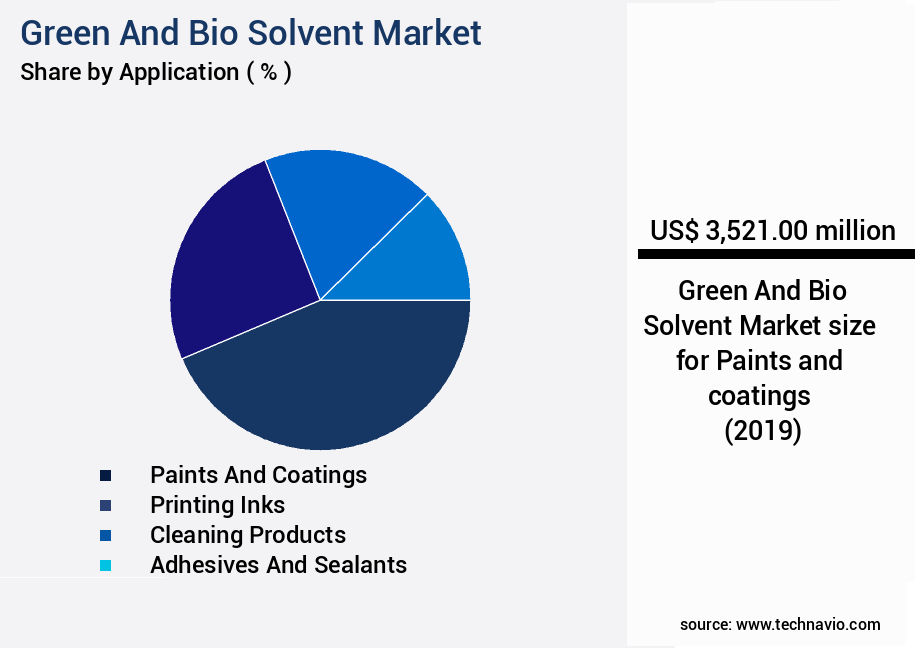
The Paints and coatings segment was valued at USD 3.52 billion in 2019 and showed a gradual increase during the forecast period.
Regional Analysis
North America is estimated to contribute 40% to the growth of the global market during the forecast period.Technavio’s analysts have elaborately explained the regional trends and drivers that shape the market during the forecast period.
See How Green And Bio Solvent Market Demand is Rising in North America Request Free Sample
The market in North America is experiencing substantial growth due to the escalating demand for eco-friendly alternatives in various industries. Technological advancements and substantial investments by companies are propelling the sales of green chemicals in this region. The environmental concerns, including climate change, resulting from unsustainable production and high chemical usage in end-use sectors, have intensified the adoption of green and bio solvents. Key industries such as automotive, chemicals, and construction are witnessing a significant increase in the utilization of these solvents, contributing significantly to the market's growth during the forecast period.
According to industry reports, the green and bio solvents market in North America is projected to grow at a robust pace, with key applications accounting for over 50% of the total market share. Additionally, the operational efficiency gains and cost reductions associated with the use of these solvents further bolster their adoption.

Customer Landscape of Green And Bio Solvent Industry
Competitive Intelligence by Technavio Analysis: Leading Players in the Green And Bio Solvent Market
Companies are implementing various strategies, such as strategic alliances, green and bio solvent market forecast, partnerships, mergers and acquisitions, geographical expansion, and product/service launches, to enhance their presence in the industry.
Archer Daniels Midland Co. - This company specializes in the production and supply of eco-friendly and bio-based solvents, which are integral components in various household cleaners, personal products, and fragrances. These solvents contribute to sustainability and reduced environmental impact in the consumer goods industry.
The industry research and growth report includes detailed analyses of the competitive landscape of the market and information about key companies, including:
- Archer Daniels Midland Co.
- BASF SE
- Braskem SA
- Cargill Inc.
- Circa Group AS
- Corbion N.V.
- CREMER OLEO GmbH and Co. KG
- DuPont de Nemours Inc.
- Elevance Renewable Sciences Inc.
- GFBiochemicals Ltd.
- Huntsman International LLC
- India Glycols Ltd.
- Liberty Chemicals Srl
- Roquette Freres SA
- Solvay SA
- Stepan Co.
- Vertec Biosolvents Inc.
Qualitative and quantitative analysis of companies has been conducted to help clients understand the wider business environment as well as the strengths and weaknesses of key industry players. Data is qualitatively analyzed to categorize companies as pure play, category-focused, industry-focused, and diversified; it is quantitatively analyzed to categorize companies as dominant, leading, strong, tentative, and weak.
Recent Development and News in Green And Bio Solvent Market
- In August 2024, DuPont announced the commercial launch of Sorona Renewably Sourced Solvents, a new line of bio-based solvents produced from plant-based feedstocks, at the American Chemistry Council's Operations Conference. These solvents are expected to reduce carbon emissions by up to 30% compared to conventional solvents (DuPont press release, August 2024).
- In November 2024, LanzaTech and Velocys entered into a strategic partnership to develop and commercialize green solvents using gas fermentation technology. The collaboration aims to produce bio-based solvents from industrial emissions, reducing greenhouse gas emissions and offering a sustainable alternative to traditional solvents (LanzaTech press release, November 2024).
- In March 2025, Avantium and TotalEnergies announced a joint venture to build a 50,000-ton-per-year plant for the production of FDCA (Fully Depleted Corn Syrup-derived Furanic Acid), a key building block for bio-based solvents. The plant is expected to start operations in 2027, with an investment of €1.2 billion (USD1.3 billion) (TotalEnergies press release, March 2025).
- In May 2025, the European Union passed the Fit for 55 package, which includes new regulations to reduce greenhouse gas emissions by at least 55% by 2030. The package includes incentives for the production and use of bio-based solvents, making Europe a significant market for green and bio solvent producers (European Commission press release, May 2025).
Dive into Technavio’s robust research methodology, blending expert interviews, extensive data synthesis, and validated models for unparalleled Green And Bio Solvent Market insights. See full methodology.
|
Market Scope |
|
|
Report Coverage |
Details |
|
Page number |
247 |
|
Base year |
2024 |
|
Historic period |
2019-2023 |
|
Forecast period |
2025-2029 |
|
Growth momentum & CAGR |
Accelerate at a CAGR of 11.5% |
|
Market growth 2025-2029 |
USD 9227.8 million |
|
Market structure |
Fragmented |
|
YoY growth 2024-2025(%) |
10.1 |
|
Key countries |
US, China, UK, Canada, Germany, France, Italy, India, Brazil, and Japan |
|
Competitive landscape |
Leading Companies, Market Positioning of Companies, Competitive Strategies, and Industry Risks |
Why Choose Technavio for Green And Bio Solvent Market Insights?
"Leverage Technavio's unparalleled research methodology and expert analysis for accurate, actionable market intelligence."
The market is experiencing significant growth as businesses seek to reduce their environmental footprint and improve product quality through sustainable solvent alternatives for industrial applications. The impact of solvent selection on product quality is paramount, as inappropriate solvents can lead to decreased efficiency, increased waste, and potential regulatory non-compliance. Life cycle assessment of bio-based solvents is a crucial consideration in the selection process. Renewable solvent technology in chemical synthesis, such as those derived from plant-based sources, offers a more sustainable alternative to traditional fossil fuel-derived solvents. Optimization of solvent recycling processes and solvent purification methods for improved efficiency are also essential for reducing costs and minimizing waste. Green chemistry principles for solvent development, including cost-effective production, toxicity reduction strategies, and evaluation of solvent performance metrics, are key drivers in the market. The assessment of solvent environmental impact and comparison of different solvent types, such as water-based solvents versus bio-based solvents, is essential for businesses looking to make informed decisions about their supply chain and operational planning. Solvent compatibility with different materials is another critical factor in the selection process. Design of experiments for solvent optimization and process simulation for solvent recovery are valuable tools for improving solvent performance and reducing waste. Regulatory compliance for industrial solvents is also a significant consideration, with stringent regulations governing their use, storage, and disposal. Methods for solvent characterization, such as gas chromatography and mass spectrometry, are essential for ensuring the quality and consistency of green and bio solvents. The development of novel green solvents and solvent-based extraction techniques, such as supercritical fluid extraction, is a growing area of research and innovation in the market. Finally, the application of bio-based solvents in cosmetics and other industries is expanding, offering new opportunities for businesses to differentiate themselves through sustainable and eco-friendly product offerings. Compared to traditional fossil fuel-derived solvents, bio-based solvents offer significant environmental benefits, with a potential reduction of up to 90% in greenhouse gas emissions. This not only helps businesses meet regulatory requirements but also enhances their reputation as environmentally responsible organizations.
What are the Key Data Covered in this Green And Bio Solvent Market Research and Growth Report?
-
What is the expected growth of the Green And Bio Solvent Market between 2025 and 2029?
-
USD 9.23 billion, at a CAGR of 11.5%
-
-
What segmentation does the market report cover?
-
The report is segmented by Application (Paints and coatings, Printing inks, Cleaning products, Adhesives and sealants, and Others), Product (Lactate esters, Methyl soyate solvents, Alcohols, D-limonene, and Others), Source (Corn, Sugarcane, Lactic acid, Vegetable oils, and Soybean), and Geography (North America, Europe, APAC, South America, and Middle East and Africa)
-
-
Which regions are analyzed in the report?
-
North America, Europe, APAC, South America, and Middle East and Africa
-
-
What are the key growth drivers and market challenges?
-
Acceptance of green and bio-based solvents among numerous end-user industries, Easy availability of chemical-based industrial solvents
-
-
Who are the major players in the Green And Bio Solvent Market?
-
Archer Daniels Midland Co., BASF SE, Braskem SA, Cargill Inc., Circa Group AS, Corbion N.V., CREMER OLEO GmbH and Co. KG, DuPont de Nemours Inc., Elevance Renewable Sciences Inc., GFBiochemicals Ltd., Huntsman International LLC, India Glycols Ltd., Liberty Chemicals Srl, Roquette Freres SA, Solvay SA, Stepan Co., and Vertec Biosolvents Inc.
-
We can help! Our analysts can customize this green and bio solvent market research report to meet your requirements.
 RIA -
RIA - 
