Green Chemicals Market Analysis North America, Europe, APAC, South America, Middle East and Africa - US, China, Germany, UK, Canada - Size and Forecast 2024-2028

Green Chemicals Market Analysis North America, Europe, APAC, South America, Middle East and Africa - US, China, Germany, UK, Canada - Size and Forecast 2024-2028

Published: Aug 2024 157 Pages SKU: IRTNTR70934

Market Overview at a Glance

$84 B
Market Opportunity
11.66%
CAGR
10.16
YoY growth 2023-2024(%)

Green Chemicals Market Size 2024-2028 

The green chemicals market size is forecast to increase by USD 84 billion at a CAGR of 11.66% between 2023 and 2028.

  • The market is experiencing significant growth due to the increasing scarcity of non-renewable resources and the global shift towards sustainable products. This trend is driven by the demand for eco-friendly alternatives in various industries, including bioethanol and biodiesel in the energy systems sector, and the bioplastic industry, which is gaining traction as a viable solution to reduce single-use plastics. Regulations and legislation are also playing a crucial role in driving market growth, as governments worldwide are implementing policies to reduce carbon emissions and promote clean energy technologies.
  • The biofuel market is expected to continue its upward trajectory, with face shields and personal protective equipment being key applications for green chemicals in the healthcare sector. The lack of availability of raw materials for virgin plastic production is further fueling the demand for green alternatives. In summary, the market is poised for continued expansion as businesses and consumers seek sustainable solutions for various applications, from home care products to advanced electronics. 

What will be the Size of the Green Chemicals Market During the Forecast Period?

Green Chemicals Market Size

 Request Free Sample

  • The market is witnessing significant growth as the demand for sustainable products continues to rise. Traditional chemical manufacturing relies heavily on non-renewable resources, contributing to environmental concerns and regulatory scrutiny. In contrast, green chemicals are derived from renewable sources, such as bioethanol and biodiesel, making them a more sustainable alternative. Regulations and legislation are driving the adoption of green chemicals in various industries. Energy systems and clean energy technologies are leading the charge, as they strive to reduce their carbon footprint and minimize the use of hazardous compounds.

    Furthermore, the biofuel market is also a significant contributor, with bio-based packaging materials gaining popularity due to their non-toxicity and renewable feedstock. The production methods used for green chemicals prioritize sustainable production. Cost-effective processing is crucial to ensure the competitiveness of these products in the market. Animal and plant waste are increasingly being used as raw materials, reducing the reliance on non-renewable resources. Renewable sources, such as bioethanol, biodiesel, and animal and plant waste, are being used to produce bio-based chemicals and packaging materials. Bio-based polymers are also gaining traction as a more sustainable alternative to traditional petroleum-based plastics. The shift towards green chemicals is not only beneficial for the environment but also for the manufacturing industry. By using renewable sources and sustainable production methods, manufacturers can reduce their energy consumption and waste.

How is this market segmented and which is the largest segment?

The market research report provides comprehensive data (region-wise segment analysis), with forecasts and estimates in "USD billion" for the period 2024-2028, as well as historical data from 2018-2022 for the following segments.
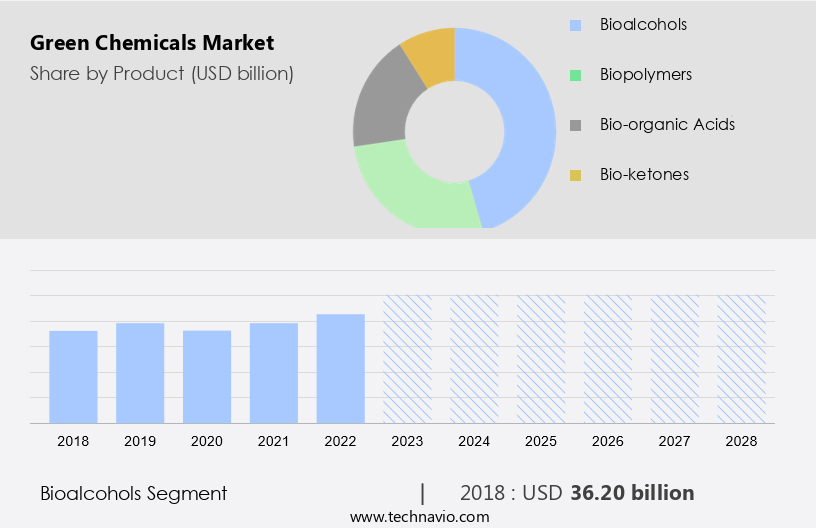
  • Product
    • Bioalcohols
    • Biopolymers
    • Bio-organic acids
    • Bio-ketones
  • Geography
    • North America
      • Canada
      • US
    • Europe
      • Germany
      • UK
    • APAC
      • China
    • South America
    • Middle East and Africa

By Product Insights

  • The bioalcohols segment is estimated to witness significant growth during the forecast period.

The market encompasses the production and utilization of sustainable organic chemicals derived from renewable resources, such as sugar, maize, and corn. These bio-based raw materials are primarily used to produce bioalcohols, which are eco-friendly alternatives to non-renewable resources. Through microbial activities and the fermentation process, sugar and starch are converted into bioalcohols like bioethanol, biobutanol, and biopropanol. Cellulosic biomass, including trees and grasses, can also be processed into bioalcohols after liquefaction. Bioalcohols, such as bioethanol, are essential in various industries, including the Biofuel Market and the Bioplastic Industry. Bioethanol is the most widely used bioalcohol due to its cost-effectiveness and high yields.

Bioethanol is a widely used alternative to gasoline in the automotive sector, serving as a common substitute for petrol. Regulations and legislation significantly influence the market by boosting demand for clean energy technologies and sustainable solutions. Bioethanol and other bioalcohols are utilized in energy systems, such as fuel cells, to produce clean energy. Furthermore, they are employed in the production of personal protective equipment, face shields, and home care products as eco-friendly alternatives to virgin plastic. In addition, they play a vital role in the Laboratory Chemicals sector, supporting various research and industrial applications.

Green Chemicals Market Size

Get a glance at the market report of share of various segments Request Free Sample

The bioalcohols segment was valued at USD 36.20 billion in 2018 and showed a gradual increase during the forecast period.

Regional Analysis

  • North America is estimated to contribute 35% to the growth of the global market during the forecast period.

Technavio's analysts have elaborately explained the regional trends and drivers that shape the market during the forecast period.

Green Chemicals Market Share by Geography

For more insights on the market share of various regions, Request Free Sample

The North American market is projected to expand at a consistent pace over the upcoming years. The United States and Canada are the primary contributors to the region's market growth. The escalating demand for sustainable packaging is fueling the market's expansion in North America. This trend is primarily driven by the increasing awareness of the negative environmental impact of hazardous chemicals used in traditional packaging materials.

Furthermore, advancements in green chemistry technology and substantial investments by market players are further propelling the sales of green chemicals in North America. Since the turn of the century, North America has grappled with environmental concerns, including climate change, due to the extensive use of chemicals and unsustainable production methods. Green chemicals derived from renewable sources, such as bioethanol and bio butanol, are gaining popularity due to their non-toxicity and eco-friendliness. These bio-based chemicals are produced from animal waste, plant waste, and other renewable resources. As a result, the bioethanol and bio butanol segments are expected to dominate the North American market during the forecast period.

Market Dynamics

Our green chemicals market researchers analyzed the data with 2023 as the base year, along with the key drivers, trends, and challenges. A holistic analysis of drivers will help companies refine their marketing strategies to gain a competitive advantage.

What are the key market drivers leading to the rise in the adoption of the Green Chemicals Market?

The scarcity of non-renewable sources is the key driver of the market.

  • The chemical industry relies heavily on energy and traditional hydrocarbon feedstocks, such as methane, derived from non-renewable resources like natural gas, coal, and crude oil. However, the depletion of these reserves and escalating energy prices have necessitated the exploration of sustainable alternatives. Green chemicals, derived from renewable feedstocks like Bio organic acids, Bio ketones, Biopolymers, Bio ethanol, Bio butanol, Bio methanol, Bio alcohols, Bio lactic acid, Bio acetic acid, Bio citric acid, Bio adipic acid, Bio acrylic acid, Bio succinic acid, and Polylactic acid, are gaining traction as viable options.
  • The US Energy Information Administration (EIA) reported a demonstrated reserve base of approximately 473 billion short tons of coal as of October 2020, with around 69% being underground mineable. The increasing energy prices and growing concerns over the environmental impact of conventional energy sources have prompted governments to invest in green chemicals as a sustainable solution.

What are the market trends shaping the Green Chemicals Market?

Green electronics for a sustainable future is the upcoming trend in the market.

  • The global electronic waste generation has escalated in recent years, reaching an estimated 57.4 million metric tons in 2021, according to the UN Global E-waste Monitor 2022 study. This trend is driven by the increasing per capita income, enabling consumers to frequently upgrade their electronic devices such as laptops, computers, televisions, and cellphones. Among these, cell phones and laptops are replaced most frequently. The environmental and health concerns arising from the disposal of electronic waste necessitate the reduction of hazardous chemicals in their production. To address these issues, international electronic companies are focusing on the adoption of green chemicals, including bio-based polymers and sustainable solvents, in their manufacturing processes.
  • These green chemicals are derived from renewable resources and exhibit environmental stewardship. Renewable energy chemicals, such as ethanol, methanol, and butanol, are increasingly used in resin production. Additionally, solvents and catalysts are being replaced with biodegradable polymers for sustainable ink and coating production. Key green chemicals include ethanol, methanol, butanol, acetone, and butanone. Ethanol and methanol are commonly used as solvents and fuel additives, while butanol is used in the production of resins and coatings. Acetone and butanone are used as solvents in various industries. The shift towards green chemicals is expected to gain momentum in the coming years, as companies prioritize sustainability and reduce their carbon footprint.

What challenges does the Green Chemicals Market face during the growth?

Lack of availability of raw materials is a key challenge affecting the market growth.

  • Green chemicals, derived from industrial and agricultural sources, play a crucial role in various sectors including food and beverages, construction, and consumer products. The production of these eco-friendly chemicals relies heavily on renewable feedstocks such as vegetable oils, sugars, and animal fats. However, the cost of these raw materials can be substantial, particularly in large-scale manufacturing processes. For instance, sugar costs may comprise over half of the total production cost for green chemicals. The global decrease in arable land over the past few decades poses a significant challenge to the production of green chemicals. In 1950, the world had more arable land than its population.
  • Regrettably, this has changed, with a third of the arable land lost over the last 40 years. This trend is a major concern for the green chemicals industry, as the availability of renewable feedstocks is essential for sustainable chemical manufacturing. Green chemicals are used extensively in various industries, including food and beverages, construction, and consumer goods. Conventional organic acids with a carboxyl group are widely used in food and beverage production. Bio-based chemicals, derived from renewable feedstock, are gaining popularity due to their lower energy consumption and reduced waste generation. In agriculture, green chemicals are used as fertilizers and pesticides, contributing to more sustainable farming practices.

Exclusive Customer Landscape

The green chemicals market forecasting report includes the adoption lifecycle of the market, covering from the innovator's stage to the laggard's stage. It focuses on adoption rates in different regions based on penetration. Furthermore, the market report also includes key purchase criteria and drivers of price sensitivity to help companies evaluate and develop their market growth analysis strategies.

Green Chemicals Market Share by Geography

 Customer Landscape

Key Companies & Market Insights

Companies are implementing various strategies, such as strategic alliances, market forecast, partnerships, mergers and acquisitions, geographical expansion, and product/service launches, to enhance their presence in the market. The green chemicals market research and growth report includes detailed analyses of the competitive landscape of the market and information about key companies, including:

  • Arkema Group.
  • Balfour Beatty Plc
  • BASF SE
  • Bio Kleen
  • Cargill Inc.
  • DuPont de Nemours Inc.
  • Evonik Industries AG
  • George Weston Foods Ltd.
  • GFBiochemicals Ltd.
  • Givaudan SA
  • GREENCHEMICALS Spa
  • JSW Cement Ltd.
  • Koninklijke DSM NV
  • Mitsubishi Chemical Group Corp.
  • NatureWorks LLC
  • Novamont S.p.A.
  • Novonor
  • Plantic Technologies Ltd.
  • Toray Industries Inc.
  • TotalEnergies SE
  • Vertec Biosolvents Inc.

Qualitative and quantitative analysis of companies has been conducted to help clients understand the wider business environment as well as the strengths and weaknesses of key market players. Data is qualitatively analyzed to categorize companies as pure play, category-focused, industry-focused, and diversified; it is quantitatively analyzed to categorize companies as dominant, leading, strong, tentative, and weak.

Research Analyst Overview

The market is experiencing significant growth due to the increasing demand for sustainable products derived from renewable resources. Traditional chemicals, which are largely derived from non-renewable resources, contribute to environmental degradation, climate change, and resource depletion through the emission of greenhouse gases and the use of fossil fuels. In contrast, green chemicals are produced using clean energy technologies such as solar, wind, and bioenergy. Bioethanol and biodiesel are prominent green chemicals in the market, with bioethanol derived from lignocellulosic biomass through fermentation. The biofuel market and bioplastic industry are major consumers of these green chemicals. Single use plastics, such as face shields and personal protective equipment, are being replaced with bio-based packaging materials, reducing the reliance on virgin plastic.

Furthermore, regulations and legislation are driving the adoption of green chemicals in various industries, including home care products, animal feed, and industrial chemicals. The bio-based chemicals segment, which includes alcohols, bio-organic acids, bio ketones, and biopolymers, is expected to grow significantly due to their non-toxicity and biodegradability. Cost-effective processing of renewable sources, such as animal waste and plant waste, is a key factor in the growth of the market. The market also includes sustainable solvents, catalysts, and biodegradable polymers, which are used in various industries, including food and beverages, construction, and consumer goods. Renewable energy chemicals, such as ethanol, methanol, butanol, acetone, and butanone, are also gaining popularity due to their role in renewable energy systems.

Green Chemicals Market Scope

Report Coverage

Details

Page number

157

Base year

2023

Historic period

2018-2022

Forecast period

2024-2028

Growth momentum & CAGR

Accelerate at a CAGR of 11.66%

Market Growth 2024-2028

USD 84 billion

Market structure

Fragmented

YoY growth 2023-2024(%)

10.16

Key countries

US, China, Germany, UK, and Canada

Competitive landscape

Leading Companies, Market Positioning of Companies, Competitive Strategies, and Industry Risks

Request Free Sample

What are the Key Data Covered in this Market Research and Growth Report?

  • CAGR of the market during the forecast period
  • Detailed information on factors that will drive the market growth and forecasting between 2024 and 2028
  • Precise estimation of the size of the market  and its contribution of the market in focus to the parent market
  • Accurate predictions about upcoming market growth and trends and changes in consumer behaviour
  • Growth of the market across North America, Europe, APAC, South America, and Middle East and Africa
  • Thorough analysis of the market's competitive landscape and detailed information about companies
  • Comprehensive analysis of factors that will challenge the growth of market companies

We can help! Our analysts can customize this market research report to meet your requirements. Get in touch

1 Executive Summary

  • 1.1 Market overview
    • Executive Summary - Chart on Market Overview
    • Executive Summary - Data Table on Market Overview
    • Executive Summary - Chart on Global Market Characteristics
    • Executive Summary - Chart on Market by Geography
    • Executive Summary - Chart on Market Segmentation by Product
    • Executive Summary - Chart on Incremental Growth
    • Executive Summary - Data Table on Incremental Growth
    • Executive Summary - Chart on Company Market Positioning

2 Market Landscape

  • 2.1 Market ecosystem
    • Parent Market
    • Data Table on - Parent Market
  • 2.2 Market characteristics
    • Market characteristics analysis
  • 2.3 Value chain analysis
    • Value Chain Analysis

3 Market Sizing

  • 3.1 Market definition
    • Offerings of companies included in the market definition
  • 3.2 Market segment analysis
    • Market segments
  • 3.3 Market size 2023
    • 3.4 Market outlook: Forecast for 2023-2028
      • Chart on Global - Market size and forecast 2023-2028 ($ billion)
      • Data Table on Global - Market size and forecast 2023-2028 ($ billion)
      • Chart on Global Market: Year-over-year growth 2023-2028 (%)
      • Data Table on Global Market: Year-over-year growth 2023-2028 (%)

    4 Historic Market Size

    • 4.1 Global Green Chemicals Market 2018 - 2022
      • Historic Market Size - Data Table on Global Green Chemicals Market 2018 - 2022 ($ billion)
    • 4.2 Product segment analysis 2018 - 2022
      • Historic Market Size - Product Segment 2018 - 2022 ($ billion)
    • 4.3 Geography segment analysis 2018 - 2022
      • Historic Market Size - Geography Segment 2018 - 2022 ($ billion)
    • 4.4 Country segment analysis 2018 - 2022
      • Historic Market Size - Country Segment 2018 - 2022 ($ billion)

    5 Five Forces Analysis

    • 5.1 Five forces summary
      • Five forces analysis - Comparison between 2023 and 2028
    • 5.2 Bargaining power of buyers
      • Bargaining power of buyers - Impact of key factors 2023 and 2028
    • 5.3 Bargaining power of suppliers
      • Bargaining power of suppliers - Impact of key factors in 2023 and 2028
    • 5.4 Threat of new entrants
      • Threat of new entrants - Impact of key factors in 2023 and 2028
    • 5.5 Threat of substitutes
      • Threat of substitutes - Impact of key factors in 2023 and 2028
    • 5.6 Threat of rivalry
      • Threat of rivalry - Impact of key factors in 2023 and 2028
    • 5.7 Market condition
      • Chart on Market condition - Five forces 2023 and 2028

    6 Market Segmentation by Product

    • 6.1 Market segments
      • Chart on Product - Market share 2023-2028 (%)
      • Data Table on Product - Market share 2023-2028 (%)
    • 6.2 Comparison by Product
      • Chart on Comparison by Product
      • Data Table on Comparison by Product
    • 6.3 Bioalcohols - Market size and forecast 2023-2028
      • Chart on Bioalcohols - Market size and forecast 2023-2028 ($ billion)
      • Data Table on Bioalcohols - Market size and forecast 2023-2028 ($ billion)
      • Chart on Bioalcohols - Year-over-year growth 2023-2028 (%)
      • Data Table on Bioalcohols - Year-over-year growth 2023-2028 (%)
    • 6.4 Biopolymers - Market size and forecast 2023-2028
      • Chart on Biopolymers - Market size and forecast 2023-2028 ($ billion)
      • Data Table on Biopolymers - Market size and forecast 2023-2028 ($ billion)
      • Chart on Biopolymers - Year-over-year growth 2023-2028 (%)
      • Data Table on Biopolymers - Year-over-year growth 2023-2028 (%)
    • 6.5 Bio-organic acids - Market size and forecast 2023-2028
      • Chart on Bio-organic acids - Market size and forecast 2023-2028 ($ billion)
      • Data Table on Bio-organic acids - Market size and forecast 2023-2028 ($ billion)
      • Chart on Bio-organic acids - Year-over-year growth 2023-2028 (%)
      • Data Table on Bio-organic acids - Year-over-year growth 2023-2028 (%)
    • 6.6 Bio-ketones - Market size and forecast 2023-2028
      • Chart on Bio-ketones - Market size and forecast 2023-2028 ($ billion)
      • Data Table on Bio-ketones - Market size and forecast 2023-2028 ($ billion)
      • Chart on Bio-ketones - Year-over-year growth 2023-2028 (%)
      • Data Table on Bio-ketones - Year-over-year growth 2023-2028 (%)
    • 6.7 Market opportunity by Product
      • Market opportunity by Product ($ billion)
      • Data Table on Market opportunity by Product ($ billion)

    7 Customer Landscape

    • 7.1 Customer landscape overview
      • Analysis of price sensitivity, lifecycle, customer purchase basket, adoption rates, and purchase criteria

    8 Geographic Landscape

    • 8.1 Geographic segmentation
      • Chart on Market share by geography 2023-2028 (%)
      • Data Table on Market share by geography 2023-2028 (%)
    • 8.2 Geographic comparison
      • Chart on Geographic comparison
      • Data Table on Geographic comparison
    • 8.3 North America - Market size and forecast 2023-2028
      • Chart on North America - Market size and forecast 2023-2028 ($ billion)
      • Data Table on North America - Market size and forecast 2023-2028 ($ billion)
      • Chart on North America - Year-over-year growth 2023-2028 (%)
      • Data Table on North America - Year-over-year growth 2023-2028 (%)
    • 8.4 Europe - Market size and forecast 2023-2028
      • Chart on Europe - Market size and forecast 2023-2028 ($ billion)
      • Data Table on Europe - Market size and forecast 2023-2028 ($ billion)
      • Chart on Europe - Year-over-year growth 2023-2028 (%)
      • Data Table on Europe - Year-over-year growth 2023-2028 (%)
    • 8.5 APAC - Market size and forecast 2023-2028
      • Chart on APAC - Market size and forecast 2023-2028 ($ billion)
      • Data Table on APAC - Market size and forecast 2023-2028 ($ billion)
      • Chart on APAC - Year-over-year growth 2023-2028 (%)
      • Data Table on APAC - Year-over-year growth 2023-2028 (%)
    • 8.6 South America - Market size and forecast 2023-2028
      • Chart on South America - Market size and forecast 2023-2028 ($ billion)
      • Data Table on South America - Market size and forecast 2023-2028 ($ billion)
      • Chart on South America - Year-over-year growth 2023-2028 (%)
      • Data Table on South America - Year-over-year growth 2023-2028 (%)
    • 8.7 Middle East and Africa - Market size and forecast 2023-2028
      • Chart on Middle East and Africa - Market size and forecast 2023-2028 ($ billion)
      • Data Table on Middle East and Africa - Market size and forecast 2023-2028 ($ billion)
      • Chart on Middle East and Africa - Year-over-year growth 2023-2028 (%)
      • Data Table on Middle East and Africa - Year-over-year growth 2023-2028 (%)
    • 8.8 US - Market size and forecast 2023-2028
      • Chart on US - Market size and forecast 2023-2028 ($ billion)
      • Data Table on US - Market size and forecast 2023-2028 ($ billion)
      • Chart on US - Year-over-year growth 2023-2028 (%)
      • Data Table on US - Year-over-year growth 2023-2028 (%)
    • 8.9 China - Market size and forecast 2023-2028
      • Chart on China - Market size and forecast 2023-2028 ($ billion)
      • Data Table on China - Market size and forecast 2023-2028 ($ billion)
      • Chart on China - Year-over-year growth 2023-2028 (%)
      • Data Table on China - Year-over-year growth 2023-2028 (%)
    • 8.10 Germany - Market size and forecast 2023-2028
      • Chart on Germany - Market size and forecast 2023-2028 ($ billion)
      • Data Table on Germany - Market size and forecast 2023-2028 ($ billion)
      • Chart on Germany - Year-over-year growth 2023-2028 (%)
      • Data Table on Germany - Year-over-year growth 2023-2028 (%)
    • 8.11 UK - Market size and forecast 2023-2028
      • Chart on UK - Market size and forecast 2023-2028 ($ billion)
      • Data Table on UK - Market size and forecast 2023-2028 ($ billion)
      • Chart on UK - Year-over-year growth 2023-2028 (%)
      • Data Table on UK - Year-over-year growth 2023-2028 (%)
    • 8.12 Canada - Market size and forecast 2023-2028
      • Chart on Canada - Market size and forecast 2023-2028 ($ billion)
      • Data Table on Canada - Market size and forecast 2023-2028 ($ billion)
      • Chart on Canada - Year-over-year growth 2023-2028 (%)
      • Data Table on Canada - Year-over-year growth 2023-2028 (%)
    • 8.13 Market opportunity by geography
      • Market opportunity by geography ($ billion)
      • Data Tables on Market opportunity by geography ($ billion)

    9 Drivers, Challenges, and Opportunity/Restraints

    • 9.1 Market drivers
      • 9.2 Market challenges
        • 9.3 Impact of drivers and challenges
          • Impact of drivers and challenges in 2023 and 2028
        • 9.4 Market opportunities/restraints

          10 Competitive Landscape

          • 10.1 Overview
            • 10.2 Competitive Landscape
              • Overview on criticality of inputs and factors of differentiation
            • 10.3 Landscape disruption
              • Overview on factors of disruption
            • 10.4 Industry risks
              • Impact of key risks on business

            11 Competitive Analysis

            • 11.1 Companies profiled
              • Companies covered
            • 11.2 Market positioning of companies
              • Matrix on companies position and classification
            • 11.3 Arkema Group.
              • Arkema Group. - Overview
              • Arkema Group. - Business segments
              • Arkema Group. - Key news
              • Arkema Group. - Key offerings
              • Arkema Group. - Segment focus
            • 11.4 BASF SE
              • BASF SE - Overview
              • BASF SE - Business segments
              • BASF SE - Key news
              • BASF SE - Key offerings
              • BASF SE - Segment focus
            • 11.5 Cargill Inc.
              • Cargill Inc. - Overview
              • Cargill Inc. - Product / Service
              • Cargill Inc. - Key news
              • Cargill Inc. - Key offerings
            • 11.6 DuPont de Nemours Inc.
              • DuPont de Nemours Inc. - Overview
              • DuPont de Nemours Inc. - Business segments
              • DuPont de Nemours Inc. - Key news
              • DuPont de Nemours Inc. - Key offerings
              • DuPont de Nemours Inc. - Segment focus
            • 11.7 Evonik Industries AG
              • Evonik Industries AG - Overview
              • Evonik Industries AG - Business segments
              • Evonik Industries AG - Key news
              • Evonik Industries AG - Key offerings
              • Evonik Industries AG - Segment focus
            • 11.8 GREENCHEMICALS Spa
              • GREENCHEMICALS Spa - Overview
              • GREENCHEMICALS Spa - Product / Service
              • GREENCHEMICALS Spa - Key offerings
            • 11.9 Koninklijke DSM NV
              • Koninklijke DSM NV - Overview
              • Koninklijke DSM NV - Business segments
              • Koninklijke DSM NV - Key news
              • Koninklijke DSM NV - Key offerings
              • Koninklijke DSM NV - Segment focus
            • 11.10 Mitsubishi Chemical Group Corp.
              • Mitsubishi Chemical Group Corp. - Overview
              • Mitsubishi Chemical Group Corp. - Business segments
              • Mitsubishi Chemical Group Corp. - Key news
              • Mitsubishi Chemical Group Corp. - Key offerings
              • Mitsubishi Chemical Group Corp. - Segment focus
            • 11.11 Toray Industries Inc.
              • Toray Industries Inc. - Overview
              • Toray Industries Inc. - Business segments
              • Toray Industries Inc. - Key news
              • Toray Industries Inc. - Key offerings
              • Toray Industries Inc. - Segment focus
            • 11.12 TotalEnergies SE
              • TotalEnergies SE - Overview
              • TotalEnergies SE - Business segments
              • TotalEnergies SE - Key news
              • TotalEnergies SE - Key offerings
              • TotalEnergies SE - Segment focus

            12 Appendix

            • 12.1 Scope of the report
              • 12.2 Inclusions and exclusions checklist
                • Inclusions checklist
                • Exclusions checklist
              • 12.3 Currency conversion rates for US$
                • Currency conversion rates for US$
              • 12.4 Research methodology
                • Research methodology
              • 12.5 Data procurement
                • Information sources
              • 12.6 Data validation
                • Data validation
              • 12.7 Validation techniques employed for market sizing
                • Validation techniques employed for market sizing
              • 12.8 Data synthesis
                • Data synthesis
              • 12.9 360 degree market analysis
                • 360 degree market analysis
              • 12.10 List of abbreviations
                • List of abbreviations

              Research Methodology

              Technavio presents a detailed picture of the market by way of study, synthesis, and summation of data from multiple sources. The analysts have presented the various facets of the market with a particular focus on identifying the key industry influencers. The data thus presented is comprehensive, reliable, and the result of extensive research, both primary and secondary.

              INFORMATION SOURCES

              Primary sources

              • Manufacturers and suppliers
              • Channel partners
              • Industry experts
              • Strategic decision makers

              Secondary sources

              • Industry journals and periodicals
              • Government data
              • Financial reports of key industry players
              • Historical data
              • Press releases

              DATA ANALYSIS

              Data Synthesis

              • Collation of data
              • Estimation of key figures
              • Analysis of derived insights

              Data Validation

              • Triangulation with data models
              • Reference against proprietary databases
              • Corroboration with industry experts

              REPORT WRITING

              Qualitative

              • Market drivers
              • Market challenges
              • Market trends
              • Five forces analysis

              Quantitative

              • Market size and forecast
              • Market segmentation
              • Geographical insights
              • Competitive landscape

              Interested in this report?

              Get your sample now to see our research methodology and insights!

              Download Now

              Frequently Asked Questions

              Green Chemicals market growth will increase by $ 84 bn during 2024-2028.

              The Green Chemicals market is expected to grow at a CAGR of 11.66% during 2024-2028.

              Green Chemicals market is segmented by Product( Bioalcohols, Biopolymers, Bio-organic acids, Bio-ketones)

              Arkema Group., Balfour Beatty Plc, BASF SE, Bio Kleen, Cargill Inc., DuPont de Nemours Inc., Evonik Industries AG, George Weston Foods Ltd., GFBiochemicals Ltd., Givaudan SA, GREENCHEMICALS Spa, JSW Cement Ltd., Koninklijke DSM NV, Mitsubishi Chemical Group Corp., NatureWorks LLC, Novamont S.p.A., Novonor, Plantic Technologies Ltd., Toray Industries Inc., TotalEnergies SE, Vertec Biosolvents Inc. are a few of the key vendors in the Green Chemicals market.

              North America will register the highest growth rate of 35% among the other regions. Therefore, the Green Chemicals market in North America is expected to garner significant business opportunities for the vendors during the forecast period.

              US, China, Germany, UK, Canada

              • Scarcity of non-renewable sourcesEnergy and basic hydrocarbon raw materials such as methane play an integral role in the chemical and related manufacturing industries to produce chemicals. Fossil fuels are valuable sources of energy and feedstock. However is the driving factor this market.
              • high prices and depletion of fossil feedstock reserves such as natural gas is the driving factor this market.
              • coal is the driving factor this market.
              • and crude oil have demanded exploration for alternatives to energy and feedstocks for the chemical industry. As of October 2020 is the driving factor this market.
              • the US Energy Information Administration (EIA) estimated that the demonstrated reserve base (DRB) was about 473 billion short tons is the driving factor this market.
              • of which about 69% was underground mineable coal.The rise in energy prices and growing awareness of the hazardous effects of conventional energy sources has led governments to invest in alternatives such as green chemicals. Green chemicals can help in meeting the growing demand for energy without adversely affecting the environment. Government initiatives with respect to sustainable energy are also driving the demand for green chemicals globally. Vehicles and power plants that run on fossil fuels are considered major causes of global warming. Large quantities of gasses such as methane is the driving factor this market.
              • carbon dioxide is the driving factor this market.
              • and nitrogen oxide is the driving factor this market.
              • liberated by the combustion of fossil fuels is the driving factor this market.
              • trap heat in the atmosphere is the driving factor this market.
              • which has been causing the greenhouse effect. The processing of these fossil fuels also contributes to pollution. Therefore is the driving factor this market.
              • sustainable alternative fuels such as hydrogen is the driving factor this market.
              • bioethanol is the driving factor this market.
              • and biodiesel (made from vegetable oil) are developed to curb harmful emissions. These alternatives will produce negligible quantities of exhaust pollutants or greenhouse gases. Alternative bio-based resources are used to manufacture green chemicals that have an important contribution to producing materials and energy in the upcoming years.  is the driving factor this market.

              The Green Chemicals market vendors should focus on grabbing business opportunities from the Bioalcohols segment as it accounted for the largest market share in the base year.