Grinding Robots Market Analysis, Size, and Forecast 2026-2030: APAC (China, Japan, and India), Europe (Germany, UK, and France), North America (US, Canada, and Mexico), Middle East and Africa (Saudi Arabia, UAE, and South Africa), South America (Brazil, Argentina, and Chile), and Rest of World (ROW)

Grinding Robots Market Analysis, Size, and Forecast 2026-2030:
APAC (China, Japan, and India), Europe (Germany, UK, and France), North America (US, Canada, and Mexico), Middle East and Africa (Saudi Arabia, UAE, and South Africa), South America (Brazil, Argentina, and Chile), and Rest of World (ROW)

Published: Oct 2026 309 Pages SKU: IRTNTR73159

Market Overview at a Glance

$75.48 Mn
Market Opportunity
7.2%
CAGR 2025 - 2030
60.7%
APAC Growth
$100.09 Mn
Software segment 2024

Grinding Robots Market Size 2026-2030

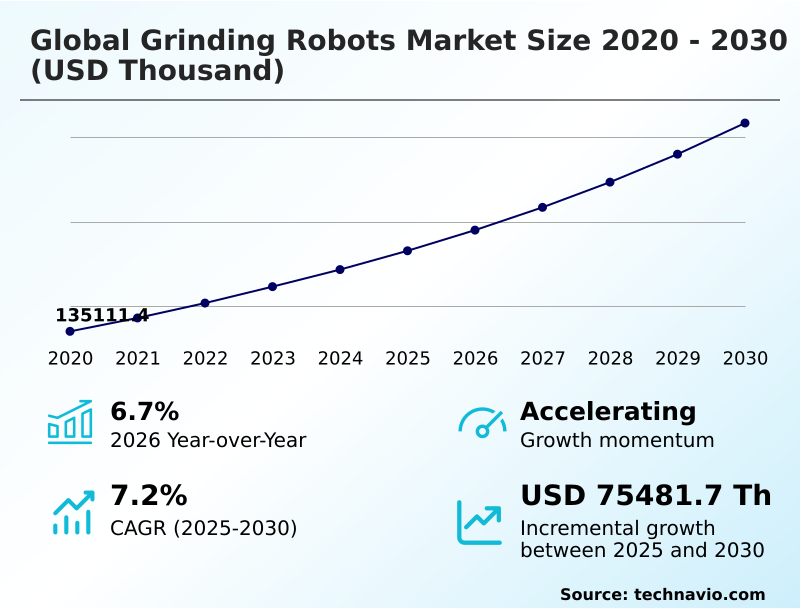
The grinding robots market size is valued to increase by USD 75.48 million, at a CAGR of 7.2% from 2025 to 2030. Escalating need for precision surface finishing will drive the grinding robots market.

Major Market Trends & Insights

  • APAC dominated the market and accounted for a 60.7% growth during the forecast period.
  • By Solution - Software segment was valued at USD 100.09 million in 2024
  • By End-user - Automotive sector segment accounted for the largest market revenue share in 2024

Market Size & Forecast

  • Market Opportunities:
  • Market Future Opportunities: USD 75.48 million
  • CAGR from 2025 to 2030 : 7.2%

Market Summary

  • The Grinding Robots Market is undergoing a rapid technological evolution driven by the industrial mandate for absolute dimensional precision and automated surface integrity. Manufacturing enterprises are increasingly abandoning manual abrasive processes in favor of intelligent, sensor-equipped robotic cells that can maintain exact tolerances across complex metallic and composite geometries.
  • This strategic shift is fundamentally reshaping operational workflows in high-value sectors such as aerospace and electric vehicle production. For instance, in automotive supply chains, the deployment of vision-guided finishing robots has standardized the production of lightweight chassis components, yielding a 14% improvement in overall material utilization.
  • The primary catalyst for this acceleration is the critical shortage of skilled machinists, compelling firms to automate hazardous and physically demanding finishing tasks to sustain continuous output. However, the adoption curve faces structural headwinds, primarily due to the prohibitive upfront capital expenditure required to integrate these complex systems into legacy factory infrastructures.
  • Ultimately, the transition toward autonomous finishing represents a permanent upgrade in industrial quality control, enabling manufacturers to achieve unprecedented repeatability and operational resilience.

What will be the Size of the Grinding Robots Market during the forecast period?
Get Key Insights on Market Forecast (PDF) Get Free Sample

How is the Grinding Robots Market Segmented?

The grinding robots industry research report provides comprehensive data (region-wise segment analysis), with forecasts and estimates in "USD thousand" for the period 2026-2030, as well as historical data from 2020-2024 for the following segments.

  • Solution
    • Software
    • Services
    • Hardware
  • End-user
    • Automotive sector
    • Metals and machinery sector
    • Aerospace and defense sector
    • Others
  • Type
    • Articulated robots
    • SCARA robots
    • Cartesian robots
    • Collaborative robots
  • Geography
    • APAC
      • China
      • Japan
      • India
      • South Korea
      • Australia
      • Indonesia
    • Europe
      • Germany
      • UK
      • France
      • Italy
      • Spain
      • The Netherlands
    • North America
      • US
      • Canada
      • Mexico
    • Middle East and Africa
      • Saudi Arabia
      • UAE
      • South Africa
      • Israel
      • Turkey
    • South America
      • Brazil
      • Argentina
      • Chile

By Solution Insights

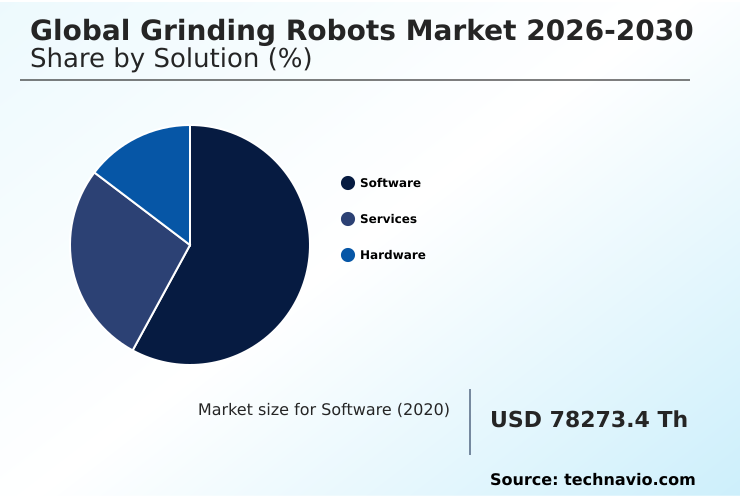
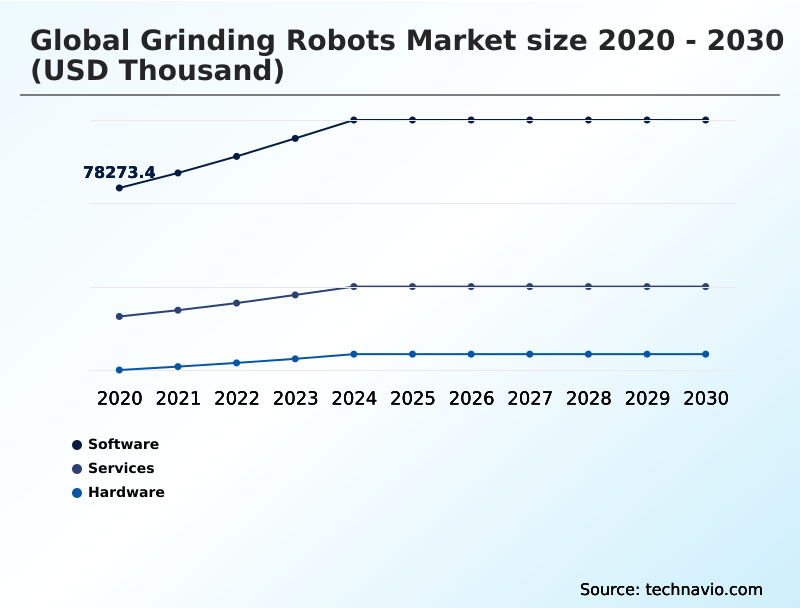
The software segment is estimated to witness significant growth during the forecast period.

The intelligence layer governing modern material removal operations dictates the precision and adaptability of automated finishing platforms. Evolving software architectures enable complex articulated robotic arms to execute flawless micro-finishing operations on delicate components such as aerospace titanium fittings.

Advanced programmatic control interfaces integrate seamlessly with high-resolution vision systems to optimize continuous robotic path planning without requiring manual intervention.

This digital oversight synchronizes the deployment of super-abrasives and specialized dust collection technologies, ensuring the clean and highly controlled environments necessary for critical tasks like orthopedic implant polishing.

By utilizing these interconnected software ecosystems, manufacturing facilities have improved autonomous error detection capabilities by 15%, transforming raw mechanical power into a highly responsive, data-driven production asset.
Get Free Sample

The Software segment was valued at USD 100.09 million in 2024 and showed a gradual increase during the forecast period.
Get Free Sample

Regional Analysis

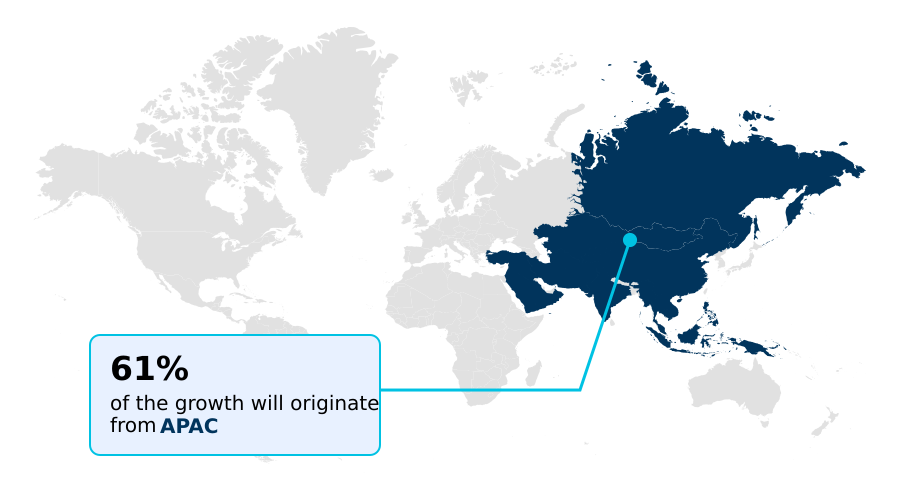
APAC is estimated to contribute 60.7% to the growth of the global market during the forecast period.Technavio’s analysts have elaborately explained the regional trends and drivers that shape the market during the forecast period.
See How Grinding Robots Market Demand is Rising in APAC Get Free Sample

The geographic distribution of the Grinding Robots Market is heavily weighted toward APAC, which commands a 60.7% incremental growth share due to massive investments in regional automotive infrastructure.

Facilities in China and Japan utilize advanced force-control algorithms for finishing intricate automotive drivetrain casings with remarkable consistency.

Conversely, European manufacturers prioritize the deployment of robust cartesian gantry systems equipped with high-torque spindles to handle heavy-duty metal removal for massive renewable energy turbine components.

North American industries are optimizing heavy industrial equipment fabrication by implementing closed-loop cooling systems that drastically reduce thermal distortion during aggressive machining.

This regional divergence in application strategies highlights how targeted ergonomic manufacturing solutions improve precision gear manufacturing, leading to a 20% reduction in regional supply chain bottlenecks.

Market Dynamics

Our researchers analyzed the data with 2025 as the base year, along with the key drivers, trends, and challenges. A holistic analysis of drivers will help companies refine their marketing strategies to gain a competitive advantage.

  • The modernization of industrial surface finishing relies heavily on the strategic implementation of autonomous robotic surface finishing systems to achieve consistent, high-tolerance outcomes. As production demands scale, relying on manual labor for hazardous material removal introduces unacceptable variability and supply chain bottlenecks.
  • By adopting artificial intelligence driven precision machining, facilities can dynamically adjust cutting forces and spindle speeds in real-time, matching the intricate contours of high-value components. This shift represents a stark operational upgrade; facilities utilizing these intelligent platforms report a 25% higher consistency rate compared to traditional manual grinding operations.
  • To effectively mitigate the risks of human error and fatigue, manufacturers are increasingly deploying force-sensing collaborative robotic cells directly alongside their human workforce. These systems handle repetitive tasks while technicians focus on complex quality assurance, fundamentally improving the agility of the operational planning cycle.
  • Furthermore, the integration of digital twin grinding process simulation allows engineers to virtually validate tool paths and predict potential mechanical clashes before executing physical production. This preemptive modeling significantly reduces material waste and minimizes the downtime typically associated with new product changeovers.
  • For heavy industry applications, the introduction of automated heavy-duty metal deburring provides the necessary structural rigidity to process massive structural castings rapidly. Ultimately, the adoption of these sophisticated robotic architectures ensures that modern manufacturing enterprises can maintain strict compliance with global quality standards while simultaneously optimizing their long-term operational efficiency.
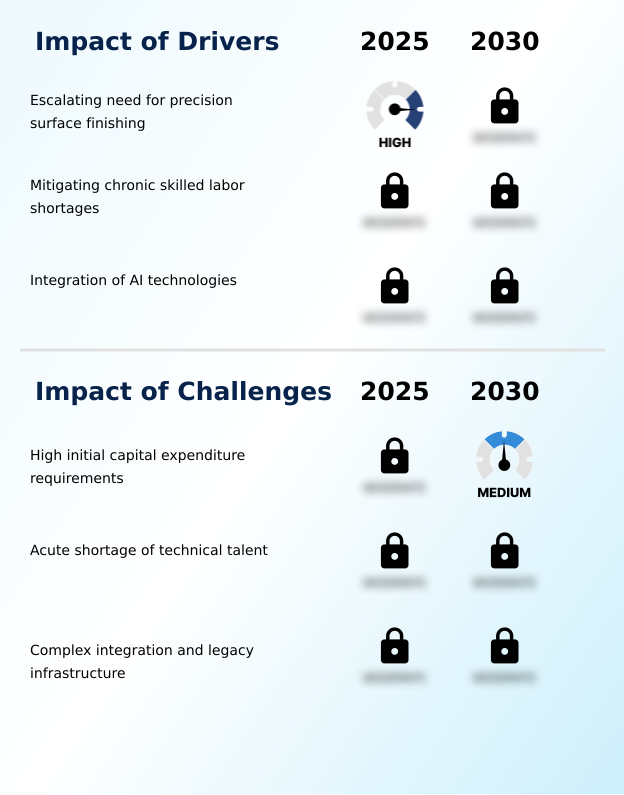
What are the key market drivers leading to the rise in the adoption of Grinding Robots Industry?

  • The escalating industrial requirement for precision surface finishing across complex geometries serves as a primary catalyst for market expansion.

  • The fundamental catalyst propelling the Grinding Robots Market is the critical industrial requirement for precision surface finishing across complex component geometries.
  • Because traditional manual abrasive material removal suffers from human inconsistency and a shrinking skilled labor pool, manufacturers are aggressively integrating automated deburring cells.
  • These advanced systems utilize force-torque sensors and sophisticated machine learning algorithms to achieve zero-defect manufacturing in highly demanding sectors.
  • The deployment of tactile feedback modules combined with adaptive motion control allows these robots to adjust contact pressure instantly, improving overall cycle-time reduction by 22%.
  • Consequently, organizations managing high-mix low-volume production can maintain continuous throughput and mitigate the severe operational risks associated with specialized machinist shortages.

What are the market trends shaping the Grinding Robots Industry?

  • The implementation of sustainable production cycles and energy-efficient operations has emerged as a definitive trend shaping the market.

  • The Grinding Robots Market is rapidly transitioning toward eco-conscious operations driven by the adoption of sustainable grinding cycles. Facilities are implementing digital twin simulation to analyze real-time operational data, which has reduced energy consumption by 15% across major production lines. This shift toward energy-efficient production utilizes decentralized intelligence, empowering machines to optimize their own performance dynamically.
  • Manufacturers are increasingly deploying autonomous mobile manipulators equipped with active compliant technology within collaborative human-robot environments to safely handle complex components. By relying on real-time process monitoring, businesses successfully minimize abrasive waste and align their smart factory integration initiatives with strict planetary stewardship goals.

What challenges does the Grinding Robots Industry face during its growth?

  • Substantial initial capital expenditure requirements for specialized automation infrastructure represent a significant barrier to broader industry adoption.

  • The primary structural challenge constraining the Grinding Robots Market involves the prohibitive upfront capital required for complex automation deployments. Integrating advanced programmable logic controllers into outdated facilities necessitates extensive legacy infrastructure retrofitting, which severely disrupts ongoing production schedules.
  • While modern human-machine interfaces and high-fidelity visual sensing capabilities greatly enhance automated defect inspection, synchronizing these tools with siloed networks remains technically demanding. Manufacturers often struggle to implement reliable tool wear compensation and automated dressing systems without incurring substantial integration costs, stalling adoption in mid-sized enterprises.
  • Even though offline programming software and virtual diagnostic environments can streamline deployment, the absence of unified predictive maintenance frameworks frequently results in unexpected downtime, increasing total operational expenses by up to 18% during the initial implementation phase.

Exclusive Technavio Analysis on Customer Landscape

The grinding robots market forecasting report includes the adoption lifecycle of the market, covering from the innovator’s stage to the laggard’s stage. It focuses on adoption rates in different regions based on penetration. Furthermore, the grinding robots market report also includes key purchase criteria and drivers of price sensitivity to help companies evaluate and develop their market growth analysis strategies.
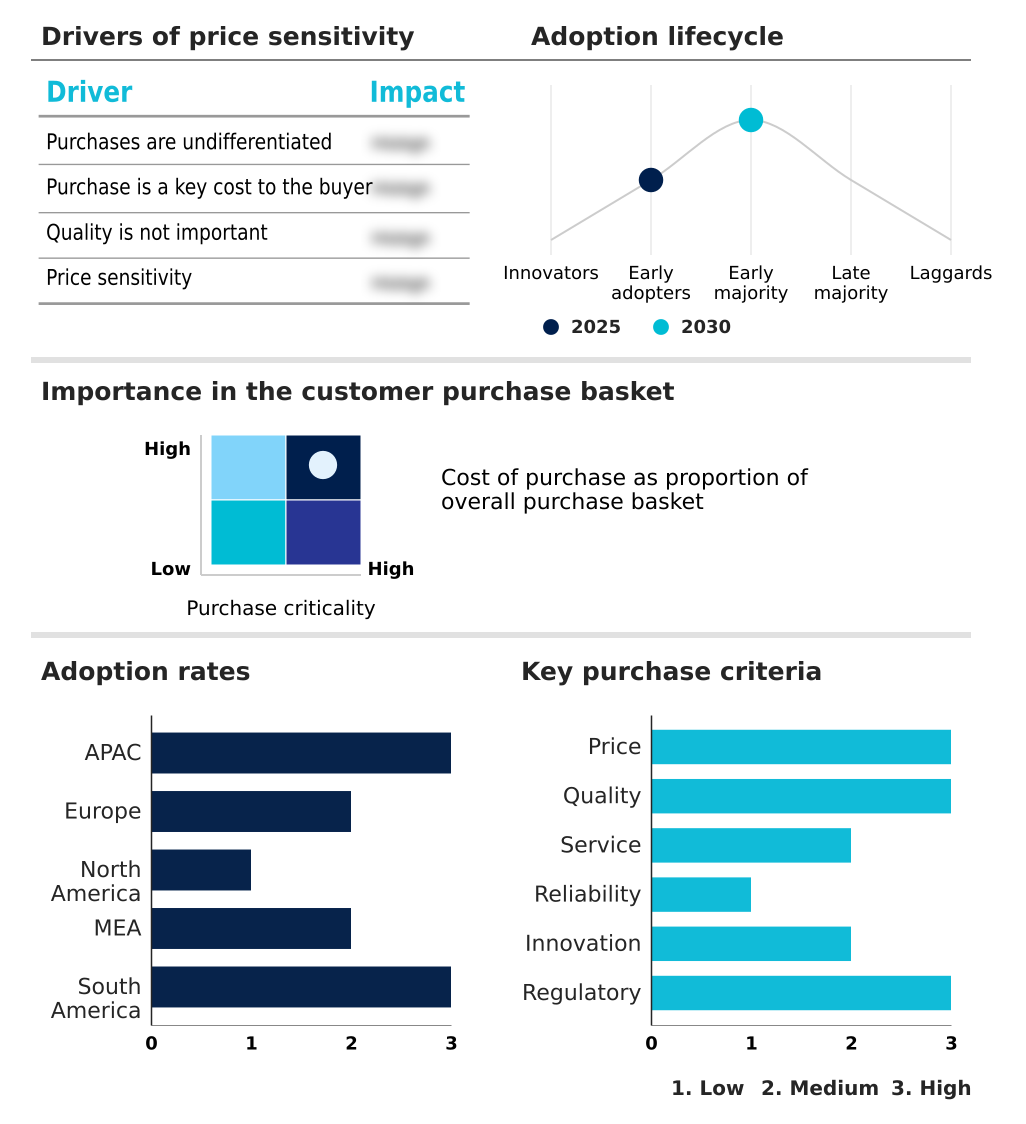
Customer Landscape of Grinding Robots Industry

Competitive Landscape

Companies are implementing various strategies, such as strategic alliances, grinding robots market forecast, partnerships, mergers and acquisitions, geographical expansion, and product/service launches, to enhance their presence in the industry.

3M Co. - ABB delivers specialized robotic grinding solutions equipped with advanced force-sensing technology, enabling consistent surface finishing and optimizing automated manufacturing efficiency for industrial applications.

The industry research and growth report includes detailed analyses of the competitive landscape of the market and information about key companies, including:

  • 3M Co.
  • ABB Ltd.
  • Accord Corp.
  • Acme Manufacturing
  • ACT Robots Inc.
  • DEPRAG SCHULZ GMBH u. CO. KG
  • FANUC Corp.
  • FerRobotics Compliant Robot
  • Heinz Berger Maschinenfabrik GmbH
  • Kawasaki Heavy Industries Ltd.
  • MESH Automation Inc.
  • Mitsubishi Electric Corp.
  • Motionworks Robotics
  • Nachi Fujikoshi Corp.
  • PushCorp Inc.
  • Reichmann and Sohn GmbH
  • Seiko Epson Corp.
  • SUHNER Schweiz AG
  • Teqram BV
  • Yaskawa Electric Corp.

Qualitative and quantitative analysis of companies has been conducted to help clients understand the wider business environment as well as the strengths and weaknesses of key industry players. Data is qualitatively analyzed to categorize companies as pure play, category-focused, industry-focused, and diversified; it is quantitatively analyzed to categorize companies as dominant, leading, strong, tentative, and weak.

Recent Development and News in Grinding robots market

  • In the Industrial Machinery and Supplies and Components industry, the aggressive transition toward smart factory automation has accelerated the integration of industrial Internet of Things sensors, directly impacting Grinding Robots demand by enabling real-time condition monitoring and adaptive finishing control.
  • The implementation of stringent occupational safety regulations regarding metallic dust exposure has forced heavy machinery fabricators to overhaul traditional workshops, increasing the reliance on fully enclosed automated surface finishing systems to maintain facility compliance.
  • Advancements in high-density energy storage manufacturing have required specialized metalworking solutions to process lightweight aluminum battery enclosures, creating a substantial new end-use application for high-precision abrasive robotic systems.
  • The widespread adoption of digital twin simulation across large-scale industrial engineering operations has significantly reduced equipment commissioning timelines, allowing manufacturers to rapidly deploy complex automated machining cells with a 25% higher initial operational success rate.

Dive into Technavio’s robust research methodology, blending expert interviews, extensive data synthesis, and validated models for unparalleled Grinding Robots Market insights. See full methodology.

Market Scope
Page number 309
Base year 2025
Historic period 2020-2024
Forecast period 2026-2030
Growth momentum & CAGR Accelerate at a CAGR of 7.2%
Market growth 2026-2030 USD 75481.7 thousand
Market structure Fragmented
YoY growth 2025-2026(%) 6.7%
Key countries China, Japan, India, South Korea, Australia, Indonesia, Germany, UK, France, Italy, Spain, The Netherlands, US, Canada, Mexico, Saudi Arabia, UAE, South Africa, Israel, Turkey, Brazil, Argentina and Chile
Competitive landscape Leading Companies, Market Positioning of Companies, Competitive Strategies, and Industry Risks

Request Free Sample

Research Analyst Overview

  • The Grinding Robots Market represents a pivotal modernization frontier within advanced industrial manufacturing, characterized by a continuous shift toward autonomous, high-precision material removal. Modern production facilities are progressively integrating sophisticated AI-native software and highly articulate robotic manipulators to address the critical demand for uniform surface integrity across complex components.
  • The transition from manual finishing to intelligent automated processing is driven by an acute necessity to standardize quality and ensure strict compliance with modern ergonomic and safety regulations. Organizations adopting these closed-loop, sensor-driven robotic cells have reported a 20% reduction in average processing time per component, directly optimizing their supply chain velocity.
  • The integration of continuous real-time process monitoring enables factory managers to adjust cutting parameters dynamically, preserving tool life and significantly reducing material scrap. As automotive and aerospace engineering tolerances become increasingly rigorous, the reliance on high-fidelity robotic finishing acts as a crucial strategic differentiator.
  • This technological evolution ensures that manufacturing operations can sustain high-volume output while simultaneously mitigating the operational risks associated with a diminishing skilled industrial workforce.

What are the Key Data Covered in this Grinding Robots Market Research and Growth Report?

  • What is the expected growth of the Grinding Robots Market between 2026 and 2030?

    • USD 75.48 million, at a CAGR of 7.2%

  • What segmentation does the market report cover?

    • The report is segmented by Solution (Software, Services, and Hardware), End-user (Automotive sector, Metals and machinery sector, Aerospace and defense sector, and Others), Type (Articulated robots, SCARA robots, Cartesian robots, and Collaborative robots) and Geography (APAC, Europe, North America, Middle East and Africa, South America)

  • Which regions are analyzed in the report?

    • APAC, Europe, North America, Middle East and Africa and South America

  • What are the key growth drivers and market challenges?

    • Escalating need for precision surface finishing, High initial capital expenditure requirements

  • Who are the major players in the Grinding Robots Market?

    • 3M Co., ABB Ltd., Accord Corp., Acme Manufacturing, ACT Robots Inc., DEPRAG SCHULZ GMBH u. CO. KG, FANUC Corp., FerRobotics Compliant Robot, Heinz Berger Maschinenfabrik GmbH, Kawasaki Heavy Industries Ltd., MESH Automation Inc., Mitsubishi Electric Corp., Motionworks Robotics, Nachi Fujikoshi Corp., PushCorp Inc., Reichmann and Sohn GmbH, Seiko Epson Corp., SUHNER Schweiz AG, Teqram BV and Yaskawa Electric Corp.

Market Research Insights

  • The Grinding Robots Market is rapidly advancing as modern industrial facilities pivot toward fully autonomous, high-precision manufacturing solutions. By integrating sophisticated force-sensing technologies and intelligent path-planning software, organizations are successfully mitigating the risks associated with manual surface finishing.
  • Recent industry implementations demonstrate that the transition to robotic abrasive systems improves overall equipment effectiveness by 18% and reduces hazardous material exposure incidents by up to 25%. This automated approach ensures unparalleled consistency across complex geometries, directly driving down operational costs and enhancing product lifecycle durability.
  • As supply chains increasingly demand zero-defect tolerances, the strategic deployment of adaptive robotic cells provides a decisive competitive advantage in achieving scalable, high-quality production.

We can help! Our analysts can customize this grinding robots market research report to meet your requirements.

Get in touch

1. Executive Summary

1.1 Market overview

Executive Summary - Chart on Market Overview
Executive Summary - Data Table on Market Overview
Executive Summary - Chart on Global Market Characteristics
Executive Summary - Chart on Market by Geography
Executive Summary - Chart on Market Segmentation by Solution
Executive Summary - Chart on Market Segmentation by End-user
Executive Summary - Chart on Market Segmentation by Type
Executive Summary - Chart on Incremental Growth
Executive Summary - Data Table on Incremental Growth
Executive Summary - Chart on Company Market Positioning

2. Technavio Analysis

2.1 Analysis of price sensitivity, lifecycle, customer purchase basket, adoption rates, and purchase criteria

2.2 Criticality of inputs and Factors of differentiation

Chart on Overview on criticality of inputs and factors of differentiation

2.3 Factors of disruption

Chart on Overview on factors of disruption

2.4 Impact of drivers and challenges

Chart on Impact of drivers and challenges in 2025 and 2030

3. Market Landscape

3.1 Market ecosystem

Chart on Parent Market
Data Table on - Parent Market

3.2 Market characteristics

Chart on Market characteristics analysis

3.3 Value chain analysis

Chart on Value chain analysis

4. Market Sizing

4.1 Market definition

Data Table on Offerings of companies included in the market definition

4.2 Market segment analysis

Market segments

4.3 Market size 2025

4.4 Market outlook: Forecast for 2025-2030

Chart on Global - Market size and forecast 2025-2030 ($ thousand)
Data Table on Global - Market size and forecast 2025-2030 ($ thousand)
Chart on Global Market: Year-over-year growth 2025-2030 (%)
Data Table on Global Market: Year-over-year growth 2025-2030 (%)

5. Historic Market Size

5.1 Global Grinding Robots Market 2020 - 2024

Historic Market Size - Data Table on Global Grinding Robots Market 2020 - 2024 ($ thousand)

5.2 Solution segment analysis 2020 - 2024

Historic Market Size - Solution Segment 2020 - 2024 ($ thousand)

5.3 End-user segment analysis 2020 - 2024

Historic Market Size - End-user Segment 2020 - 2024 ($ thousand)

5.4 Type segment analysis 2020 - 2024

Historic Market Size - Type Segment 2020 - 2024 ($ thousand)

5.5 Geography segment analysis 2020 - 2024

Historic Market Size - Geography Segment 2020 - 2024 ($ thousand)

5.6 Country segment analysis 2020 - 2024

Historic Market Size - Country Segment 2020 - 2024 ($ thousand)

6. Qualitative Analysis

6.1 Impact of AI on Global Grinding Robots Market

6.2 Impact of geopolitical conflicts on Global Grinding Robots Market

7. Five Forces Analysis

7.1 Five forces summary

Five forces analysis - Comparison between 2025 and 2030

7.2 Bargaining power of buyers

Bargaining power of buyers - Impact of key factors 2025 and 2030

7.3 Bargaining power of suppliers

Bargaining power of suppliers - Impact of key factors in 2025 and 2030

7.4 Threat of new entrants

Threat of new entrants - Impact of key factors in 2025 and 2030

7.5 Threat of substitutes

Threat of substitutes - Impact of key factors in 2025 and 2030

7.6 Threat of rivalry

Threat of rivalry - Impact of key factors in 2025 and 2030

7.7 Market condition

Chart on Market condition - Five forces 2025 and 2030

8. Market Segmentation by Solution

8.1 Market segments

Chart on Solution - Market share 2025-2030 (%)
Data Table on Solution - Market share 2025-2030 (%)

8.2 Comparison by Solution

Chart on Comparison by Solution
Data Table on Comparison by Solution

8.3 Software - Market size and forecast 2025-2030

Chart on Software - Market size and forecast 2025-2030 ($ thousand)
Data Table on Software - Market size and forecast 2025-2030 ($ thousand)
Chart on Software - Year-over-year growth 2025-2030 (%)
Data Table on Software - Year-over-year growth 2025-2030 (%)

8.4 Services - Market size and forecast 2025-2030

Chart on Services - Market size and forecast 2025-2030 ($ thousand)
Data Table on Services - Market size and forecast 2025-2030 ($ thousand)
Chart on Services - Year-over-year growth 2025-2030 (%)
Data Table on Services - Year-over-year growth 2025-2030 (%)

8.5 Hardware - Market size and forecast 2025-2030

Chart on Hardware - Market size and forecast 2025-2030 ($ thousand)
Data Table on Hardware - Market size and forecast 2025-2030 ($ thousand)
Chart on Hardware - Year-over-year growth 2025-2030 (%)
Data Table on Hardware - Year-over-year growth 2025-2030 (%)

8.6 Market opportunity by Solution

Market opportunity by Solution ($ thousand)
Data Table on Market opportunity by Solution ($ thousand)

9. Market Segmentation by End-user

9.1 Market segments

Chart on End-user - Market share 2025-2030 (%)
Data Table on End-user - Market share 2025-2030 (%)

9.2 Comparison by End-user

Chart on Comparison by End-user
Data Table on Comparison by End-user

9.3 Automotive sector - Market size and forecast 2025-2030

Chart on Automotive sector - Market size and forecast 2025-2030 ($ thousand)
Data Table on Automotive sector - Market size and forecast 2025-2030 ($ thousand)
Chart on Automotive sector - Year-over-year growth 2025-2030 (%)
Data Table on Automotive sector - Year-over-year growth 2025-2030 (%)

9.4 Metals and machinery sector - Market size and forecast 2025-2030

Chart on Metals and machinery sector - Market size and forecast 2025-2030 ($ thousand)
Data Table on Metals and machinery sector - Market size and forecast 2025-2030 ($ thousand)
Chart on Metals and machinery sector - Year-over-year growth 2025-2030 (%)
Data Table on Metals and machinery sector - Year-over-year growth 2025-2030 (%)

9.5 Aerospace and defense sector - Market size and forecast 2025-2030

Chart on Aerospace and defense sector - Market size and forecast 2025-2030 ($ thousand)
Data Table on Aerospace and defense sector - Market size and forecast 2025-2030 ($ thousand)
Chart on Aerospace and defense sector - Year-over-year growth 2025-2030 (%)
Data Table on Aerospace and defense sector - Year-over-year growth 2025-2030 (%)

9.6 Others - Market size and forecast 2025-2030

Chart on Others - Market size and forecast 2025-2030 ($ thousand)
Data Table on Others - Market size and forecast 2025-2030 ($ thousand)
Chart on Others - Year-over-year growth 2025-2030 (%)
Data Table on Others - Year-over-year growth 2025-2030 (%)

9.7 Market opportunity by End-user

Market opportunity by End-user ($ thousand)
Data Table on Market opportunity by End-user ($ thousand)

10. Market Segmentation by Type

10.1 Market segments

Chart on Type - Market share 2025-2030 (%)
Data Table on Type - Market share 2025-2030 (%)

10.2 Comparison by Type

Chart on Comparison by Type
Data Table on Comparison by Type

10.3 Articulated robots - Market size and forecast 2025-2030

Chart on Articulated robots - Market size and forecast 2025-2030 ($ thousand)
Data Table on Articulated robots - Market size and forecast 2025-2030 ($ thousand)
Chart on Articulated robots - Year-over-year growth 2025-2030 (%)
Data Table on Articulated robots - Year-over-year growth 2025-2030 (%)

10.4 SCARA robots - Market size and forecast 2025-2030

Chart on SCARA robots - Market size and forecast 2025-2030 ($ thousand)
Data Table on SCARA robots - Market size and forecast 2025-2030 ($ thousand)
Chart on SCARA robots - Year-over-year growth 2025-2030 (%)
Data Table on SCARA robots - Year-over-year growth 2025-2030 (%)

10.5 Cartesian robots - Market size and forecast 2025-2030

Chart on Cartesian robots - Market size and forecast 2025-2030 ($ thousand)
Data Table on Cartesian robots - Market size and forecast 2025-2030 ($ thousand)
Chart on Cartesian robots - Year-over-year growth 2025-2030 (%)
Data Table on Cartesian robots - Year-over-year growth 2025-2030 (%)

10.6 Collaborative robots - Market size and forecast 2025-2030

Chart on Collaborative robots - Market size and forecast 2025-2030 ($ thousand)
Data Table on Collaborative robots - Market size and forecast 2025-2030 ($ thousand)
Chart on Collaborative robots - Year-over-year growth 2025-2030 (%)
Data Table on Collaborative robots - Year-over-year growth 2025-2030 (%)

10.7 Market opportunity by Type

Market opportunity by Type ($ thousand)
Data Table on Market opportunity by Type ($ thousand)

11. Customer Landscape

11.1 Customer landscape overview

Analysis of price sensitivity, lifecycle, customer purchase basket, adoption rates, and purchase criteria

12. Geographic Landscape

12.1 Geographic segmentation

Chart on Market share by geography 2025-2030 (%)
Data Table on Market share by geography 2025-2030 (%)

12.2 Geographic comparison

Chart on Geographic comparison
Data Table on Geographic comparison

12.3 APAC - Market size and forecast 2025-2030

Chart on APAC - Market size and forecast 2025-2030 ($ thousand)
Data Table on APAC - Market size and forecast 2025-2030 ($ thousand)
Chart on APAC - Year-over-year growth 2025-2030 (%)
Data Table on APAC - Year-over-year growth 2025-2030 (%)
Chart on Regional Comparison - APAC
Data Table on Regional Comparison - APAC

12.3.1 China - Market size and forecast 2025-2030

Chart on China - Market size and forecast 2025-2030 ($ thousand)
Data Table on China - Market size and forecast 2025-2030 ($ thousand)
Chart on China - Year-over-year growth 2025-2030 (%)
Data Table on China - Year-over-year growth 2025-2030 (%)

12.3.2 Japan - Market size and forecast 2025-2030

Chart on Japan - Market size and forecast 2025-2030 ($ thousand)
Data Table on Japan - Market size and forecast 2025-2030 ($ thousand)
Chart on Japan - Year-over-year growth 2025-2030 (%)
Data Table on Japan - Year-over-year growth 2025-2030 (%)

12.3.3 India - Market size and forecast 2025-2030

Chart on India - Market size and forecast 2025-2030 ($ thousand)
Data Table on India - Market size and forecast 2025-2030 ($ thousand)
Chart on India - Year-over-year growth 2025-2030 (%)
Data Table on India - Year-over-year growth 2025-2030 (%)

12.3.4 South Korea - Market size and forecast 2025-2030

Chart on South Korea - Market size and forecast 2025-2030 ($ thousand)
Data Table on South Korea - Market size and forecast 2025-2030 ($ thousand)
Chart on South Korea - Year-over-year growth 2025-2030 (%)
Data Table on South Korea - Year-over-year growth 2025-2030 (%)

12.3.5 Australia - Market size and forecast 2025-2030

Chart on Australia - Market size and forecast 2025-2030 ($ thousand)
Data Table on Australia - Market size and forecast 2025-2030 ($ thousand)
Chart on Australia - Year-over-year growth 2025-2030 (%)
Data Table on Australia - Year-over-year growth 2025-2030 (%)

12.3.6 Indonesia - Market size and forecast 2025-2030

Chart on Indonesia - Market size and forecast 2025-2030 ($ thousand)
Data Table on Indonesia - Market size and forecast 2025-2030 ($ thousand)
Chart on Indonesia - Year-over-year growth 2025-2030 (%)
Data Table on Indonesia - Year-over-year growth 2025-2030 (%)

12.4 Europe - Market size and forecast 2025-2030

Chart on Europe - Market size and forecast 2025-2030 ($ thousand)
Data Table on Europe - Market size and forecast 2025-2030 ($ thousand)
Chart on Europe - Year-over-year growth 2025-2030 (%)
Data Table on Europe - Year-over-year growth 2025-2030 (%)
Chart on Regional Comparison - Europe
Data Table on Regional Comparison - Europe

12.4.1 Germany - Market size and forecast 2025-2030

Chart on Germany - Market size and forecast 2025-2030 ($ thousand)
Data Table on Germany - Market size and forecast 2025-2030 ($ thousand)
Chart on Germany - Year-over-year growth 2025-2030 (%)
Data Table on Germany - Year-over-year growth 2025-2030 (%)

12.4.2 UK - Market size and forecast 2025-2030

Chart on UK - Market size and forecast 2025-2030 ($ thousand)
Data Table on UK - Market size and forecast 2025-2030 ($ thousand)
Chart on UK - Year-over-year growth 2025-2030 (%)
Data Table on UK - Year-over-year growth 2025-2030 (%)

12.4.3 France - Market size and forecast 2025-2030

Chart on France - Market size and forecast 2025-2030 ($ thousand)
Data Table on France - Market size and forecast 2025-2030 ($ thousand)
Chart on France - Year-over-year growth 2025-2030 (%)
Data Table on France - Year-over-year growth 2025-2030 (%)

12.4.4 Italy - Market size and forecast 2025-2030

Chart on Italy - Market size and forecast 2025-2030 ($ thousand)
Data Table on Italy - Market size and forecast 2025-2030 ($ thousand)
Chart on Italy - Year-over-year growth 2025-2030 (%)
Data Table on Italy - Year-over-year growth 2025-2030 (%)

12.4.5 Spain - Market size and forecast 2025-2030

Chart on Spain - Market size and forecast 2025-2030 ($ thousand)
Data Table on Spain - Market size and forecast 2025-2030 ($ thousand)
Chart on Spain - Year-over-year growth 2025-2030 (%)
Data Table on Spain - Year-over-year growth 2025-2030 (%)

12.4.6 The Netherlands - Market size and forecast 2025-2030

Chart on The Netherlands - Market size and forecast 2025-2030 ($ thousand)
Data Table on The Netherlands - Market size and forecast 2025-2030 ($ thousand)
Chart on The Netherlands - Year-over-year growth 2025-2030 (%)
Data Table on The Netherlands - Year-over-year growth 2025-2030 (%)

12.5 North America - Market size and forecast 2025-2030

Chart on North America - Market size and forecast 2025-2030 ($ thousand)
Data Table on North America - Market size and forecast 2025-2030 ($ thousand)
Chart on North America - Year-over-year growth 2025-2030 (%)
Data Table on North America - Year-over-year growth 2025-2030 (%)
Chart on Regional Comparison - North America
Data Table on Regional Comparison - North America

12.5.1 US - Market size and forecast 2025-2030

Chart on US - Market size and forecast 2025-2030 ($ thousand)
Data Table on US - Market size and forecast 2025-2030 ($ thousand)
Chart on US - Year-over-year growth 2025-2030 (%)
Data Table on US - Year-over-year growth 2025-2030 (%)

12.5.2 Canada - Market size and forecast 2025-2030

Chart on Canada - Market size and forecast 2025-2030 ($ thousand)
Data Table on Canada - Market size and forecast 2025-2030 ($ thousand)
Chart on Canada - Year-over-year growth 2025-2030 (%)
Data Table on Canada - Year-over-year growth 2025-2030 (%)

12.5.3 Mexico - Market size and forecast 2025-2030

Chart on Mexico - Market size and forecast 2025-2030 ($ thousand)
Data Table on Mexico - Market size and forecast 2025-2030 ($ thousand)
Chart on Mexico - Year-over-year growth 2025-2030 (%)
Data Table on Mexico - Year-over-year growth 2025-2030 (%)

12.6 Middle East and Africa - Market size and forecast 2025-2030

Chart on Middle East and Africa - Market size and forecast 2025-2030 ($ thousand)
Data Table on Middle East and Africa - Market size and forecast 2025-2030 ($ thousand)
Chart on Middle East and Africa - Year-over-year growth 2025-2030 (%)
Data Table on Middle East and Africa - Year-over-year growth 2025-2030 (%)
Chart on Regional Comparison - Middle East and Africa
Data Table on Regional Comparison - Middle East and Africa

12.6.1 Saudi Arabia - Market size and forecast 2025-2030

Chart on Saudi Arabia - Market size and forecast 2025-2030 ($ thousand)
Data Table on Saudi Arabia - Market size and forecast 2025-2030 ($ thousand)
Chart on Saudi Arabia - Year-over-year growth 2025-2030 (%)
Data Table on Saudi Arabia - Year-over-year growth 2025-2030 (%)

12.6.2 UAE - Market size and forecast 2025-2030

Chart on UAE - Market size and forecast 2025-2030 ($ thousand)
Data Table on UAE - Market size and forecast 2025-2030 ($ thousand)
Chart on UAE - Year-over-year growth 2025-2030 (%)
Data Table on UAE - Year-over-year growth 2025-2030 (%)

12.6.3 South Africa - Market size and forecast 2025-2030

Chart on South Africa - Market size and forecast 2025-2030 ($ thousand)
Data Table on South Africa - Market size and forecast 2025-2030 ($ thousand)
Chart on South Africa - Year-over-year growth 2025-2030 (%)
Data Table on South Africa - Year-over-year growth 2025-2030 (%)

12.6.4 Israel - Market size and forecast 2025-2030

Chart on Israel - Market size and forecast 2025-2030 ($ thousand)
Data Table on Israel - Market size and forecast 2025-2030 ($ thousand)
Chart on Israel - Year-over-year growth 2025-2030 (%)
Data Table on Israel - Year-over-year growth 2025-2030 (%)

12.6.5 Turkey - Market size and forecast 2025-2030

Chart on Turkey - Market size and forecast 2025-2030 ($ thousand)
Data Table on Turkey - Market size and forecast 2025-2030 ($ thousand)
Chart on Turkey - Year-over-year growth 2025-2030 (%)
Data Table on Turkey - Year-over-year growth 2025-2030 (%)

12.7 South America - Market size and forecast 2025-2030

Chart on South America - Market size and forecast 2025-2030 ($ thousand)
Data Table on South America - Market size and forecast 2025-2030 ($ thousand)
Chart on South America - Year-over-year growth 2025-2030 (%)
Data Table on South America - Year-over-year growth 2025-2030 (%)
Chart on Regional Comparison - South America
Data Table on Regional Comparison - South America

12.7.1 Brazil - Market size and forecast 2025-2030

Chart on Brazil - Market size and forecast 2025-2030 ($ thousand)
Data Table on Brazil - Market size and forecast 2025-2030 ($ thousand)
Chart on Brazil - Year-over-year growth 2025-2030 (%)
Data Table on Brazil - Year-over-year growth 2025-2030 (%)

12.7.2 Argentina - Market size and forecast 2025-2030

Chart on Argentina - Market size and forecast 2025-2030 ($ thousand)
Data Table on Argentina - Market size and forecast 2025-2030 ($ thousand)
Chart on Argentina - Year-over-year growth 2025-2030 (%)
Data Table on Argentina - Year-over-year growth 2025-2030 (%)

12.7.3 Chile - Market size and forecast 2025-2030

Chart on Chile - Market size and forecast 2025-2030 ($ thousand)
Data Table on Chile - Market size and forecast 2025-2030 ($ thousand)
Chart on Chile - Year-over-year growth 2025-2030 (%)
Data Table on Chile - Year-over-year growth 2025-2030 (%)

12.8 Market opportunity by geography

Market opportunity by geography ($ thousand)
Data Tables on Market opportunity by geography ($ thousand)

13. Drivers, Challenges, and Opportunity

13.1 Market drivers

Escalating need for precision surface finishing
Mitigating chronic skilled labor shortages
Integration of AI technologies

13.2 Market challenges

High initial capital expenditure requirements
Acute shortage of technical talent
Complex integration and legacy infrastructure

13.3 Impact of drivers and challenges

Impact of drivers and challenges in 2025 and 2030

13.4 Market opportunities

Focus on sustainability and energy efficiency
Expansion of collaborative robotics in manufacturing
Growth of digital twins and simulation

14. Competitive Landscape

14.1 Overview

14.2

Overview on criticality of inputs and factors of differentiation

14.3 Landscape disruption

Overview on factors of disruption

14.4 Industry risks

Impact of key risks on business

15. Competitive Analysis

15.1 Companies profiled

Companies covered

15.2 Company ranking index

15.3 Market positioning of companies

Matrix on companies position and classification

15.4 3M Co.

3M Co. - Overview
3M Co. - Business segments
3M Co. - Key news
3M Co. - Key offerings
3M Co. - Segment focus
SWOT

15.5 ABB Ltd.

ABB Ltd. - Overview
ABB Ltd. - Business segments
ABB Ltd. - Key news
ABB Ltd. - Key offerings
ABB Ltd. - Segment focus
SWOT

15.6 Acme Manufacturing

Acme Manufacturing - Overview
Acme Manufacturing - Product / Service
Acme Manufacturing - Key offerings
SWOT

15.7 DEPRAG SCHULZ GMBH u. CO. KG

DEPRAG SCHULZ GMBH u. CO. KG - Overview
DEPRAG SCHULZ GMBH u. CO. KG - Product / Service
DEPRAG SCHULZ GMBH u. CO. KG - Key offerings
SWOT

15.8 FANUC Corp.

FANUC Corp. - Overview
FANUC Corp. - Product / Service
FANUC Corp. - Key offerings
SWOT

15.9 Heinz Berger Maschinenfabrik GmbH

Heinz Berger Maschinenfabrik GmbH - Overview
Heinz Berger Maschinenfabrik GmbH - Product / Service
Heinz Berger Maschinenfabrik GmbH - Key offerings
SWOT

15.10 Kawasaki Heavy Industries Ltd.

Kawasaki Heavy Industries Ltd. - Overview
Kawasaki Heavy Industries Ltd. - Business segments
Kawasaki Heavy Industries Ltd. - Key news
Kawasaki Heavy Industries Ltd. - Key offerings
Kawasaki Heavy Industries Ltd. - Segment focus
SWOT

15.11 MESH Automation Inc.

MESH Automation Inc. - Overview
MESH Automation Inc. - Product / Service
MESH Automation Inc. - Key offerings
SWOT

15.12 Mitsubishi Electric Corp.

Mitsubishi Electric Corp. - Overview
Mitsubishi Electric Corp. - Business segments
Mitsubishi Electric Corp. - Key offerings
Mitsubishi Electric Corp. - Segment focus
SWOT

15.13 Nachi Fujikoshi Corp.

Nachi Fujikoshi Corp. - Overview
Nachi Fujikoshi Corp. - Business segments
Nachi Fujikoshi Corp. - Key offerings
Nachi Fujikoshi Corp. - Segment focus
SWOT

15.14 Reichmann and Sohn GmbH

Reichmann and Sohn GmbH - Overview
Reichmann and Sohn GmbH - Product / Service
Reichmann and Sohn GmbH - Key offerings
SWOT

15.15 Seiko Epson Corp.

Seiko Epson Corp. - Overview
Seiko Epson Corp. - Business segments
Seiko Epson Corp. - Key offerings
Seiko Epson Corp. - Segment focus
SWOT

15.16 SUHNER Schweiz AG

SUHNER Schweiz AG - Overview
SUHNER Schweiz AG - Product / Service
SUHNER Schweiz AG - Key offerings
SWOT

15.17 Teqram BV

Teqram BV - Overview
Teqram BV - Product / Service
Teqram BV - Key offerings
SWOT

15.18 Yaskawa Electric Corp.

Yaskawa Electric Corp. - Overview
Yaskawa Electric Corp. - Business segments
Yaskawa Electric Corp. - Key offerings
Yaskawa Electric Corp. - Segment focus
SWOT

16. Appendix

16.1 Scope of the report

Market definition
Objectives
Notes and caveats

16.2 Inclusions and exclusions checklist

Inclusions checklist
Exclusions checklist

16.3 Currency conversion rates for US$

16.4 Research methodology

16.5 Data procurement

Information sources

16.6 Data validation

16.7 Validation techniques employed for market sizing

16.8 Data synthesis

16.9 360 degree market analysis

16.10 List of abbreviations

Research Methodology

Technavio presents a detailed picture of the market by way of study, synthesis, and summation of data from multiple sources. The analysts have presented the various facets of the market with a particular focus on identifying the key industry influencers. The data thus presented is comprehensive, reliable, and the result of extensive research, both primary and secondary.

INFORMATION SOURCES

Primary sources

  • Manufacturers and suppliers
  • Channel partners
  • Industry experts
  • Strategic decision makers

Secondary sources

  • Industry journals and periodicals
  • Government data
  • Financial reports of key industry players
  • Historical data
  • Press releases

DATA ANALYSIS

Data Synthesis

  • Collation of data
  • Estimation of key figures
  • Analysis of derived insights

Data Validation

  • Triangulation with data models
  • Reference against proprietary databases
  • Corroboration with industry experts

REPORT WRITING

Qualitative

  • Market drivers
  • Market challenges
  • Market trends
  • Five forces analysis

Quantitative

  • Market size and forecast
  • Market segmentation
  • Geographical insights
  • Competitive landscape

Interested in this report?

Get your sample now to see our research methodology and insights!

Download Now

Frequently Asked Questions

Grinding Robots market growth will increase by USD 75481.7 thousand thousand during 2026-2030.

The Grinding Robots market is expected to grow at a CAGR of 7.2% during 2026-2030.

Grinding Robots market is segmented by Solution (Software, Services, Hardware) End-user (Automotive sector, Metals and machinery sector, Aerospace and defense sector, Others) Type (Articulated robots, SCARA robots, Cartesian robots, Collaborative robots)

3M Co., ABB Ltd., Accord Corp., Acme Manufacturing, ACT Robots Inc., DEPRAG SCHULZ GMBH u. CO. KG, FANUC Corp., FerRobotics Compliant Robot, Heinz Berger Maschinenfabrik GmbH, Kawasaki Heavy Industries Ltd., MESH Automation Inc., Mitsubishi Electric Corp., Motionworks Robotics, Nachi Fujikoshi Corp., PushCorp Inc., Reichmann and Sohn GmbH, Seiko Epson Corp., SUHNER Schweiz AG, Teqram BV, Yaskawa Electric Corp. are a few of the key vendors in the Grinding Robots market.

APAC will register the highest growth rate of 60.7% among the other regions. Therefore, the Grinding Robots market in APAC is expected to garner significant business opportunities for the vendors during the forecast period.

China, Japan, India, South Korea, Australia, Indonesia, Germany, UK, France, Italy, Spain, The Netherlands, US, Canada, Mexico, Saudi Arabia, UAE, South Africa, Israel, Turkey, Brazil, Argentina, Chile

  • Escalating need for precision surface finishing is the driving factor this market.

The Grinding Robots market vendors should focus on grabbing business opportunities from the Solution segment as it accounted for the largest market share in the base year.
RIA - Research AI Assistant
Ask RIA
