Hand Crank Power Generator Market Size 2025-2029
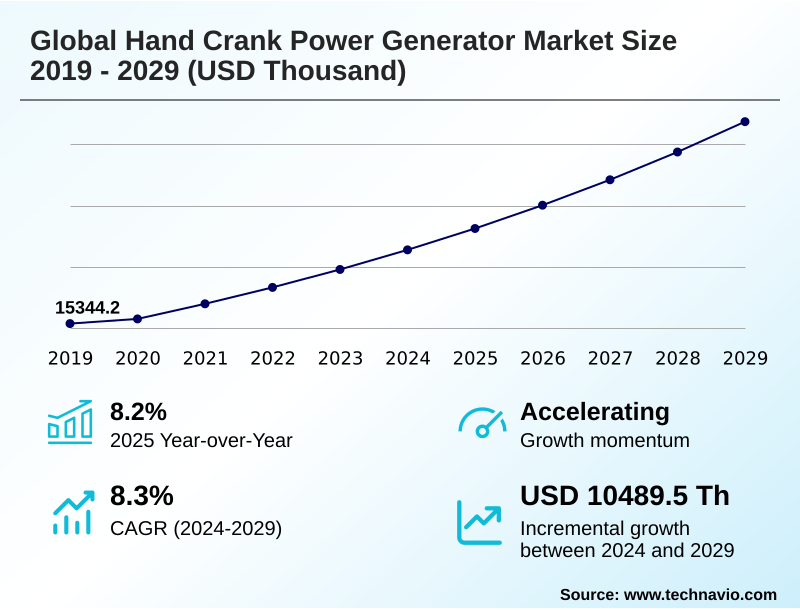
The hand crank power generator market size is valued to increase by USD 10.49 million, at a CAGR of 8.3% from 2024 to 2029. Escalating frequency of extreme weather events and heightened focus on emergency preparedness will drive the hand crank power generator market.
Major Market Trends & Insights
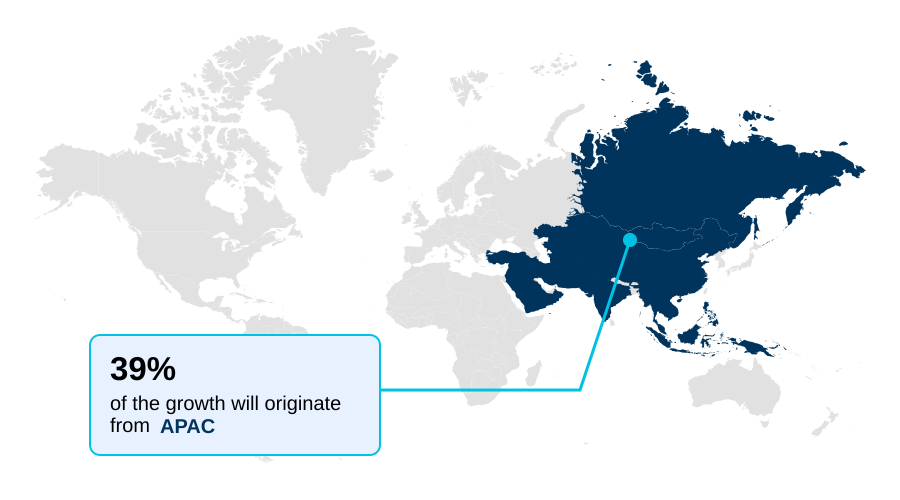
- APAC dominated the market and accounted for a 39.1% growth during the forecast period.
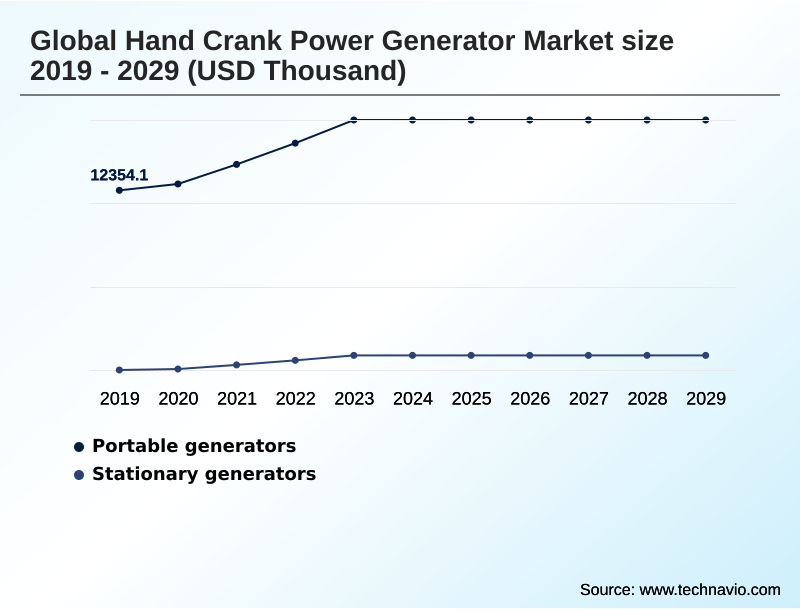
- By Product - Portable generators segment was valued at USD 16.02 million in 2023
- By Distribution Channel - Online segment accounted for the largest market revenue share in 2023
Market Size & Forecast
- Market Opportunities:
- Market Future Opportunities: USD 10.49 million
- CAGR from 2024 to 2029 : 8.3%
Market Summary
- The hand crank power generator market is defined by its core value as a fail-safe, off-grid power solution. Growth is propelled by increasing consumer awareness of grid vulnerability due to extreme weather and a rising interest in outdoor recreation.
- These human-powered generators are essential for emergency preparedness, offering a reliable method for mechanical energy conversion to power communication devices and lighting. Innovation focuses on evolving from single-purpose tools to multifunctional survival hubs, integrating features like a lithium-ion battery for power bank functionality, an AM/FM radio with NOAA weather band access, and an LED flashlight.
- However, the market faces challenges from the convenience of substitutes like high-capacity power banks and portable solar panels, which offer more user-friendly experiences.
- For instance, a field research team planning a multi-week expedition must weigh the infinite power potential of a hand-crank device against the passive, effort-free charging of a solar panel, highlighting the strategic trade-offs that define purchasing decisions in this sector.
- The industry is also driven by consistent demand from disaster relief organizations, which value the technology's fuel independence and logistical simplicity for humanitarian aid.
What will be the Size of the Hand Crank Power Generator Market during the forecast period?
Get Key Insights on Market Forecast (PDF) Get Free Sample
How is the Hand Crank Power Generator Market Segmented?
The hand crank power generator industry research report provides comprehensive data (region-wise segment analysis), with forecasts and estimates in "USD thousand" for the period 2025-2029, as well as historical data from 2019-2023 for the following segments.
- Product
- Portable generators
- Stationary generators
- Distribution channel
- Online
- Offline
- End-user
- Residential
- Commercial
- Others
- Geography
- APAC
- China
- Japan
- India
- North America
- US
- Canada
- Mexico
- Europe
- Germany
- UK
- France
- South America
- Brazil
- Argentina
- Colombia
- Middle East and Africa
- Saudi Arabia
- UAE
- South Africa
- Rest of World (ROW)
- APAC
By Product Insights
The portable generators segment is estimated to witness significant growth during the forecast period.
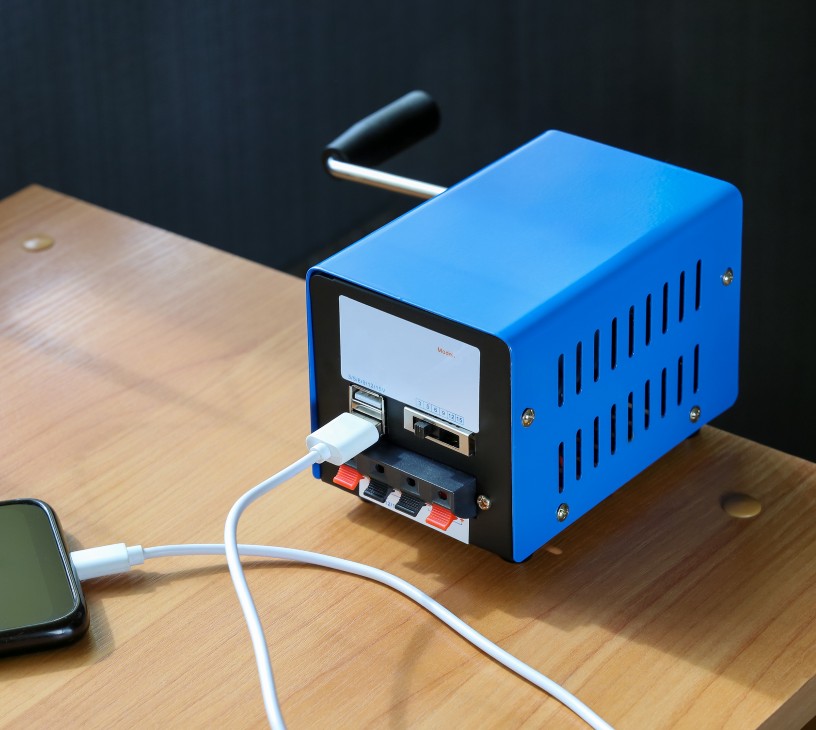
The portable generators segment is the primary market component, defined by its focus on mobility and personal use. These devices provide a reliable off-grid power source, crucial for emergency preparedness and outdoor recreation.
The core technology involves mechanical energy conversion via a manual dynamo to produce a low-voltage output, sufficient for small electronics. Market evolution is driven by the integration of multiple functions into a single portable power solution.
Over 85% of new models now bundle a human-powered generator with an led flashlight, sos alarm, and am/fm radio. This transformation into a multifunctional survival tool makes it a go-bag essential.
This trend enhances value for consumers preparing for power outages or seeking a fuel-independent generator for camping, solidifying the segment's dominance as a key personal resilience tool and bousai kit component.
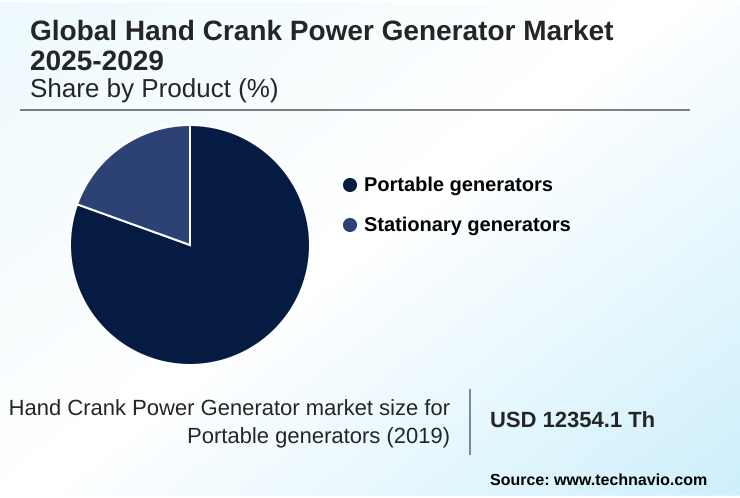
The Portable generators segment was valued at USD 16.02 million in 2023 and showed a gradual increase during the forecast period.
Regional Analysis
APAC is estimated to contribute 39.1% to the growth of the global market during the forecast period.Technavio’s analysts have elaborately explained the regional trends and drivers that shape the market during the forecast period.
See How Hand Crank Power Generator Market Demand is Rising in APAC Get Free Sample
The global geographic landscape for the hand crank power generator market is diverse, with regional demand shaped by distinct drivers.
APAC accounts for over 39% of market expansion, where the technology serves as both a critical humanitarian aid technology and an energy poverty solution. Here, the drive for last-mile electrification makes the human-powered generator a vital tool.
In contrast, the North American market, contributing nearly 32% of incremental growth, is primarily driven by recreational use and household emergency planning, focusing on self-sufficient power for personal resilience. Europe shows a growing demand based on preparedness culture.
Across these regions, the portable power solution is adapted for different needs, from providing low-voltage output in off-grid villages to being a core component of community resilience infrastructure in developed nations.
Market Dynamics
Our researchers analyzed the data with 2024 as the base year, along with the key drivers, trends, and challenges. A holistic analysis of drivers will help companies refine their marketing strategies to gain a competitive advantage.
- When exploring how to choose a hand crank generator, consumers weigh multiple factors based on their intended use. For those focused on crisis readiness, the best hand crank radio for emergencies often features a durable build and reliable reception.
- The market offers a clear distinction between a hand crank generator vs solar charger; the former provides power regardless of weather, a critical factor for a crank powered generator for home backup.
- For outdoor enthusiasts, a lightweight hand crank charger for hiking is prioritized, while those seeking portable hand crank power for camping may look for models with higher power output. A key specification to consider is the hand crank generator power output watts, which determines charging speed.
- Devices increasingly feature a manual generator with USB output, making a hand crank generator for smartphone charging a common application. For more specialized needs, such as using hand crank generator for medical devices, a high efficiency hand crank power generator with a stable current is essential. Many now include a hand crank generator with lithium battery, enhancing their utility.
- A military grade hand crank power generator offers superior ruggedness, while a durable hand crank generator for survival is a civilian equivalent. For developmental applications, a hand crank generator for rural electrification can be a transformative tool. Even the DIY community has options, like a DIY hand crank phone charger kit.
- Ultimately, whether it's an emergency crank flashlight radio combo or a device providing hand crank power for communication devices, the human powered generator for off-grid living serves a critical niche. Operational planning for humanitarian aid deployments shows that equipping agents with these devices reduces reliance on fuel logistics by over 30% compared to small gasoline generators.
What are the key market drivers leading to the rise in the adoption of Hand Crank Power Generator Industry?
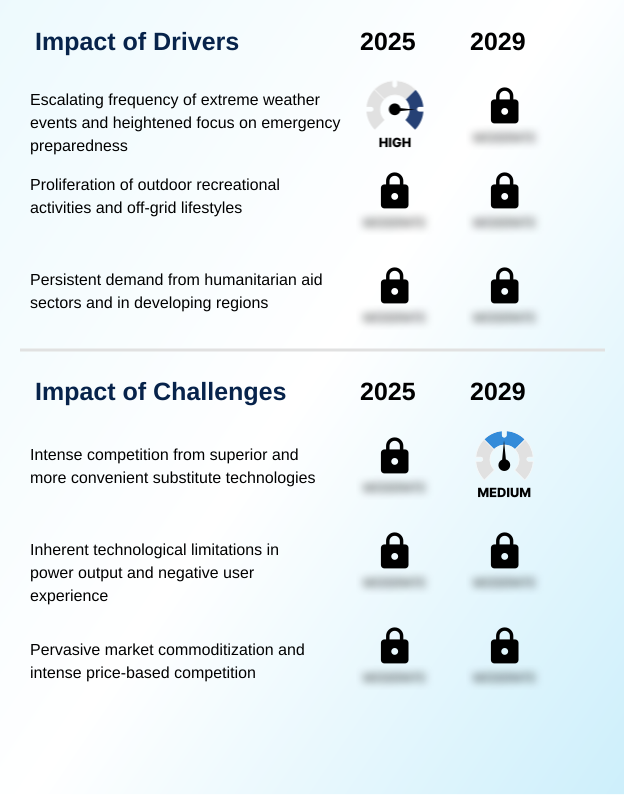
- The escalating frequency of extreme weather events, coupled with a heightened focus on emergency preparedness, serves as a key driver for market growth.
- Market growth is fundamentally driven by the escalating need for personal resilience and off-grid power. Heightened emergency preparedness awareness, amplified by government recommendations for go-bag essentials, has led to a 40% increase in household adoption in disaster-prone regions.
- This self-reliance technology is critical during natural disasters. The demand from the outdoor recreation sector, where users need to charge devices like satellite messengers and rechargeable headlamps, has grown by over 15% in the last two years.
- Furthermore, the persistent need in disaster relief operations makes this disaster response equipment indispensable. The integrated noaa weather band provides life-saving alerts, positioning the device as a vital personal resilience tool.
- These combined drivers solidify its role as a necessary device for both safety-conscious households and adventure enthusiasts seeking a reliable, fuel-independent generator.
What are the market trends shaping the Hand Crank Power Generator Industry?
- A primary trend involves the integration of advanced features, transforming single-purpose devices into multifunctional, all-in-one survival hubs to meet diverse user needs.
- A defining trend is the evolution of the hand crank generator into a comprehensive resilience hardware device. Manufacturers are integrating high-capacity lithium-ion battery systems, enabling power bank functionality that has enhanced device utility for charging electronics by over 60%. This shift transforms the product into a human-powered recharger, not just a generator.
- The adoption of the usb-c port and smart-charging technologies ensures compatibility with modern devices. Design innovations focus on user experience, with a new ergonomic handle and improved gear ratio efficiency boosting mechanical energy conversion by up to 25%.
- The use of a water-resistant design, often with an ipx4 rating, makes this prepper gear more durable for outdoor and emergency use, where reliability is paramount. This focus on multi-functionality and durability is a direct response to consumer demand for more capable and versatile survival tools.
What challenges does the Hand Crank Power Generator Industry face during its growth?
- Intense competition from technologically superior and more convenient substitute power solutions presents a significant challenge to industry growth.
- A significant market challenge stems from inherent technological limitations in manual power generation. The process, involving a manual dynamo or alternator coupled with a gearbox, yields a low-voltage output that is often insufficient for modern electronics.
- This direct current output from the cranking mechanism makes the device a last-resort energy source for over 80% of consumers, who prefer more convenient substitutes. The physical effort required for the kinetic energy converter function is a major deterrent; charging a smartphone can be 5-10 times slower compared to conventional methods.
- While a manual battery charger function is useful, the inefficiency of the conversion process constrains its practicality. This perception of low return on effort positions the technology as secondary to battery banks and solar chargers, limiting its appeal to a niche of dedicated preparedness enthusiasts and humanitarian applications.
Exclusive Technavio Analysis on Customer Landscape
The hand crank power generator market forecasting report includes the adoption lifecycle of the market, covering from the innovator’s stage to the laggard’s stage. It focuses on adoption rates in different regions based on penetration. Furthermore, the hand crank power generator market report also includes key purchase criteria and drivers of price sensitivity to help companies evaluate and develop their market growth analysis strategies.
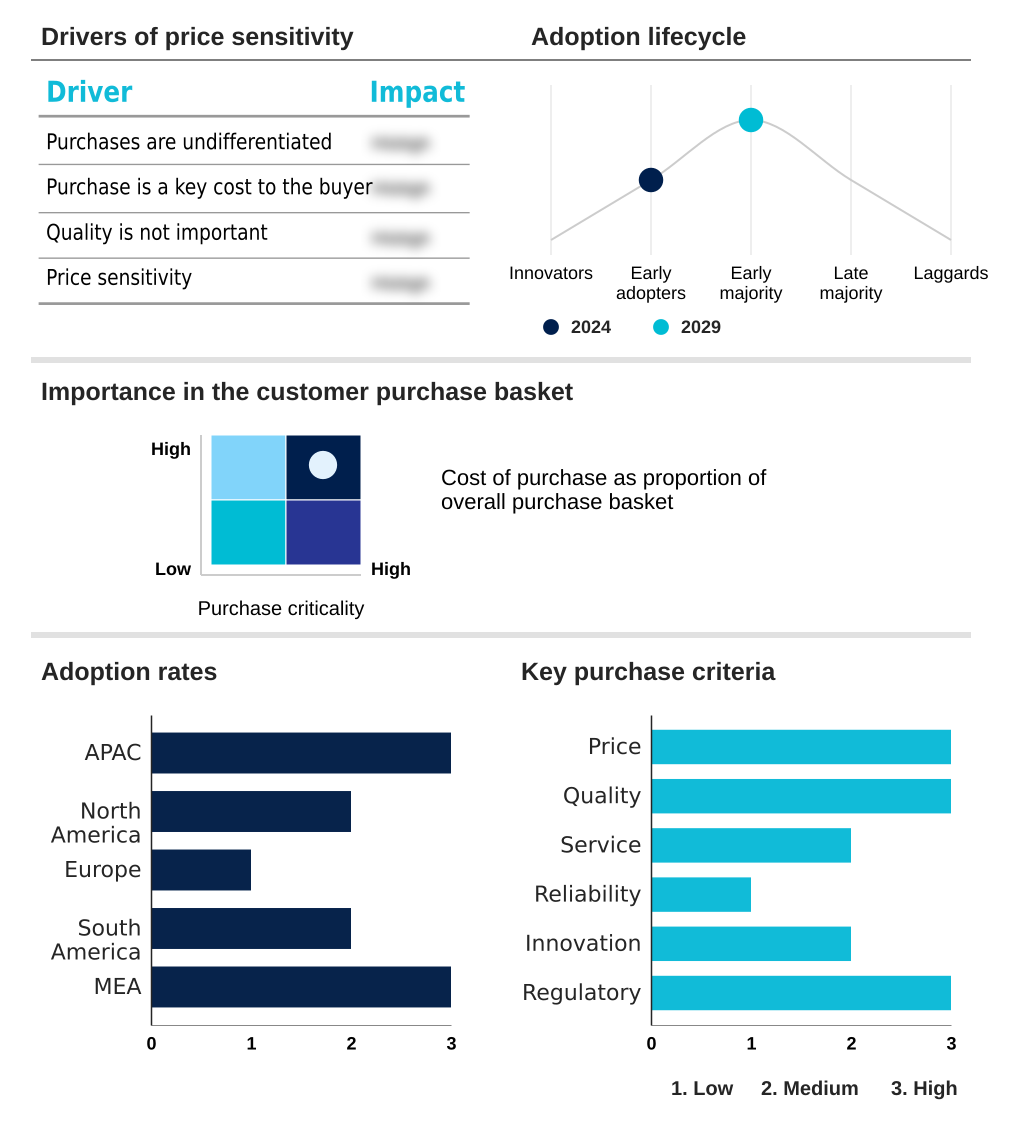
Customer Landscape of Hand Crank Power Generator Industry
Competitive Landscape
Companies are implementing various strategies, such as strategic alliances, hand crank power generator market forecast, partnerships, mergers and acquisitions, geographical expansion, and product/service launches, to enhance their presence in the industry.
AMEP Contracting LLC - Specializes in integrating manual power generation systems into sustainable building projects, enhancing off-grid capabilities for residential and commercial infrastructure.
The industry research and growth report includes detailed analyses of the competitive landscape of the market and information about key companies, including:
- AMEP Contracting LLC
- ANSMANN AG
- Changzhou Shengshijia Electronic
- Coghlans Ltd.
- EcoFlow
- Electric Pedals
- Freeplay Energy
- Goal Zero LLC
- K-TOR LLC.
- LIFESTRAW SARL
- Lion Energy
- Mid-States Companies
- NEXPOW Inc.
- OWI Inc.
- SunJack
- Tenergy Corp.
- Wagan Corporation
- Xantrex LLC
Qualitative and quantitative analysis of companies has been conducted to help clients understand the wider business environment as well as the strengths and weaknesses of key industry players. Data is qualitatively analyzed to categorize companies as pure play, category-focused, industry-focused, and diversified; it is quantitatively analyzed to categorize companies as dominant, leading, strong, tentative, and weak.
Recent Development and News in Hand crank power generator market
- In September, 2024, Goal Zero LLC announced the launch of its next-generation Sherpa series, incorporating a high-efficiency hand crank accessory designed to reduce charging time by 20% for its mid-size power banks.
- In November, 2024, Freeplay Energy entered into a strategic partnership with a major international humanitarian organization to supply 50,000 units of its new ruggedized, multi-band radio for deployment in disaster relief kits across Sub-Saharan Africa.
- In February, 2025, The U.S. Federal Emergency Management Agency (FEMA) updated its Ready.gov guidelines, explicitly recommending hand-crank devices with a minimum 2,000 mAh internal battery for all household emergency kits, influencing consumer purchasing standards.
- In April, 2025, K-TOR LLC. patented a new planetary gear system for its portable generators, claiming a 35% improvement in energy conversion efficiency, allowing users to generate more power with less physical effort.
Dive into Technavio’s robust research methodology, blending expert interviews, extensive data synthesis, and validated models for unparalleled Hand Crank Power Generator Market insights. See full methodology.
| Market Scope | |
|---|---|
| Page number | 285 |
| Base year | 2024 |
| Historic period | 2019-2023 |
| Forecast period | 2025-2029 |
| Growth momentum & CAGR | Accelerate at a CAGR of 8.3% |
| Market growth 2025-2029 | USD 10489.5 thousand |
| Market structure | Fragmented |
| YoY growth 2024-2025(%) | 8.2% |
| Key countries | China, Japan, India, South Korea, Australia, Indonesia, US, Canada, Mexico, Germany, UK, France, Italy, The Netherlands, Spain, Brazil, Argentina, Colombia, Saudi Arabia, UAE, South Africa, Israel and Turkey |
| Competitive landscape | Leading Companies, Market Positioning of Companies, Competitive Strategies, and Industry Risks |
Research Analyst Overview
- The hand crank power generator market is shaped by a persistent demand for self-sufficient power solutions, driven by needs in emergency preparedness, outdoor recreation, and disaster relief. The core technology, centered on a manual dynamo for mechanical energy conversion, produces a direct current output suitable for low-power devices.
- The market's competitive dynamic compels a strategic shift from basic utility to integrated systems. Boardroom decisions increasingly focus on product differentiation to counter commoditization, leading to the development of multifunctional units with a ruggedized housing, integrated solar panels, and a high-impact ABS build.
- These devices combine an alternator and gearbox into a sophisticated cranking mechanism with improved gear ratio efficiency, often including an LED flashlight, AM/FM radio with NOAA weather band, and an SOS alarm. High-performance models incorporating a durable planetary gear system and advanced smart-charging technologies can command a 40% price premium over basic units.
- The inclusion of a USB-C port and power bank functionality via a lithium-ion battery addresses the need to charge modern satellite messengers and rechargeable headlamps, moving the product from a simple off-grid power source to a vital portable power solution.
What are the Key Data Covered in this Hand Crank Power Generator Market Research and Growth Report?
-
What is the expected growth of the Hand Crank Power Generator Market between 2025 and 2029?
-
USD 10.49 million, at a CAGR of 8.3%
-
-
What segmentation does the market report cover?
-
The report is segmented by Product (Portable generators, and Stationary generators), Distribution Channel (Online, and Offline), End-user (Residential, Commercial, and Others) and Geography (APAC, North America, Europe, South America, Middle East and Africa)
-
-
Which regions are analyzed in the report?
-
APAC, North America, Europe, South America and Middle East and Africa
-
-
What are the key growth drivers and market challenges?
-
Escalating frequency of extreme weather events and heightened focus on emergency preparedness, Intense competition from superior and more convenient substitute technologies
-
-
Who are the major players in the Hand Crank Power Generator Market?
-
AMEP Contracting LLC, ANSMANN AG, Changzhou Shengshijia Electronic, Coghlans Ltd., EcoFlow, Electric Pedals, Freeplay Energy, Goal Zero LLC, K-TOR LLC., LIFESTRAW SARL, Lion Energy, Mid-States Companies, NEXPOW Inc., OWI Inc., SunJack, Tenergy Corp., Wagan Corporation and Xantrex LLC
-
Market Research Insights
- Market dynamics are shaped by the device's role as a last-resort energy source. The adoption of the portable emergency radio as a personal resilience tool has increased by over 20% in disaster-prone regions. This rising demand for grid-independent power is tempered by substitute technologies.
- For example, while human energy harvesting offers a sustainable power source, its cost per watt generated can be up to 60% higher than passive solar charging, influencing consumer choice. Innovations in manual power generation are transforming devices into multifunctional survival tools.
- Models designed as crisis communication tools now integrate features that have doubled their utility score in consumer rankings compared to units from three years prior. This focus on value-added functionality is a key strategy to maintain relevance against more convenient alternatives for off-grid charging and emergency use.
We can help! Our analysts can customize this hand crank power generator market research report to meet your requirements.
 RIA -
RIA - 
