Hardwood Market Analysis, Size, and Forecast 2026-2030: APAC (China, Japan, and India), North America (US, Canada, and Mexico), Europe (Germany, UK, and France), Middle East and Africa (Saudi Arabia, UAE, and South Africa), South America (Brazil and Argentina), and Rest of World (ROW)

Hardwood Market Analysis, Size, and Forecast 2026-2030:
APAC (China, Japan, and India), North America (US, Canada, and Mexico), Europe (Germany, UK, and France), Middle East and Africa (Saudi Arabia, UAE, and South Africa), South America (Brazil and Argentina), and Rest of World (ROW)

Published: Apr 2026 294 Pages SKU: IRTNTR75688

Market Overview at a Glance

$9.97 B
Market Opportunity
4.4%
CAGR 2025 - 2030
68.2%
APAC Growth
$18.94 B
Flooring segment 2024

Hardwood Market Size 2026-2030

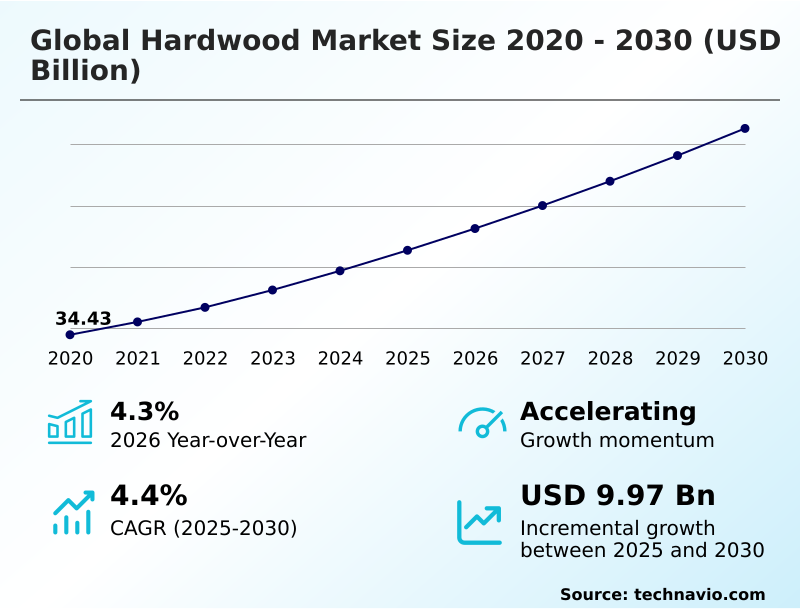
The hardwood market size is valued to increase by USD 9.97 billion, at a CAGR of 4.4% from 2025 to 2030. Proliferation of sustainable construction and green building mandates will drive the hardwood market.

Major Market Trends & Insights

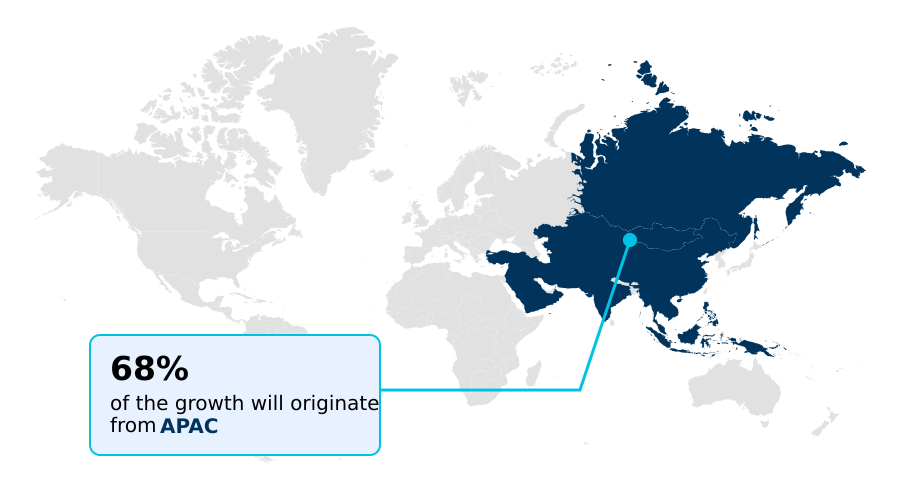
  • APAC dominated the market and accounted for a 68.2% growth during the forecast period.
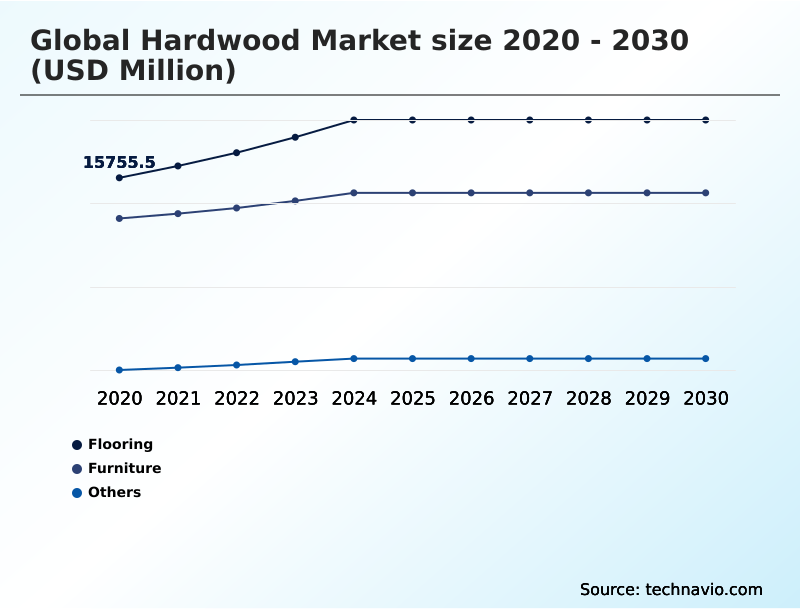
  • By Application - Flooring segment was valued at USD 18.94 billion in 2024
  • By Type - Ash segment accounted for the largest market revenue share in 2024

Market Size & Forecast

  • Market Opportunities: USD 16.88 billion
  • Market Future Opportunities: USD 9.97 billion
  • CAGR from 2025 to 2030 : 4.4%

Market Summary

  • The Hardwood Market is undergoing a strategic transformation, shaped by stringent environmental accountability and technological evolution. A primary driver is the rising adoption of green building standards, which favors materials with low embodied carbon and high carbon sequestration properties. This has increased demand for certified, deforestation-free timber managed through sustainable forest management practices.
  • Concurrently, the industry is navigating significant challenges, including complex regulatory compliance and competition from synthetic substitutes. In response, market participants are investing in technology; for example, a furniture manufacturing firm might implement automated sorting systems and laser-scanning technology. This enhances precision in primary milling and secondary manufacturing, maximizing the yield from each log.
  • Such advancements in advanced woodworking machinery not only improve operational efficiency but also enable the creation of digital product passports, ensuring material traceability from forest to final product. The integration of biophilic design in modern architecture further supports the use of natural wood surfaces, reinforcing the market's position in high-end applications.

What will be the Size of the Hardwood Market during the forecast period?

Get Key Insights on Market Forecast (PDF) Request Free Sample

How is the Hardwood Market Segmented?

The hardwood industry research report provides comprehensive data (region-wise segment analysis), with forecasts and estimates in "USD million" for the period 2026-2030, as well as historical data from 2020-2024 for the following segments.

  • Application
    • Flooring
    • Furniture
    • Others
  • Type
    • Ash
    • Cherry
    • Maple
    • Oak
    • Birch
  • End-user
    • Residential
    • Commercial
    • Industrial
  • Geography
    • APAC
      • China
      • Japan
      • India
    • North America
      • US
      • Canada
      • Mexico
    • Europe
      • Germany
      • UK
      • France
    • Middle East and Africa
      • Saudi Arabia
      • UAE
      • South Africa
    • South America
      • Brazil
      • Argentina
    • Rest of World (ROW)

By Application Insights

The flooring segment is estimated to witness significant growth during the forecast period.

The flooring segment is a cornerstone of the market, driven by demand for interior surfaces offering both aesthetic elegance and longevity. In residential construction, there is a clear preference for engineered wood products due to their enhanced dimensional stability.

Innovations in surface finishes, including advanced coatings, improve scratch resistance, making hardwood viable for high-traffic commercial applications. The focus on green building standards is pushing manufacturers towards deforestation-free timber and circular bioeconomy principles.

For instance, optimizing primary milling and secondary manufacturing processes has led to a 4.3% year-over-year increase in material efficiency, reducing waste and enhancing the structural integrity of wood-based panels for luxury flooring and other high-end applications.

Request Free Sample

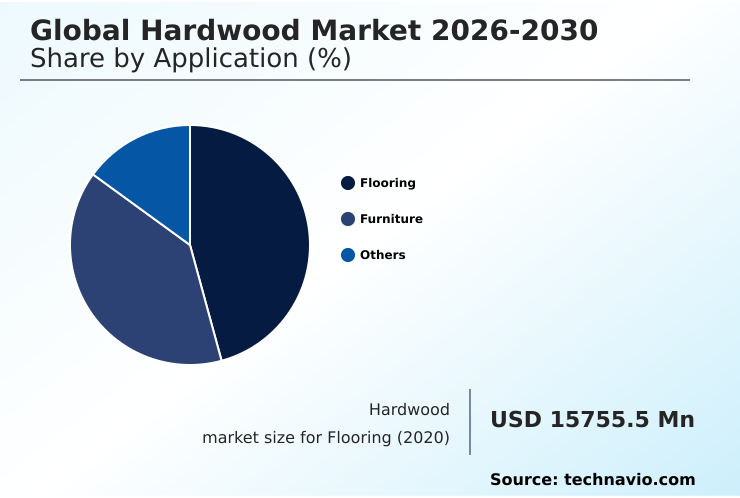
The Flooring segment was valued at USD 18.94 billion in 2024 and showed a gradual increase during the forecast period.

Request Free Sample

Regional Analysis

APAC is estimated to contribute 68.2% to the growth of the global market during the forecast period.Technavio’s analysts have elaborately explained the regional trends and drivers that shape the market during the forecast period.

See How Hardwood Market Demand is Rising in APAC Request Free Sample

Geographically, the market is led by APAC, which is projected to capture over 68% of incremental growth, expanding at a rate nearly 30% faster than North America.

This expansion is fueled by massive investments in residential construction and a thriving furniture manufacturing export industry in countries like China and Vietnam.

The region's demand for various wood species, including both temperate species and tropical species, supports a complex supply chain. European markets are driven by stringent regulatory compliance for timber certification and a strong preference for biophilic design in commercial applications.

In North America, the market benefits from a robust renovation sector and the specification of advanced materials, such as high-density fibreboard and moisture-resistant panels, which offer superior dimensional stability and structural integrity for modern building projects.

Market Dynamics

Our researchers analyzed the data with 2025 as the base year, along with the key drivers, trends, and challenges. A holistic analysis of drivers will help companies refine their marketing strategies to gain a competitive advantage.

  • Strategic decision-making in the hardwood sector requires a nuanced understanding of evolving material science and regulatory landscapes. Key considerations include the debate around hardwood vs softwood for construction, where factors like structural requirements and cost are critical. Similarly, the choice between engineered wood products vs solid wood depends on the application's need for stability versus traditional aesthetics.
  • The impact of green building standards is a dominant driver, compelling firms to explore sustainable hardwood sourcing strategies and navigate the cost of timber certification compliance. The future of wood-based biomaterials is promising, offering innovative alternatives. To enhance transparency and combat illegal logging, many are evaluating blockchain for timber supply chain management.
  • This is crucial for overcoming challenges in hardwood import export and adhering to tropical hardwood import regulations. Firms are also using digital tools for timber traceability and analyzing hardwood pricing trends analysis to inform procurement. Operationally, best practices in forest management are essential for long-term supply, with new technology in wood preservation extending product lifecycles.
  • For instance, projects using thermally modified timber report 25% fewer maintenance calls over a five-year period compared to untreated equivalents. Understanding the differences in kiln-dried vs air-dried hardwood durability, the specific qualities of ash vs oak for furniture, and how to manage threats like the emerald ash borer impact are vital.
  • The role of AI in timber processing is expanding, further optimizing the value chain.

What are the key market drivers leading to the rise in the adoption of Hardwood Industry?

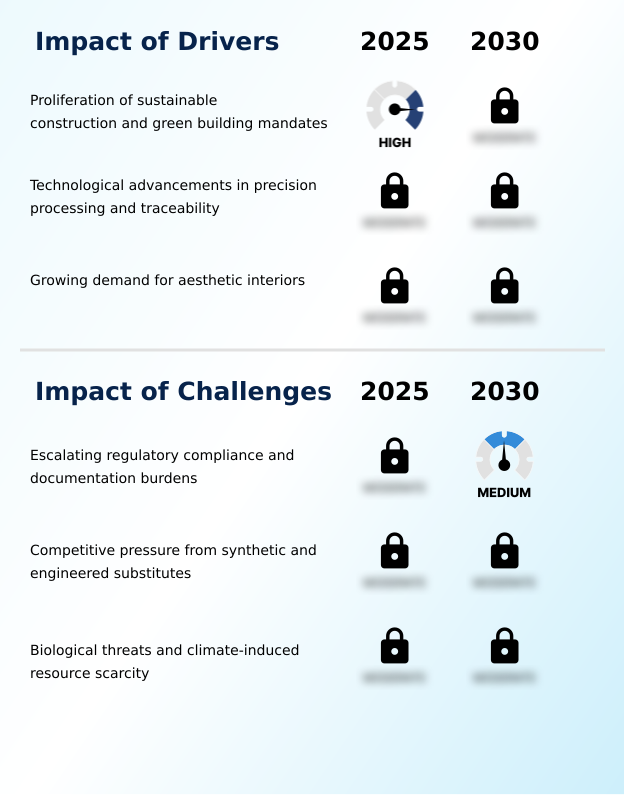
  • The proliferation of sustainable construction practices and green building mandates serves as a key driver for market expansion.

  • Market growth is fundamentally driven by the global push for sustainability in the built environment.
  • Green building standards that prioritize materials with low embodied carbon and superior carbon sequestration properties are accelerating the shift from steel and concrete to timber-based systems.
  • Projects that specify certified, deforestation-free timber often see a 10% higher valuation and can achieve regulatory approval up to 20% faster.
  • This driver is amplified by consumer preference for natural aesthetics, boosting demand for hardwood lumber and wood-based panels in high-end applications like luxury flooring and furniture manufacturing.
  • Consequently, sustainable forest management is not just an ethical consideration but a critical commercial strategy, ensuring a long-term supply of sawn timber and wood pulp while meeting stringent environmental accountability requirements.

What are the market trends shaping the Hardwood Industry?

  • The market is witnessing a significant trend toward the integration of advanced digital traceability, which is increasingly coupled with blockchain documentation to ensure supply chain transparency.

  • Key trends are reshaping market operations, with a strong emphasis on technological integration for transparency and efficiency. The adoption of digital product passports and laser-scanning technology is becoming standard, enabling verifiable material traceability from forest to consumer. These systems have been shown to improve raw material utilization by over 15% during primary milling and secondary manufacturing.
  • In parallel, the trend of biophilic design is driving demand for specific wood grain patterns and surface finishes in interior design and architectural millwork. To meet this demand for renewable materials, manufacturers are innovating with wood treatment processes, including thermal modification, which enhances the durability of temperate species for outdoor use.
  • This pivot towards data-driven sustainability, supported by advanced woodworking machinery, allows for better timberland management and aligns with circular bioeconomy principles.

What challenges does the Hardwood Industry face during its growth?

  • Escalating regulatory compliance requirements and the associated documentation burdens present a key challenge to industry growth.

  • The primary challenge facing the market is the escalating complexity of regulatory compliance and the associated documentation burdens. Mandates requiring granular data for timber certification impose significant administrative and financial strains, with compliance-related activities now accounting for up to 5% of total project cost in some regions.
  • Failure to provide adequate proof of supply chain transparency can result in market exclusion or fines that have increased by 50% in recent years. This environment creates friction, especially for smaller operators, and intensifies competition from synthetic substitutes that are not subject to the same level of scrutiny.
  • Furthermore, biological threats and resource scarcity continue to pressure supply chains, making robust timberland management and diversification of wood species essential for mitigating risk and ensuring long-term operational viability.

Exclusive Technavio Analysis on Customer Landscape

The hardwood market forecasting report includes the adoption lifecycle of the market, covering from the innovator’s stage to the laggard’s stage. It focuses on adoption rates in different regions based on penetration. Furthermore, the hardwood market report also includes key purchase criteria and drivers of price sensitivity to help companies evaluate and develop their market growth analysis strategies.

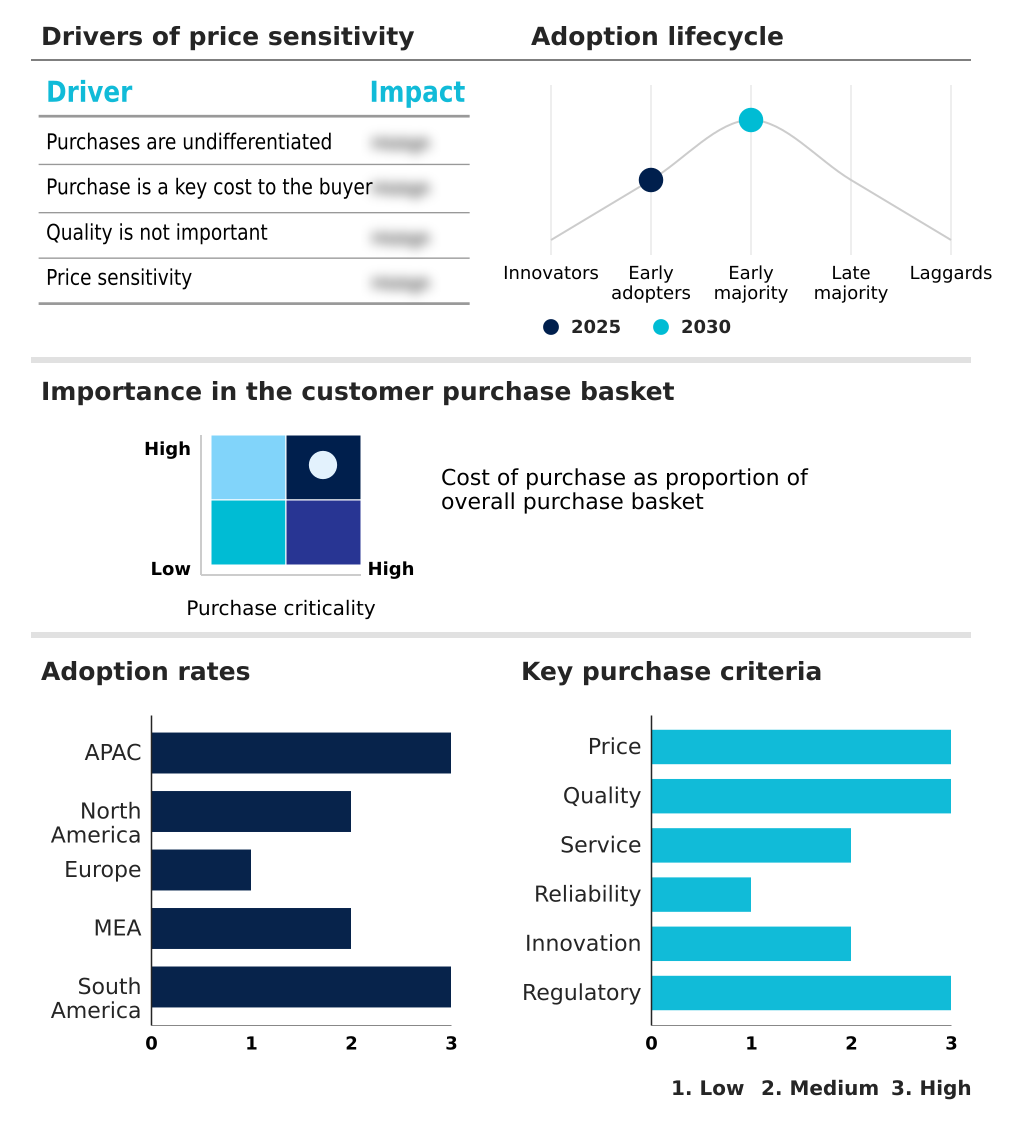
Customer Landscape of Hardwood Industry

Competitive Landscape

Companies are implementing various strategies, such as strategic alliances, hardwood market forecast, partnerships, mergers and acquisitions, geographical expansion, and product/service launches, to enhance their presence in the industry.

Binderholz GmbH - Core offerings comprise engineered wood products and plywood, targeting construction applications that demand durable and structurally sound materials for superior performance.

The industry research and growth report includes detailed analyses of the competitive landscape of the market and information about key companies, including:

  • Binderholz GmbH
  • Boise Cascade Co.
  • Canfor Corp.
  • Egger Group
  • Empresas CMPC SA
  • Georgia Pacific LLC
  • Greenply Industries Ltd.
  • Interfor Corp.
  • Kronospan Ltd.
  • Metsa Group
  • Pfeifer Holding GmbH
  • Rayonier Inc.
  • Samling Timber
  • Sodra
  • Stora Enso Oyj
  • UPM Kymmene Corp.
  • Vicat S.A.
  • West Fraser Timber Co. Ltd.
  • Weyerhaeuser Co.

Qualitative and quantitative analysis of companies has been conducted to help clients understand the wider business environment as well as the strengths and weaknesses of key industry players. Data is qualitatively analyzed to categorize companies as pure play, category-focused, industry-focused, and diversified; it is quantitatively analyzed to categorize companies as dominant, leading, strong, tentative, and weak.

Recent Development and News in Hardwood market

  • In November 2024, EGGER Group announced an investment of more than $214 million to upgrade its particleboard plant in Markt Bibart, Germany, focusing on advanced equipment to process recycled wood.
  • In April 2025, AHF Products introduced its Bruce unfinished solid and engineered hardwood flooring line, entering the unfinished segment to meet demand for customizable flooring in residential and commercial projects.
  • In December 2024, Stora Enso Oyj announced the successful pilot of its new digital product passport system, providing customers with real-time data on the origin and carbon footprint of its timber products.
  • In March 2025, Weyerhaeuser Co. completed the acquisition of a specialized engineered wood products manufacturer, expanding its portfolio of high-performance building materials for the residential construction sector.

Dive into Technavio’s robust research methodology, blending expert interviews, extensive data synthesis, and validated models for unparalleled Hardwood Market insights. See full methodology.

Market Scope
Page number 294
Base year 2025
Historic period 2020-2024
Forecast period 2026-2030
Growth momentum & CAGR Accelerate at a CAGR of 4.4%
Market growth 2026-2030 USD 9968.7 million
Market structure Fragmented
YoY growth 2025-2026(%) 4.3%
Key countries China, Japan, India, South Korea, Australia, Indonesia, US, Canada, Mexico, Germany, UK, France, Italy, Spain, The Netherlands, Saudi Arabia, UAE, South Africa, Israel, Turkey, Brazil, Argentina and Chile
Competitive landscape Leading Companies, Market Positioning of Companies, Competitive Strategies, and Industry Risks

Request Free Sample

Research Analyst Overview

  • The hardwood market is defined by a strategic shift toward premium, value-added materials and verifiable supply chains. The integration of advanced woodworking machinery and sustainable forest management practices is no longer a differentiator but a baseline requirement for market participation.
  • Boardroom decisions are increasingly centered on technology adoption to navigate complex trade regulations; for example, investing in digital product passports is becoming critical to maintain access to European markets. This technology has been shown to reduce documentation-related delays by over 30%.
  • Key materials like hardwood lumber, sawn timber, and veneer sheets are being processed with unprecedented precision through automated sorting systems. The emphasis is on enhancing the structural integrity of timber-based systems and wood-based panels for demanding architectural millwork.
  • As the industry moves toward a circular bioeconomy, the focus on low embodied carbon materials, timber harvesting efficiency, and deforestation-free timber sources will continue to intensify, reshaping both production and sourcing strategies globally.

What are the Key Data Covered in this Hardwood Market Research and Growth Report?

  • What is the expected growth of the Hardwood Market between 2026 and 2030?

    • USD 9.97 billion, at a CAGR of 4.4%

  • What segmentation does the market report cover?

    • The report is segmented by Application (Flooring, Furniture, and Others), Type (Ash, Cherry, Maple, Oak, and Birch), End-user (Residential, Commercial, and Industrial) and Geography (APAC, North America, Europe, Middle East and Africa, South America)

  • Which regions are analyzed in the report?

    • APAC, North America, Europe, Middle East and Africa and South America

  • What are the key growth drivers and market challenges?

    • Proliferation of sustainable construction and green building mandates, Escalating regulatory compliance and documentation burdens

  • Who are the major players in the Hardwood Market?

    • Binderholz GmbH, Boise Cascade Co., Canfor Corp., Egger Group, Empresas CMPC SA, Georgia Pacific LLC, Greenply Industries Ltd., Interfor Corp., Kronospan Ltd., Metsa Group, Pfeifer Holding GmbH, Rayonier Inc., Samling Timber, Sodra, Stora Enso Oyj, UPM Kymmene Corp., Vicat S.A., West Fraser Timber Co. Ltd. and Weyerhaeuser Co.

Market Research Insights

  • Market dynamics are increasingly influenced by a focus on verifiable sustainability and performance. The push for supply chain transparency has led to the adoption of advanced wood treatment processes, with firms reporting up to a 30% improvement in compliance documentation speed.
  • Demand from the residential construction sector, particularly for cabinetry and interior design elements, now accounts for over 60% of temperate species consumption. This is reshaping forestry support programs toward specific wood species. Furthermore, the specification of certified solid wood in commercial applications is rising, as it aligns with corporate environmental accountability goals.
  • This shift has resulted in a measurable 15% reduction in project lifecycle costs for builders who prioritize certified materials over those facing resource scarcity issues.

We can help! Our analysts can customize this hardwood market research report to meet your requirements.

Get in touch

1. Executive Summary

1.1 Market overview

Executive Summary - Chart on Market Overview
Executive Summary - Data Table on Market Overview
Executive Summary - Chart on Global Market Characteristics
Executive Summary - Chart on Market by Geography
Executive Summary - Chart on Market Segmentation by Application
Executive Summary - Chart on Market Segmentation by Type
Executive Summary - Chart on Market Segmentation by End-user
Executive Summary - Chart on Incremental Growth
Executive Summary - Data Table on Incremental Growth
Executive Summary - Chart on Company Market Positioning

2. Technavio Analysis

2.1 Analysis of price sensitivity, lifecycle, customer purchase basket, adoption rates, and purchase criteria

2.2 Criticality of inputs and Factors of differentiation

Chart on Overview on criticality of inputs and factors of differentiation

2.3 Factors of disruption

Chart on Overview on factors of disruption

2.4 Impact of drivers and challenges

Chart on Impact of drivers and challenges in 2025 and 2030

3. Market Landscape

3.1 Market ecosystem

Chart on Parent Market
Data Table on - Parent Market

3.2 Market characteristics

Chart on Market characteristics analysis

3.3 Value chain analysis

Chart on Value chain analysis

4. Market Sizing

4.1 Market definition

Data Table on Offerings of companies included in the market definition

4.2 Market segment analysis

Market segments

4.3 Market size 2025

4.4 Market outlook: Forecast for 2025-2030

Chart on Global - Market size and forecast 2025-2030 ($ million)
Data Table on Global - Market size and forecast 2025-2030 ($ million)
Chart on Global Market: Year-over-year growth 2025-2030 (%)
Data Table on Global Market: Year-over-year growth 2025-2030 (%)

5. Historic Market Size

5.1 Global Hardwood Market 2020 - 2024

Historic Market Size - Data Table on Global Hardwood Market 2020 - 2024 ($ million)

5.2 Application segment analysis 2020 - 2024

Historic Market Size - Application Segment 2020 - 2024 ($ million)

5.3 Type segment analysis 2020 - 2024

Historic Market Size - Type Segment 2020 - 2024 ($ million)

5.4 End-user segment analysis 2020 - 2024

Historic Market Size - End-user Segment 2020 - 2024 ($ million)

5.5 Geography segment analysis 2020 - 2024

Historic Market Size - Geography Segment 2020 - 2024 ($ million)

5.6 Country segment analysis 2020 - 2024

Historic Market Size - Country Segment 2020 - 2024 ($ million)

6. Qualitative Analysis

6.1 Impact of AI in Global Hardwood Market

6.2 Impact of Geopolitical Conflict for Global Hardwood Market

7. Five Forces Analysis

7.1 Five forces summary

Five forces analysis - Comparison between 2025 and 2030

7.2 Bargaining power of buyers

Bargaining power of buyers - Impact of key factors 2025 and 2030

7.3 Bargaining power of suppliers

Bargaining power of suppliers - Impact of key factors in 2025 and 2030

7.4 Threat of new entrants

Threat of new entrants - Impact of key factors in 2025 and 2030

7.5 Threat of substitutes

Threat of substitutes - Impact of key factors in 2025 and 2030

7.6 Threat of rivalry

Threat of rivalry - Impact of key factors in 2025 and 2030

7.7 Market condition

Chart on Market condition - Five forces 2025 and 2030

8. Market Segmentation by Application

8.1 Market segments

Chart on Application - Market share 2025-2030 (%)
Data Table on Application - Market share 2025-2030 (%)

8.2 Comparison by Application

Chart on Comparison by Application
Data Table on Comparison by Application

8.3 Flooring - Market size and forecast 2025-2030

Chart on Flooring - Market size and forecast 2025-2030 ($ million)
Data Table on Flooring - Market size and forecast 2025-2030 ($ million)
Chart on Flooring - Year-over-year growth 2025-2030 (%)
Data Table on Flooring - Year-over-year growth 2025-2030 (%)

8.4 Furniture - Market size and forecast 2025-2030

Chart on Furniture - Market size and forecast 2025-2030 ($ million)
Data Table on Furniture - Market size and forecast 2025-2030 ($ million)
Chart on Furniture - Year-over-year growth 2025-2030 (%)
Data Table on Furniture - Year-over-year growth 2025-2030 (%)

8.5 Others - Market size and forecast 2025-2030

Chart on Others - Market size and forecast 2025-2030 ($ million)
Data Table on Others - Market size and forecast 2025-2030 ($ million)
Chart on Others - Year-over-year growth 2025-2030 (%)
Data Table on Others - Year-over-year growth 2025-2030 (%)

8.6 Market opportunity by Application

Market opportunity by Application ($ million)
Data Table on Market opportunity by Application ($ million)

9. Market Segmentation by Type

9.1 Market segments

Chart on Type - Market share 2025-2030 (%)
Data Table on Type - Market share 2025-2030 (%)

9.2 Comparison by Type

Chart on Comparison by Type
Data Table on Comparison by Type

9.3 Ash - Market size and forecast 2025-2030

Chart on Ash - Market size and forecast 2025-2030 ($ million)
Data Table on Ash - Market size and forecast 2025-2030 ($ million)
Chart on Ash - Year-over-year growth 2025-2030 (%)
Data Table on Ash - Year-over-year growth 2025-2030 (%)

9.4 Cherry - Market size and forecast 2025-2030

Chart on Cherry - Market size and forecast 2025-2030 ($ million)
Data Table on Cherry - Market size and forecast 2025-2030 ($ million)
Chart on Cherry - Year-over-year growth 2025-2030 (%)
Data Table on Cherry - Year-over-year growth 2025-2030 (%)

9.5 Maple - Market size and forecast 2025-2030

Chart on Maple - Market size and forecast 2025-2030 ($ million)
Data Table on Maple - Market size and forecast 2025-2030 ($ million)
Chart on Maple - Year-over-year growth 2025-2030 (%)
Data Table on Maple - Year-over-year growth 2025-2030 (%)

9.6 Oak - Market size and forecast 2025-2030

Chart on Oak - Market size and forecast 2025-2030 ($ million)
Data Table on Oak - Market size and forecast 2025-2030 ($ million)
Chart on Oak - Year-over-year growth 2025-2030 (%)
Data Table on Oak - Year-over-year growth 2025-2030 (%)

9.7 Birch - Market size and forecast 2025-2030

Chart on Birch - Market size and forecast 2025-2030 ($ million)
Data Table on Birch - Market size and forecast 2025-2030 ($ million)
Chart on Birch - Year-over-year growth 2025-2030 (%)
Data Table on Birch - Year-over-year growth 2025-2030 (%)

9.8 Market opportunity by Type

Market opportunity by Type ($ million)
Data Table on Market opportunity by Type ($ million)

10. Market Segmentation by End-user

10.1 Market segments

Chart on End-user - Market share 2025-2030 (%)
Data Table on End-user - Market share 2025-2030 (%)

10.2 Comparison by End-user

Chart on Comparison by End-user
Data Table on Comparison by End-user

10.3 Residential - Market size and forecast 2025-2030

Chart on Residential - Market size and forecast 2025-2030 ($ million)
Data Table on Residential - Market size and forecast 2025-2030 ($ million)
Chart on Residential - Year-over-year growth 2025-2030 (%)
Data Table on Residential - Year-over-year growth 2025-2030 (%)

10.4 Commercial - Market size and forecast 2025-2030

Chart on Commercial - Market size and forecast 2025-2030 ($ million)
Data Table on Commercial - Market size and forecast 2025-2030 ($ million)
Chart on Commercial - Year-over-year growth 2025-2030 (%)
Data Table on Commercial - Year-over-year growth 2025-2030 (%)

10.5 Industrial - Market size and forecast 2025-2030

Chart on Industrial - Market size and forecast 2025-2030 ($ million)
Data Table on Industrial - Market size and forecast 2025-2030 ($ million)
Chart on Industrial - Year-over-year growth 2025-2030 (%)
Data Table on Industrial - Year-over-year growth 2025-2030 (%)

10.6 Market opportunity by End-user

Market opportunity by End-user ($ million)
Data Table on Market opportunity by End-user ($ million)

11. Customer Landscape

11.1 Customer landscape overview

Analysis of price sensitivity, lifecycle, customer purchase basket, adoption rates, and purchase criteria

12. Geographic Landscape

12.1 Geographic segmentation

Chart on Market share by geography 2025-2030 (%)
Data Table on Market share by geography 2025-2030 (%)

12.2 Geographic comparison

Chart on Geographic comparison
Data Table on Geographic comparison

12.3 APAC - Market size and forecast 2025-2030

Chart on APAC - Market size and forecast 2025-2030 ($ million)
Data Table on APAC - Market size and forecast 2025-2030 ($ million)
Chart on APAC - Year-over-year growth 2025-2030 (%)
Data Table on APAC - Year-over-year growth 2025-2030 (%)
Chart on Regional Comparison - APAC
Data Table on Regional Comparison - APAC

12.3.1 China - Market size and forecast 2025-2030

Chart on China - Market size and forecast 2025-2030 ($ million)
Data Table on China - Market size and forecast 2025-2030 ($ million)
Chart on China - Year-over-year growth 2025-2030 (%)
Data Table on China - Year-over-year growth 2025-2030 (%)

12.3.2 Japan - Market size and forecast 2025-2030

Chart on Japan - Market size and forecast 2025-2030 ($ million)
Data Table on Japan - Market size and forecast 2025-2030 ($ million)
Chart on Japan - Year-over-year growth 2025-2030 (%)
Data Table on Japan - Year-over-year growth 2025-2030 (%)

12.3.3 India - Market size and forecast 2025-2030

Chart on India - Market size and forecast 2025-2030 ($ million)
Data Table on India - Market size and forecast 2025-2030 ($ million)
Chart on India - Year-over-year growth 2025-2030 (%)
Data Table on India - Year-over-year growth 2025-2030 (%)

12.3.4 South Korea - Market size and forecast 2025-2030

Chart on South Korea - Market size and forecast 2025-2030 ($ million)
Data Table on South Korea - Market size and forecast 2025-2030 ($ million)
Chart on South Korea - Year-over-year growth 2025-2030 (%)
Data Table on South Korea - Year-over-year growth 2025-2030 (%)

12.3.5 Australia - Market size and forecast 2025-2030

Chart on Australia - Market size and forecast 2025-2030 ($ million)
Data Table on Australia - Market size and forecast 2025-2030 ($ million)
Chart on Australia - Year-over-year growth 2025-2030 (%)
Data Table on Australia - Year-over-year growth 2025-2030 (%)

12.3.6 Indonesia - Market size and forecast 2025-2030

Chart on Indonesia - Market size and forecast 2025-2030 ($ million)
Data Table on Indonesia - Market size and forecast 2025-2030 ($ million)
Chart on Indonesia - Year-over-year growth 2025-2030 (%)
Data Table on Indonesia - Year-over-year growth 2025-2030 (%)

12.4 North America - Market size and forecast 2025-2030

Chart on North America - Market size and forecast 2025-2030 ($ million)
Data Table on North America - Market size and forecast 2025-2030 ($ million)
Chart on North America - Year-over-year growth 2025-2030 (%)
Data Table on North America - Year-over-year growth 2025-2030 (%)
Chart on Regional Comparison - North America
Data Table on Regional Comparison - North America

12.4.1 US - Market size and forecast 2025-2030

Chart on US - Market size and forecast 2025-2030 ($ million)
Data Table on US - Market size and forecast 2025-2030 ($ million)
Chart on US - Year-over-year growth 2025-2030 (%)
Data Table on US - Year-over-year growth 2025-2030 (%)

12.4.2 Canada - Market size and forecast 2025-2030

Chart on Canada - Market size and forecast 2025-2030 ($ million)
Data Table on Canada - Market size and forecast 2025-2030 ($ million)
Chart on Canada - Year-over-year growth 2025-2030 (%)
Data Table on Canada - Year-over-year growth 2025-2030 (%)

12.4.3 Mexico - Market size and forecast 2025-2030

Chart on Mexico - Market size and forecast 2025-2030 ($ million)
Data Table on Mexico - Market size and forecast 2025-2030 ($ million)
Chart on Mexico - Year-over-year growth 2025-2030 (%)
Data Table on Mexico - Year-over-year growth 2025-2030 (%)

12.5 Europe - Market size and forecast 2025-2030

Chart on Europe - Market size and forecast 2025-2030 ($ million)
Data Table on Europe - Market size and forecast 2025-2030 ($ million)
Chart on Europe - Year-over-year growth 2025-2030 (%)
Data Table on Europe - Year-over-year growth 2025-2030 (%)
Chart on Regional Comparison - Europe
Data Table on Regional Comparison - Europe

12.5.1 Germany - Market size and forecast 2025-2030

Chart on Germany - Market size and forecast 2025-2030 ($ million)
Data Table on Germany - Market size and forecast 2025-2030 ($ million)
Chart on Germany - Year-over-year growth 2025-2030 (%)
Data Table on Germany - Year-over-year growth 2025-2030 (%)

12.5.2 UK - Market size and forecast 2025-2030

Chart on UK - Market size and forecast 2025-2030 ($ million)
Data Table on UK - Market size and forecast 2025-2030 ($ million)
Chart on UK - Year-over-year growth 2025-2030 (%)
Data Table on UK - Year-over-year growth 2025-2030 (%)

12.5.3 France - Market size and forecast 2025-2030

Chart on France - Market size and forecast 2025-2030 ($ million)
Data Table on France - Market size and forecast 2025-2030 ($ million)
Chart on France - Year-over-year growth 2025-2030 (%)
Data Table on France - Year-over-year growth 2025-2030 (%)

12.5.4 Italy - Market size and forecast 2025-2030

Chart on Italy - Market size and forecast 2025-2030 ($ million)
Data Table on Italy - Market size and forecast 2025-2030 ($ million)
Chart on Italy - Year-over-year growth 2025-2030 (%)
Data Table on Italy - Year-over-year growth 2025-2030 (%)

12.5.5 Spain - Market size and forecast 2025-2030

Chart on Spain - Market size and forecast 2025-2030 ($ million)
Data Table on Spain - Market size and forecast 2025-2030 ($ million)
Chart on Spain - Year-over-year growth 2025-2030 (%)
Data Table on Spain - Year-over-year growth 2025-2030 (%)

12.5.6 The Netherlands - Market size and forecast 2025-2030

Chart on The Netherlands - Market size and forecast 2025-2030 ($ million)
Data Table on The Netherlands - Market size and forecast 2025-2030 ($ million)
Chart on The Netherlands - Year-over-year growth 2025-2030 (%)
Data Table on The Netherlands - Year-over-year growth 2025-2030 (%)

12.6 Middle East and Africa - Market size and forecast 2025-2030

Chart on Middle East and Africa - Market size and forecast 2025-2030 ($ million)
Data Table on Middle East and Africa - Market size and forecast 2025-2030 ($ million)
Chart on Middle East and Africa - Year-over-year growth 2025-2030 (%)
Data Table on Middle East and Africa - Year-over-year growth 2025-2030 (%)
Chart on Regional Comparison - Middle East and Africa
Data Table on Regional Comparison - Middle East and Africa

12.6.1 Saudi Arabia - Market size and forecast 2025-2030

Chart on Saudi Arabia - Market size and forecast 2025-2030 ($ million)
Data Table on Saudi Arabia - Market size and forecast 2025-2030 ($ million)
Chart on Saudi Arabia - Year-over-year growth 2025-2030 (%)
Data Table on Saudi Arabia - Year-over-year growth 2025-2030 (%)

12.6.2 UAE - Market size and forecast 2025-2030

Chart on UAE - Market size and forecast 2025-2030 ($ million)
Data Table on UAE - Market size and forecast 2025-2030 ($ million)
Chart on UAE - Year-over-year growth 2025-2030 (%)
Data Table on UAE - Year-over-year growth 2025-2030 (%)

12.6.3 South Africa - Market size and forecast 2025-2030

Chart on South Africa - Market size and forecast 2025-2030 ($ million)
Data Table on South Africa - Market size and forecast 2025-2030 ($ million)
Chart on South Africa - Year-over-year growth 2025-2030 (%)
Data Table on South Africa - Year-over-year growth 2025-2030 (%)

12.6.4 Israel - Market size and forecast 2025-2030

Chart on Israel - Market size and forecast 2025-2030 ($ million)
Data Table on Israel - Market size and forecast 2025-2030 ($ million)
Chart on Israel - Year-over-year growth 2025-2030 (%)
Data Table on Israel - Year-over-year growth 2025-2030 (%)

12.6.5 Turkey - Market size and forecast 2025-2030

Chart on Turkey - Market size and forecast 2025-2030 ($ million)
Data Table on Turkey - Market size and forecast 2025-2030 ($ million)
Chart on Turkey - Year-over-year growth 2025-2030 (%)
Data Table on Turkey - Year-over-year growth 2025-2030 (%)

12.7 South America - Market size and forecast 2025-2030

Chart on South America - Market size and forecast 2025-2030 ($ million)
Data Table on South America - Market size and forecast 2025-2030 ($ million)
Chart on South America - Year-over-year growth 2025-2030 (%)
Data Table on South America - Year-over-year growth 2025-2030 (%)
Chart on Regional Comparison - South America
Data Table on Regional Comparison - South America

12.7.1 Brazil - Market size and forecast 2025-2030

Chart on Brazil - Market size and forecast 2025-2030 ($ million)
Data Table on Brazil - Market size and forecast 2025-2030 ($ million)
Chart on Brazil - Year-over-year growth 2025-2030 (%)
Data Table on Brazil - Year-over-year growth 2025-2030 (%)

12.7.2 Argentina - Market size and forecast 2025-2030

Chart on Argentina - Market size and forecast 2025-2030 ($ million)
Data Table on Argentina - Market size and forecast 2025-2030 ($ million)
Chart on Argentina - Year-over-year growth 2025-2030 (%)
Data Table on Argentina - Year-over-year growth 2025-2030 (%)

12.7.3 Chile - Market size and forecast 2025-2030

Chart on Chile - Market size and forecast 2025-2030 ($ million)
Data Table on Chile - Market size and forecast 2025-2030 ($ million)
Chart on Chile - Year-over-year growth 2025-2030 (%)
Data Table on Chile - Year-over-year growth 2025-2030 (%)

12.8 Market opportunity by geography

Market opportunity by geography ($ million)
Data Tables on Market opportunity by geography ($ million)

13. Drivers, Challenges, and Opportunity

13.1 Market drivers

Proliferation of sustainable construction and green building mandates
Technological advancements in precision processing and traceability
Growing demand for aesthetic interiors

13.2 Market challenges

Escalating regulatory compliance and documentation burdens
Competitive pressure from synthetic and engineered substitutes
Biological threats and climate-induced resource scarcity

13.3 Impact of drivers and challenges

Impact of drivers and challenges in 2025 and 2030

13.4 Market opportunities

Integration of advanced digital traceability and blockchain documentation
Resurgence of biophilic design and character-grade aesthetics
Strategic diversification into underutilized species and domestic sourcing

14. Competitive Landscape

14.1 Overview

14.2

Overview on criticality of inputs and factors of differentiation

14.3 Landscape disruption

Overview on factors of disruption

14.4 Industry risks

Impact of key risks on business

15. Competitive Analysis

15.1 Companies profiled

Companies covered

15.2 Company ranking index

15.3 Market positioning of companies

Matrix on companies position and classification

15.4 Boise Cascade Co.

Boise Cascade Co. - Overview
Boise Cascade Co. - Business segments
Boise Cascade Co. - Key offerings
Boise Cascade Co. - Segment focus
SWOT

15.5 Canfor Corp.

Canfor Corp. - Overview
Canfor Corp. - Business segments
Canfor Corp. - Key offerings
Canfor Corp. - Segment focus
SWOT

15.6 Empresas CMPC SA

Empresas CMPC SA - Overview
Empresas CMPC SA - Business segments
Empresas CMPC SA - Key offerings
Empresas CMPC SA - Segment focus
SWOT

15.7 Georgia Pacific LLC

Georgia Pacific LLC - Overview
Georgia Pacific LLC - Product / Service
Georgia Pacific LLC - Key offerings
SWOT

15.8 Greenply Industries Ltd.

Greenply Industries Ltd. - Overview
Greenply Industries Ltd. - Business segments
Greenply Industries Ltd. - Key offerings
Greenply Industries Ltd. - Segment focus
SWOT

15.9 Interfor Corp.

Interfor Corp. - Overview
Interfor Corp. - Product / Service
Interfor Corp. - Key offerings
SWOT

15.10 Kronospan Ltd.

Kronospan Ltd. - Overview
Kronospan Ltd. - Product / Service
Kronospan Ltd. - Key offerings
SWOT

15.11 Pfeifer Holding GmbH

Pfeifer Holding GmbH - Overview
Pfeifer Holding GmbH - Product / Service
Pfeifer Holding GmbH - Key offerings
SWOT

15.12 Rayonier Inc.

Rayonier Inc. - Overview
Rayonier Inc. - Business segments
Rayonier Inc. - Key offerings
Rayonier Inc. - Segment focus
SWOT

15.13 Samling Timber

Samling Timber - Overview
Samling Timber - Product / Service
Samling Timber - Key offerings
SWOT

15.14 Stora Enso Oyj

Stora Enso Oyj - Overview
Stora Enso Oyj - Business segments
Stora Enso Oyj - Key offerings
Stora Enso Oyj - Segment focus
SWOT

15.15 UPM Kymmene Corp.

UPM Kymmene Corp. - Overview
UPM Kymmene Corp. - Business segments
UPM Kymmene Corp. - Key offerings
UPM Kymmene Corp. - Segment focus
SWOT

15.16 Vicat S.A.

Vicat S.A. - Overview
Vicat S.A. - Business segments
Vicat S.A. - Key offerings
Vicat S.A. - Segment focus
SWOT

15.17 West Fraser Timber Co. Ltd.

West Fraser Timber Co. Ltd. - Overview
West Fraser Timber Co. Ltd. - Business segments
West Fraser Timber Co. Ltd. - Key offerings
West Fraser Timber Co. Ltd. - Segment focus
SWOT

15.18 Weyerhaeuser Co.

Weyerhaeuser Co. - Overview
Weyerhaeuser Co. - Business segments
Weyerhaeuser Co. - Key offerings
Weyerhaeuser Co. - Segment focus
SWOT

16. Appendix

16.1 Scope of the report

Market definition
Objectives
Notes and caveats

16.2 Inclusions and exclusions checklist

Inclusions checklist
Exclusions checklist

16.3 Currency conversion rates for US$

16.4 Research methodology

16.5 Data procurement

Information sources

16.6 Data validation

16.7 Validation techniques employed for market sizing

16.8 Data synthesis

16.9 360 degree market analysis

16.10 List of abbreviations

Research Methodology

Technavio presents a detailed picture of the market by way of study, synthesis, and summation of data from multiple sources. The analysts have presented the various facets of the market with a particular focus on identifying the key industry influencers. The data thus presented is comprehensive, reliable, and the result of extensive research, both primary and secondary.

INFORMATION SOURCES

Primary sources

  • Manufacturers and suppliers
  • Channel partners
  • Industry experts
  • Strategic decision makers

Secondary sources

  • Industry journals and periodicals
  • Government data
  • Financial reports of key industry players
  • Historical data
  • Press releases

DATA ANALYSIS

Data Synthesis

  • Collation of data
  • Estimation of key figures
  • Analysis of derived insights

Data Validation

  • Triangulation with data models
  • Reference against proprietary databases
  • Corroboration with industry experts

REPORT WRITING

Qualitative

  • Market drivers
  • Market challenges
  • Market trends
  • Five forces analysis

Quantitative

  • Market size and forecast
  • Market segmentation
  • Geographical insights
  • Competitive landscape

Interested in this report?

Get your sample now to see our research methodology and insights!

Download Now

Frequently Asked Questions

Hardwood market growth will increase by USD 9968.7 million during 2026-2030.

The Hardwood market is expected to grow at a CAGR of 4.4% during 2026-2030.

Hardwood market is segmented by Application (Flooring, Furniture, Others) Type (Ash, Cherry, Maple, Oak, Birch) End-user (Residential, Commercial, Industrial)

Binderholz GmbH, Boise Cascade Co., Canfor Corp., Egger Group, Empresas CMPC SA, Georgia Pacific LLC, Greenply Industries Ltd., Interfor Corp., Kronospan Ltd., Metsa Group, Pfeifer Holding GmbH, Rayonier Inc., Samling Timber, Sodra, Stora Enso Oyj, UPM Kymmene Corp., Vicat S.A., West Fraser Timber Co. Ltd., Weyerhaeuser Co. are a few of the key vendors in the Hardwood market.

APAC will register the highest growth rate of 68.2% among the other regions. Therefore, the Hardwood market in APAC is expected to garner significant business opportunities for the vendors during the forecast period.

China, Japan, India, South Korea, Australia, Indonesia, US, Canada, Mexico, Germany, UK, France, Italy, Spain, The Netherlands, Saudi Arabia, UAE, South Africa, Israel, Turkey, Brazil, Argentina, Chile

  • Proliferation of sustainable construction and green building mandates is the driving factor this market.

The Hardwood market vendors should focus on grabbing business opportunities from the Application segment as it accounted for the largest market share in the base year.
RIA - Research AI Assistant
Ask RIA