Hockey Equipment Market Analysis North America, Europe, APAC, South America, Middle East and Africa - US, Canada, Russia, Sweden, Finland - Size and Forecast 2024-2028

Hockey Equipment Market Analysis North America, Europe, APAC, South America, Middle East and Africa - US, Canada, Russia, Sweden, Finland - Size and Forecast 2024-2028

Published: Dec 2023 147 Pages SKU: IRTNTR77026

Market Overview at a Glance

$2.69 B
Market Opportunity
6.91%
CAGR
6.49
YoY growth 2023-2024(%)

Hockey Equipment Market Size 2024-2028

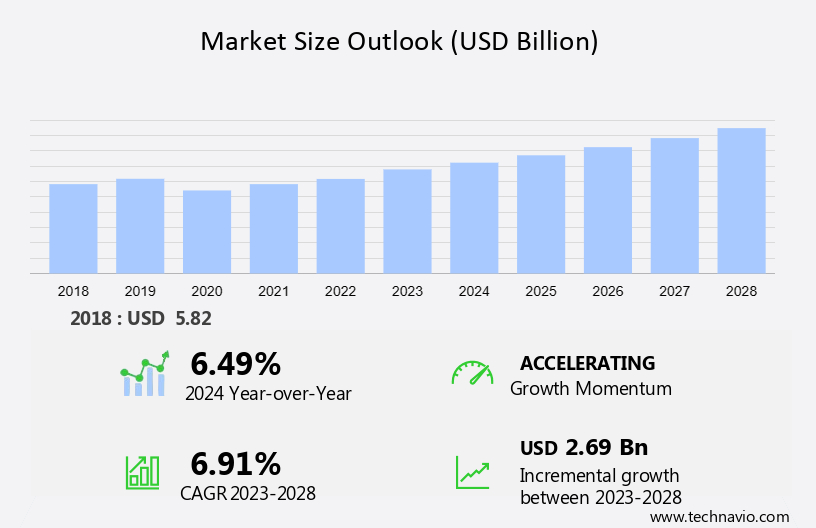
The hockey equipment market size is forecast to increase by USD 2.69 billion at a CAGR of 6.91% between 2023 and 2028.

  • The market is witnessing significant growth due to the increasing popularity of ice hockey and advancements in technology. Customizations in hockey equipment cater to the unique needs of players, enhancing their performance and comfort. Technological innovations, such as lightweight and high-performance materials, are revolutionizing the market. Innovative products, such as lightweight sticks made of composite materials and fiberglass, high-performance protective gear, and sensors for performance monitoring, are gaining traction among professional and amateur players. However, the market faces challenges with the rising cost of materials and manufacturing, which may impact the affordability of equipment for players. Despite these challenges, the market is expected to continue its growth trajectory, driven by the passion and dedication of hockey enthusiasts worldwide.

What will be the Size of the Hockey Equipment Market During the Forecast Period?

Hockey Equipment Market Size

 Request Free Sample

  • The market encompasses a diverse range of products catering to players of all positions, skill levels, and ages. Key market drivers include the growing popularity of hockey, particularly among youth leagues and initiatives, as well as the continuous innovation in gear design and technology. Customization and safety regulations are also significant trends, with an increasing demand for customized products that adhere to stringent safety standards. Manufacturing and distribution channels have evolved, with brands expanding their online presence and implementing 3D scanning technology to offer personalized fits. Sponsorship and advertising play crucial roles in market growth, with professionals endorsing equipment and tournaments providing significant exposure.
  • Furthermore, training programs and initiatives, including fan merchandise and player development, further fuel market expansion. Historically, hockey equipment has included essentials such as sticks, protective gear, and skates. However, the market now caters to specialized needs, with gear tailored to specific positions, skill levels, and safety regulations. As the industry continues to evolve, it remains focused on enhancing player performance, safety, and overall enjoyment of the game.

How is this Hockey Equipment Industry segmented and which is the largest segment?

The hockey equipment industry research report provides comprehensive data (region-wise segment analysis), with forecasts and estimates in "USD billion" for the period 2024-2028, as well as historical data from 2018-2022 for the following segments.

  • Distribution Channel
    • Offline
    • Online
  • Product
    • Sticks
    • Protective gear
    • Footwear
    • Others
  • Geography
    • North America
      • Canada
      • US
    • Europe
      • Sweden
    • APAC
    • South America
    • Middle East and Africa

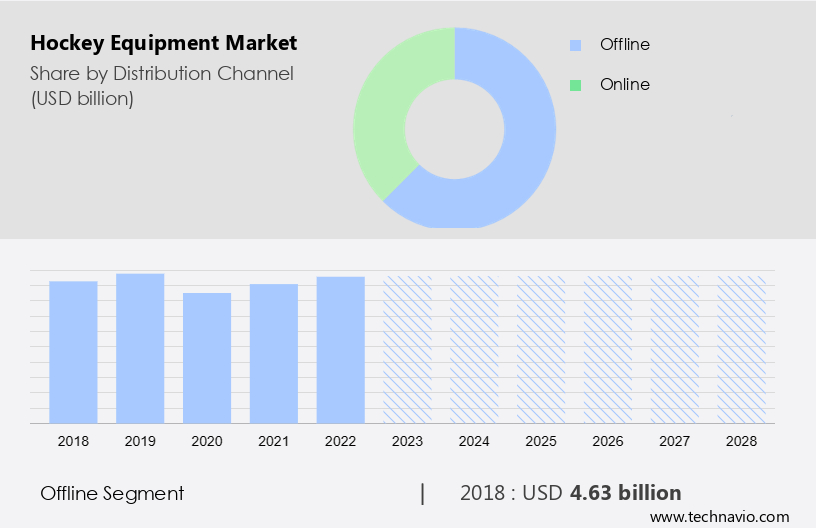
By Distribution Channel Insights

  • The offline segment is estimated to witness significant growth during the forecast period.

The offline distribution channel dominates the market, with retailers including hypermarkets, supermarkets, and specialty stores being the primary sellers. Consumers prefer this segment due to the ability to physically assess product quality and specifications. Retailers offer discounts and a wide range of products, making them a popular choice. Market participants are expanding their product reach by partnering with retailers to exhibit innovative equipment. This growth in retail adoption by global market players will enhance consumer awareness of various product types, thereby driving sales during the forecast period.

Hockey Equipment Market Size

Get a glance at the  Hockey Equipment Industry report of share of various segments Request Free Sample

The offline segment was valued at USD 4.63 billion in 2018 and showed a gradual increase during the forecast period.
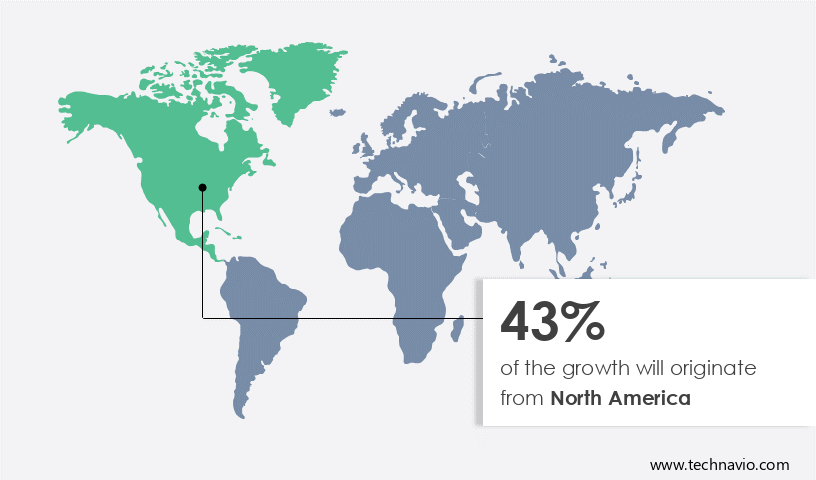
Regional Analysis

  • North America is estimated to contribute 43% to the growth of the global market during the forecast period.

Technavio's analysts have elaborately explained the regional trends and drivers that shape the market during the forecast period.

Hockey Equipment Market Share by Geography

For more insights on the market share of various regions, Request Free Sample

The North American market holds a significant share in the global hockey equipment industry, driven by Canada's strong affinity towards ice hockey as its national winter sport and the US's National Hockey League (NHL) and broadcasting networks promoting the game. The increasing popularity of sports and recreational activities is fueling the demand for hockey equipment in this region. Additionally, e-commerce stores and retail outlets cater to the growing demand for personalized hockey equipment.

Market Dynamics

Our researchers analyzed the data with 2023 as the base year, along with the key drivers, trends, and challenges. A holistic analysis of drivers will help companies refine their marketing strategies to gain a competitive advantage.

What are the key market drivers leading to the rise In the adoption of Hockey Equipment Industry?

Increasing popularity of ice hockey is the key driver of the market.

  • The global ice market is experiencing significant growth due to increasing popularity of the sport in international markets, particularly in countries with winter seasons. The Asia League Ice Hockey is a collaborative effort among Asian nations to establish a credible ice hockey league, which is expanding the distribution networks of manufacturers and reaching new customers. Furthermore, the rise of international and national sports events, increasing consumer awareness towards health and fitness, and growing participation in sports activities are fueling the interest in ice hockey. E-commerce has emerged as a key sales channel for hockey equipment due to its convenience and accessibility.
  • In addition, innovative products, such as high-performance sticks made of composite materials like fiberglass and aluminum, protective gear with neck guards and mouthguards, and lightweight skates with molded plastic boots, are driving demand. Celebrity endorsements and performance monitoring sensors are also contributing to market growth. Recreational leagues and emerging markets, including those for women and youth players, are also presenting opportunities for manufacturers to introduce personalized products and manufacturing techniques, such as Lidar scanning and boron fiber blade holders.

What are the market trends shaping the Hockey Equipment Industry?

Customizations and technological advancements in global hockey equipment market is the upcoming market trend.

  • The market is experiencing significant growth due to the increasing demand for advanced and personalized equipment among professional clubs, international players, and recreational leagues. Manufacturers are focusing on innovative products, such as lightweight composite sticks made of fiberglass and aluminum, and protective gear with shock-absorbing foams and sensors for performance monitoring. Customization is also a key trend, with players requesting personalized graphics, colors, and sizing.
  • Moreover, international federations and leagues, including those for the Winter Olympics and Stanley Cup playoffs, are implementing new rules to prioritize safety, driving the demand for neck guards, mouthguards, and other protective equipment. E-commerce stores and retail outlets are meeting this demand with a wide range of offerings, from high-performance equipment for professional players to entry-level gear for youth and amateur players. The use of emerging materials and manufacturing techniques, such as Lidar scanning and boron fiber blade holders, is also contributing to the growth of the market.

What challenges does the Hockey Equipment Industry face during its growth?

Increasing cost of material and manufacturing of hockey equipment is a key challenge affecting the industry growth.

  • The market faces a significant challenge with the escalating expenses of sourcing and manufacturing advanced materials. Protective gear, including helmets, pads, and gloves, necessitates high-performance materials such as Kevlar, carbon fiber, and plastics. These components can be costly to procure and produce, leading to increased prices for consumers. Furthermore, the growing emphasis on player safety, particularly concerning head injuries and concussions, may boost demand for superior protective equipment. This trend could potentially drive up costs and potentially limit accessibility for some consumers seeking the latest and most innovative gear. International federations, professional clubs, and leagues, including the National Hockey League (NHL), host numerous international tournaments and playoffs, such as the Stanley Cup and World Championships.
  • In addition, these events feature international players showcasing their skills on synthetic arenas and artificial rinks. To cater to this market, manufacturers employ various manufacturing techniques, including fiberglass, molded plastic, and composite materials, such as boron fiber and aluminum sticks. Additionally, emerging markets, including those catering to women, youth, and amateur players, are increasingly adopting personalized products and performance monitoring sensors. E-commerce stores and retail outlets offer a wide range of hockey equipment, including mouthguards, neck guards, and skates, to cater to the diverse needs of hockey enthusiasts. Celebrity endorsements further fuel demand for high-performance equipment. Despite these challenges, the market continues to grow, driven by innovation and the desire for enhanced player safety.

Exclusive Customer Landscape

The hockey equipment market forecasting report includes the adoption lifecycle of the market, covering from the innovator's stage to the laggard's stage. It focuses on adoption rates in different regions based on penetration. Furthermore, the hockey equipment market report also includes key purchase criteria and drivers of price sensitivity to help companies evaluate and develop their market growth analysis strategies.
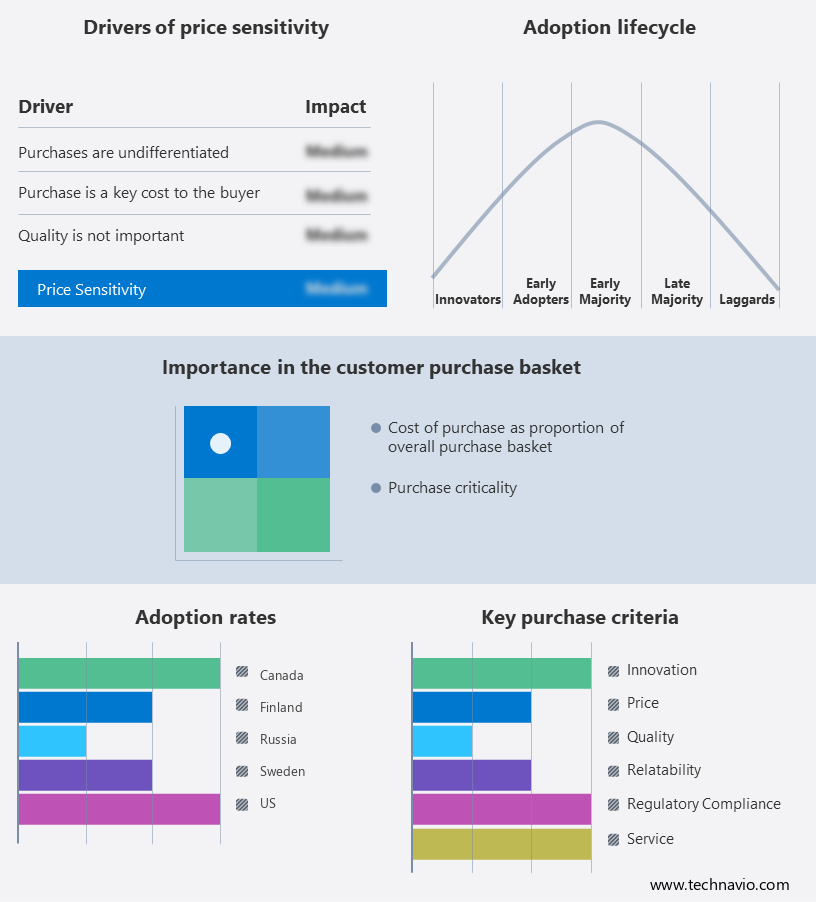
Hockey Equipment Market Share by Geography

 Customer Landscape

Key Companies & Market Insights

Companies are implementing various strategies, such as strategic alliances, hockey equipment market forecast, partnerships, mergers and acquisitions, geographical expansion, and product/service launches, to enhance their presence In the industry.

The industry research and growth report includes detailed analyses of the competitive landscape of the market and information about key companies, including:

  • Atlas Hockey
  • BAUER HOCKEY LLC
  • Canadian Tire Corp. Ltd.
  • CanAm Underwater Hockey Gear LLC
  • GRAF SKATES AG
  • Grays of Cambridge Ltd
  • GRYPHON Hockey
  • Harrow Sports
  • K1 Sportswear
  • Pentland Brands Ltd.
  • Princess Hockey
  • RK Mahajan Exports
  • Sport Maska Inc.
  • STX LLC
  • TK Sports GmbH
  • True Temper Sports
  • Vaughn Hockey
  • Warrior Sports Inc.
  • Mazon Hockey
  • Adidas AG

Qualitative and quantitative analysis of companies has been conducted to help clients understand the wider business environment as well as the strengths and weaknesses of key industry players. Data is qualitatively analyzed to categorize companies as pure play, category-focused, industry-focused, and diversified; it is quantitatively analyzed to categorize companies as dominant, leading, strong, tentative, and weak.

Research Analyst Overview

The market encompasses a wide range of products used by players to participate in this fast-paced and physically demanding sport. Key components of hockey equipment include sticks, skates, protective gear, and goalkeeper equipment. Hockey sticks have undergone significant advancements in recent years, with the primary materials being fiberglass, aluminum, and composite materials. These materials offer various benefits such as increased durability, improved performance, and reduced weight. The use of advanced manufacturing techniques, including LIDAR scanning, has enabled the production of innovative sticks with enhanced blade curvature and surface textures. Skates are another essential piece of equipment for hockey players.

In addition, traditional skates were made of leather boots and metal runners, but modern skates feature molded plastic boots and aluminum or steel runners. These advancements have led to lighter, more comfortable, and higher-performing skates. Protective gear is crucial for ensuring the safety of players during games and practices. Helmets, pads, and gloves are the most common types of protective gear used in hockey. Neck guards, mouthguards, and shin guards are also essential for youth and amateur players. The market is driven by several factors, including the growing popularity of the sport, increasing participation rates, and the continuous pursuit of high-performance equipment.

Furthermore, the market is also influenced by emerging trends, such as personalized products and the integration of technology, including sensors and performance monitoring systems. The market is not limited to professional clubs and international tournaments, such as the World Championships and the Winter Olympics. Recreational leagues and amateur players also contribute significantly to the market's growth. The market is expanding into emerging markets, where the sport's popularity is on the rise. Celebrity endorsements and offline channels, such as retail stores and manufacturing companies, have traditionally been the primary sales channels for hockey equipment. However, the rise of e-commerce stores has disrupted the market, offering convenience and a wider selection of products to consumers.

In addition, despite the advancements in hockey equipment, head injuries remain a significant concern. Rules and regulations governing the use of protective gear, such as helmets and neck guards, are essential to minimize the risk of injuries. Therefore, the market is a dynamic and evolving industry driven by the growing popularity of the sport, technological advancements, and the pursuit of high-performance equipment. The market caters to various segments, including professional clubs, recreational leagues, and amateur players, and offers a wide range of products, from sticks and skates to protective gear and goalkeeper equipment. The market is also influenced by various factors, including manufacturing techniques, emerging trends, and sales channels.

Market Scope

Report Coverage

Details

Page number

147

Base year

2023

Historic period

2018-2022

Forecast period

2024-2028

Growth momentum & CAGR

Accelerate at a CAGR of 6.91%

Market growth 2024-2028

USD 2.69 billion

Market structure

Fragmented

YoY growth 2023-2024(%)

6.49

Key countries

US, Canada, Russia, Sweden, and Finland

Competitive landscape

Leading Companies, market growth and forecasting, Market Positioning of Companies, Competitive Strategies, and Industry Risks

Request Free Sample

What are the Key Data Covered in this Hockey Equipment Market Research and Growth Report?

  • CAGR of the Hockey Equipment industry during the forecast period
  • Detailed information on factors that will drive the growth and forecasting between 2024 and 2028
  • Precise estimation of the size of the market and its contribution of the industry in focus to the parent market
  • Accurate predictions about upcoming growth and trends and changes in consumer behaviour
  • Growth of the market across North America, Europe, APAC, South America, and Middle East and Africa
  • Thorough analysis of the market's competitive landscape and detailed information about companies
  • Comprehensive analysis of factors that will challenge the hockey equipment market growth of industry companies

We can help! Our analysts can customize this hockey equipment market research report to meet your requirements.

Get in touch

1 Executive Summary

  • 1.1 Market overview
    • Exhibit 01: Executive Summary – Chart on Market Overview
    • Exhibit 02: Executive Summary – Data Table on Market Overview
    • Exhibit 03: Executive Summary – Chart on Global Market Characteristics
    • Exhibit 04: Executive Summary – Chart on Market by Geography
    • Exhibit 05: Executive Summary – Chart on Market Segmentation by Distribution Channel
    • Exhibit 06: Executive Summary – Chart on Market Segmentation by Product
    • Exhibit 07: Executive Summary – Chart on Incremental Growth
    • Exhibit 08: Executive Summary – Data Table on Incremental Growth
    • Exhibit 09: Executive Summary – Chart on Vendor Market Positioning

2 Market Landscape

  • 2.1 Market ecosystem
    • Exhibit 10: Parent market
    • Exhibit 11: Market Characteristics

3 Market Sizing

  • 3.1 Market definition
    • Exhibit 12: Offerings of vendors included in the market definition
  • 3.2 Market segment analysis
    • Exhibit 13: Market segments
  • 3.3 Market size 2023
    • 3.4 Market outlook: Forecast for 2023-2028
      • Exhibit 14: Chart on Global - Market size and forecast 2023-2028 ($ billion)
      • Exhibit 15: Data Table on Global - Market size and forecast 2023-2028 ($ billion)
      • Exhibit 16: Chart on Global Market: Year-over-year growth 2023-2028 (%)
      • Exhibit 17: Data Table on Global Market: Year-over-year growth 2023-2028 (%)

    4 Historic Market Size

    • 4.1 Global hockey equipment market 2018 - 2022
      • Exhibit 18: Historic Market Size – Data Table on global hockey equipment market 2018 - 2022 ($ billion)
    • 4.2 Distribution channel Segment Analysis 2018 - 2022
      • Exhibit 19: Historic Market Size – Distribution channel Segment 2018 - 2022 ($ billion)
    • 4.3 Product Segment Analysis 2018 - 2022
      • Exhibit 20: Historic Market Size – Product Segment 2018 - 2022 ($ billion)
    • 4.4 Geography Segment Analysis 2018 - 2022
      • Exhibit 21: Historic Market Size – Geography Segment 2018 - 2022 ($ billion)
    • 4.5 Country Segment Analysis 2018 - 2022
      • Exhibit 22: Historic Market Size – Country Segment 2018 - 2022 ($ billion)

    5 Five Forces Analysis

    • 5.1 Five forces summary
      • Exhibit 23: Five forces analysis - Comparison between 2023 and 2028
    • 5.2 Bargaining power of buyers
      • Exhibit 24: Chart on Bargaining power of buyers – Impact of key factors 2023 and 2028
    • 5.3 Bargaining power of suppliers
      • Exhibit 25: Bargaining power of suppliers – Impact of key factors in 2023 and 2028
    • 5.4 Threat of new entrants
      • Exhibit 26: Threat of new entrants – Impact of key factors in 2023 and 2028
    • 5.5 Threat of substitutes
      • Exhibit 27: Threat of substitutes – Impact of key factors in 2023 and 2028
    • 5.6 Threat of rivalry
      • Exhibit 28: Threat of rivalry – Impact of key factors in 2023 and 2028
    • 5.7 Market condition
      • Exhibit 29: Chart on Market condition - Five forces 2023 and 2028

    6 Market Segmentation by Distribution Channel

    • 6.1 Market segments
      • Exhibit 30: Chart on Distribution Channel - Market share 2023-2028 (%)
      • Exhibit 31: Data Table on Distribution Channel - Market share 2023-2028 (%)
    • 6.2 Comparison by Distribution Channel
      • Exhibit 32: Chart on Comparison by Distribution Channel
      • Exhibit 33: Data Table on Comparison by Distribution Channel
    • 6.3 Offline - Market size and forecast 2023-2028
      • Exhibit 34: Chart on Offline - Market size and forecast 2023-2028 ($ billion)
      • Exhibit 35: Data Table on Offline - Market size and forecast 2023-2028 ($ billion)
      • Exhibit 36: Chart on Offline - Year-over-year growth 2023-2028 (%)
      • Exhibit 37: Data Table on Offline - Year-over-year growth 2023-2028 (%)
    • 6.4 Online - Market size and forecast 2023-2028
      • Exhibit 38: Chart on Online - Market size and forecast 2023-2028 ($ billion)
      • Exhibit 39: Data Table on Online - Market size and forecast 2023-2028 ($ billion)
      • Exhibit 40: Chart on Online - Year-over-year growth 2023-2028 (%)
      • Exhibit 41: Data Table on Online - Year-over-year growth 2023-2028 (%)
    • 6.5 Market opportunity by Distribution Channel
      • Exhibit 42: Market opportunity by Distribution Channel ($ billion)
      • Exhibit 43: Data Table on Market opportunity by Distribution Channel ($ billion)

    7 Market Segmentation by Product

    • 7.1 Market segments
      • Exhibit 44: Chart on Product - Market share 2023-2028 (%)
      • Exhibit 45: Data Table on Product - Market share 2023-2028 (%)
    • 7.2 Comparison by Product
      • Exhibit 46: Chart on Comparison by Product
      • Exhibit 47: Data Table on Comparison by Product
    • 7.3 Sticks - Market size and forecast 2023-2028
      • Exhibit 48: Chart on Sticks - Market size and forecast 2023-2028 ($ billion)
      • Exhibit 49: Data Table on Sticks - Market size and forecast 2023-2028 ($ billion)
      • Exhibit 50: Chart on Sticks - Year-over-year growth 2023-2028 (%)
      • Exhibit 51: Data Table on Sticks - Year-over-year growth 2023-2028 (%)
    • 7.4 Protective gear - Market size and forecast 2023-2028
      • Exhibit 52: Chart on Protective gear - Market size and forecast 2023-2028 ($ billion)
      • Exhibit 53: Data Table on Protective gear - Market size and forecast 2023-2028 ($ billion)
      • Exhibit 54: Chart on Protective gear - Year-over-year growth 2023-2028 (%)
      • Exhibit 55: Data Table on Protective gear - Year-over-year growth 2023-2028 (%)
    • 7.5 Footwear - Market size and forecast 2023-2028
      • Exhibit 56: Chart on Footwear - Market size and forecast 2023-2028 ($ billion)
      • Exhibit 57: Data Table on Footwear - Market size and forecast 2023-2028 ($ billion)
      • Exhibit 58: Chart on Footwear - Year-over-year growth 2023-2028 (%)
      • Exhibit 59: Data Table on Footwear - Year-over-year growth 2023-2028 (%)
    • 7.6 Others - Market size and forecast 2023-2028
      • Exhibit 60: Chart on Others - Market size and forecast 2023-2028 ($ billion)
      • Exhibit 61: Data Table on Others - Market size and forecast 2023-2028 ($ billion)
      • Exhibit 62: Chart on Others - Year-over-year growth 2023-2028 (%)
      • Exhibit 63: Data Table on Others - Year-over-year growth 2023-2028 (%)
    • 7.7 Market opportunity by Product
      • Exhibit 64: Market opportunity by Product ($ billion)
      • Exhibit 65: Data Table on Market opportunity by Product ($ billion)

    8 Customer Landscape

    • 8.1 Customer landscape overview
      • Exhibit 66: Analysis of price sensitivity, lifecycle, customer purchase basket, adoption rates, and purchase criteria

    9 Geographic Landscape

    • 9.1 Geographic segmentation
      • Exhibit 67: Chart on Market share by geography 2023-2028 (%)
      • Exhibit 68: Data Table on Market share by geography 2023-2028 (%)
    • 9.2 Geographic comparison
      • Exhibit 69: Chart on Geographic comparison
      • Exhibit 70: Data Table on Geographic comparison
    • 9.3 North America - Market size and forecast 2023-2028
      • Exhibit 71: Chart on North America - Market size and forecast 2023-2028 ($ billion)
      • Exhibit 72: Data Table on North America - Market size and forecast 2023-2028 ($ billion)
      • Exhibit 73: Chart on North America - Year-over-year growth 2023-2028 (%)
      • Exhibit 74: Data Table on North America - Year-over-year growth 2023-2028 (%)
    • 9.4 Europe - Market size and forecast 2023-2028
      • Exhibit 75: Chart on Europe - Market size and forecast 2023-2028 ($ billion)
      • Exhibit 76: Data Table on Europe - Market size and forecast 2023-2028 ($ billion)
      • Exhibit 77: Chart on Europe - Year-over-year growth 2023-2028 (%)
      • Exhibit 78: Data Table on Europe - Year-over-year growth 2023-2028 (%)
    • 9.5 APAC - Market size and forecast 2023-2028
      • Exhibit 79: Chart on APAC - Market size and forecast 2023-2028 ($ billion)
      • Exhibit 80: Data Table on APAC - Market size and forecast 2023-2028 ($ billion)
      • Exhibit 81: Chart on APAC - Year-over-year growth 2023-2028 (%)
      • Exhibit 82: Data Table on APAC - Year-over-year growth 2023-2028 (%)
    • 9.6 South America - Market size and forecast 2023-2028
      • Exhibit 83: Chart on South America - Market size and forecast 2023-2028 ($ billion)
      • Exhibit 84: Data Table on South America - Market size and forecast 2023-2028 ($ billion)
      • Exhibit 85: Chart on South America - Year-over-year growth 2023-2028 (%)
      • Exhibit 86: Data Table on South America - Year-over-year growth 2023-2028 (%)
    • 9.7 Middle East and Africa - Market size and forecast 2023-2028
      • Exhibit 87: Chart on Middle East and Africa - Market size and forecast 2023-2028 ($ billion)
      • Exhibit 88: Data Table on Middle East and Africa - Market size and forecast 2023-2028 ($ billion)
      • Exhibit 89: Chart on Middle East and Africa - Year-over-year growth 2023-2028 (%)
      • Exhibit 90: Data Table on Middle East and Africa - Year-over-year growth 2023-2028 (%)
    • 9.8 US - Market size and forecast 2023-2028
      • Exhibit 91: Chart on US - Market size and forecast 2023-2028 ($ billion)
      • Exhibit 92: Data Table on US - Market size and forecast 2023-2028 ($ billion)
      • Exhibit 93: Chart on US - Year-over-year growth 2023-2028 (%)
      • Exhibit 94: Data Table on US - Year-over-year growth 2023-2028 (%)
    • 9.9 Canada - Market size and forecast 2023-2028
      • Exhibit 95: Chart on Canada - Market size and forecast 2023-2028 ($ billion)
      • Exhibit 96: Data Table on Canada - Market size and forecast 2023-2028 ($ billion)
      • Exhibit 97: Chart on Canada - Year-over-year growth 2023-2028 (%)
      • Exhibit 98: Data Table on Canada - Year-over-year growth 2023-2028 (%)
    • 9.10 Russia - Market size and forecast 2023-2028
      • Exhibit 99: Chart on Russia - Market size and forecast 2023-2028 ($ billion)
      • Exhibit 100: Data Table on Russia - Market size and forecast 2023-2028 ($ billion)
      • Exhibit 101: Chart on Russia - Year-over-year growth 2023-2028 (%)
      • Exhibit 102: Data Table on Russia - Year-over-year growth 2023-2028 (%)
    • 9.11 Sweden - Market size and forecast 2023-2028
      • Exhibit 103: Chart on Sweden - Market size and forecast 2023-2028 ($ billion)
      • Exhibit 104: Data Table on Sweden - Market size and forecast 2023-2028 ($ billion)
      • Exhibit 105: Chart on Sweden - Year-over-year growth 2023-2028 (%)
      • Exhibit 106: Data Table on Sweden - Year-over-year growth 2023-2028 (%)
    • 9.12 Finland - Market size and forecast 2023-2028
      • Exhibit 107: Chart on Finland - Market size and forecast 2023-2028 ($ billion)
      • Exhibit 108: Data Table on Finland - Market size and forecast 2023-2028 ($ billion)
      • Exhibit 109: Chart on Finland - Year-over-year growth 2023-2028 (%)
      • Exhibit 110: Data Table on Finland - Year-over-year growth 2023-2028 (%)
    • 9.13 Market opportunity by geography
      • Exhibit 111: Market opportunity by geography ($ billion)
      • Exhibit 112: Data Tables on Market opportunity by geography ($ billion)

    10 Drivers, Challenges, and Trends

    • 10.1 Market drivers
      • 10.2 Market challenges
        • 10.3 Impact of drivers and challenges
          • Exhibit 113: Impact of drivers and challenges in 2023 and 2028
        • 10.4 Market trends

          11 Vendor Landscape

          • 11.1 Overview
            • 11.2 Vendor landscape
              • Exhibit 114: Overview on Criticality of inputs and Factors of differentiation
            • 11.3 Landscape disruption
              • Exhibit 115: Overview on factors of disruption
            • 11.4 Industry risks
              • Exhibit 116: Impact of key risks on business

            12 Vendor Analysis

            • 12.1 Vendors covered
              • Exhibit 117: Vendors covered
            • 12.2 Market positioning of vendors
              • Exhibit 118: Matrix on vendor position and classification
            • 12.3 Adidas AG
              • Exhibit 119: Adidas AG - Overview
              • Exhibit 120: Adidas AG - Business segments
              • Exhibit 121: Adidas AG - Key news
              • Exhibit 122: Adidas AG - Key offerings
              • Exhibit 123: Adidas AG - Segment focus
            • 12.4 Atlas Hockey
              • Exhibit 124: Atlas Hockey - Overview
              • Exhibit 125: Atlas Hockey - Product / Service
              • Exhibit 126: Atlas Hockey - Key offerings
            • 12.5 BAUER HOCKEY LLC
              • Exhibit 127: BAUER HOCKEY LLC - Overview
              • Exhibit 128: BAUER HOCKEY LLC - Product / Service
              • Exhibit 129: BAUER HOCKEY LLC - Key offerings
            • 12.6 Canadian Tire Corp. Ltd.
              • Exhibit 130: Canadian Tire Corp. Ltd. - Overview
              • Exhibit 131: Canadian Tire Corp. Ltd. - Product / Service
              • Exhibit 132: Canadian Tire Corp. Ltd. - Key offerings
            • 12.7 CanAm Underwater Hockey Gear LLC
              • Exhibit 133: CanAm Underwater Hockey Gear LLC - Overview
              • Exhibit 134: CanAm Underwater Hockey Gear LLC - Product / Service
              • Exhibit 135: CanAm Underwater Hockey Gear LLC - Key offerings
            • 12.8 GRAF SKATES AG
              • Exhibit 136: GRAF SKATES AG - Overview
              • Exhibit 137: GRAF SKATES AG - Product / Service
              • Exhibit 138: GRAF SKATES AG - Key offerings
            • 12.9 Grays of Cambridge Ltd
              • Exhibit 139: Grays of Cambridge Ltd - Overview
              • Exhibit 140: Grays of Cambridge Ltd - Product / Service
              • Exhibit 141: Grays of Cambridge Ltd - Key offerings
            • 12.10 GRYPHON Hockey
              • Exhibit 142: GRYPHON Hockey - Overview
              • Exhibit 143: GRYPHON Hockey - Product / Service
              • Exhibit 144: GRYPHON Hockey - Key offerings
            • 12.11 Harrow Sports
              • Exhibit 145: Harrow Sports - Overview
              • Exhibit 146: Harrow Sports - Product / Service
              • Exhibit 147: Harrow Sports - Key offerings
            • 12.12 K1 Sportswear
              • Exhibit 148: K1 Sportswear - Overview
              • Exhibit 149: K1 Sportswear - Product / Service
              • Exhibit 150: K1 Sportswear - Key offerings
            • 12.13 RK Mahajan Exports
              • Exhibit 151: RK Mahajan Exports - Overview
              • Exhibit 152: RK Mahajan Exports - Key offerings
            • 12.14 STX LLC
              • Exhibit 153: STX LLC - Overview
              • Exhibit 154: STX LLC - Key offerings
            • 12.15 TK Sports GmbH
              • Exhibit 155: TK Sports GmbH - Overview
              • Exhibit 156: TK Sports GmbH - Product / Service
              • Exhibit 157: TK Sports GmbH - Key offerings
            • 12.16 True Temper Sports
              • Exhibit 158: True Temper Sports - Overview
              • Exhibit 159: True Temper Sports - Product / Service
              • Exhibit 160: True Temper Sports - Key offerings
            • 12.17 Warrior Sports Inc.
              • Exhibit 161: Warrior Sports Inc. - Overview
              • Exhibit 162: Warrior Sports Inc. - Product / Service
              • Exhibit 163: Warrior Sports Inc. - Key offerings

            13 Appendix

            • 13.1 Scope of the report
              • 13.2 Inclusions and exclusions checklist
                • Exhibit 164: Inclusions checklist
                • Exhibit 165: Exclusions checklist
              • 13.3 Currency conversion rates for US$
                • Exhibit 166: Currency conversion rates for US$
              • 13.4 Research methodology
                • Exhibit 167: Research methodology
                • Exhibit 168: Validation techniques employed for market sizing
                • Exhibit 169: Information sources
              • 13.5 List of abbreviations
                • Exhibit 170: List of abbreviations

              Research Methodology

              Technavio presents a detailed picture of the market by way of study, synthesis, and summation of data from multiple sources. The analysts have presented the various facets of the market with a particular focus on identifying the key industry influencers. The data thus presented is comprehensive, reliable, and the result of extensive research, both primary and secondary.

              INFORMATION SOURCES

              Primary sources

              • Manufacturers and suppliers
              • Channel partners
              • Industry experts
              • Strategic decision makers

              Secondary sources

              • Industry journals and periodicals
              • Government data
              • Financial reports of key industry players
              • Historical data
              • Press releases

              DATA ANALYSIS

              Data Synthesis

              • Collation of data
              • Estimation of key figures
              • Analysis of derived insights

              Data Validation

              • Triangulation with data models
              • Reference against proprietary databases
              • Corroboration with industry experts

              REPORT WRITING

              Qualitative

              • Market drivers
              • Market challenges
              • Market trends
              • Five forces analysis

              Quantitative

              • Market size and forecast
              • Market segmentation
              • Geographical insights
              • Competitive landscape

              Interested in this report?

              Get your sample now to see our research methodology and insights!

              Download Now

              Frequently Asked Questions

              Hockey Equipment market growth will increase by $ 2.69 bn during 2024-2028.

              The Hockey Equipment market is expected to grow at a CAGR of 6.91% during 2024-2028.

              Hockey Equipment market is segmented by Distribution Channel( Offline, Online) Product( Sticks, Protective gear, Footwear, Others)

              Atlas Hockey, BAUER HOCKEY LLC, Canadian Tire Corp. Ltd., CanAm Underwater Hockey Gear LLC, GRAF SKATES AG, Grays of Cambridge Ltd, GRYPHON Hockey, Harrow Sports, K1 Sportswear, Pentland Brands Ltd., Princess Hockey, RK Mahajan Exports, Sport Maska Inc., STX LLC, TK Sports GmbH, True Temper Sports, Vaughn Hockey, Warrior Sports Inc., Mazon Hockey, Adidas AG are a few of the key vendors in the Hockey Equipment market.

              North America will register the highest growth rate of 43% among the other regions. Therefore, the Hockey Equipment market in North America is expected to garner significant business opportunities for the vendors during the forecast period.

              US, Canada, Russia, Sweden, Finland

              • Increasing popularity of ice hockeyIce hockey is becoming more popular in countries outside North America is the driving factor this market.
              • driving demand for equipment in new markets such as Asia. Asian countries with winter seasons are slowly developing a credible ice hockey program by collaborating to form a league known as the Asia League Ice Hockey. Manufacturers are expanding their distribution networks to reach customers in these countries. Rising international and national sports events is the driving factor this market.
              • growth in consumer awareness regarding health and fitness is the driving factor this market.
              • and rise in participation in sports activities have increased interest in winter sports is the driving factor this market.
              • including ice hockey is the driving factor this market.
              • henceforth supplementing the growth of the ice hockey equipment market globally. With the rise of online shopping is the driving factor this market.
              • e-commerce has become an increasingly important channel for hockey equipment sales. Many manufacturers is the driving factor this market.
              • such as BAUER is the driving factor this market.
              • have developed online platforms to sell their products directly to consumers. Thus is the driving factor this market.
              • the growing popularity of ice hockey will bolster the growth of the global hockey equipment market during the forecast period. is the driving factor this market.

              The Hockey Equipment market vendors should focus on grabbing business opportunities from the Offline segment as it accounted for the largest market share in the base year.
              RIA - Research AI Assistant
              Ask RIA