
Home Furniture Market Size 2024-2028
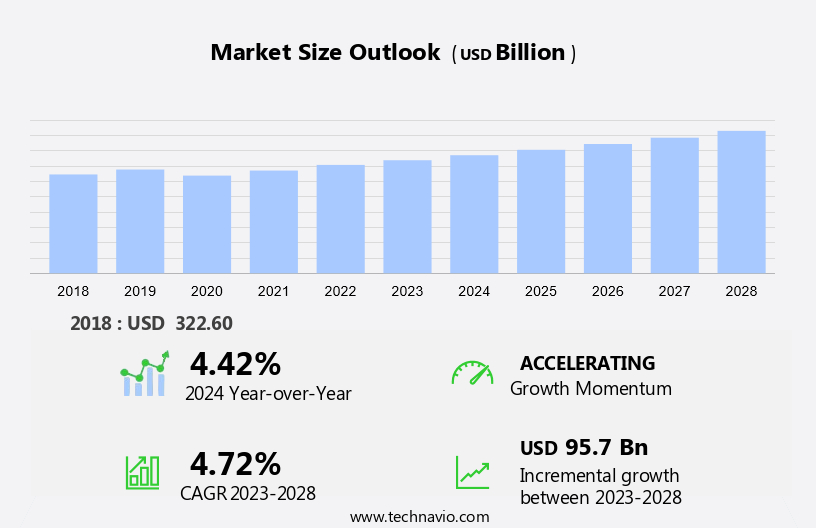
The home furniture market size is forecast to increase by USD 95.7 billion at a CAGR of 4.72% between 2023 and 2028.
- The rising volume of online sales is a key factor driving the growth of the furniture market, as more consumers opt for the convenience of shopping from home. A notable trend in the industry is the increasing demand for innovative, customized furniture, as customers seek unique and personalized pieces to fit their specific needs and preferences. This shift towards bespoke designs is pushing manufacturers to adopt new technologies and offer tailored solutions. There is an increasing demand for beds with pull-out shelves, universal serial bus (USB) ports, and outlets to charge iPods, laptops, and smartphones. However, the market faces challenges, particularly due to fluctuating labor costs and the volatility of raw material prices. These unpredictable costs create difficulties for manufacturers in managing their production expenses, affecting pricing strategies and profitability. To stay competitive, companies must find ways to mitigate these challenges while continuing to innovate and meet the growing demand for customized furniture. Balancing cost management with product differentiation remains a critical focus for industry players.
What will be the Size of the Home Furniture Market During the Forecast Period?
Request Free Sampleai_research_analysis.multili
How is this Home Furniture Industry segmented and which is the largest segment?
The industry research report provides comprehensive data (region-wise segment analysis), with forecasts and estimates in "USD billion" for the period 2024-2028, as well as historical data from 2018-2022 for the following segments.
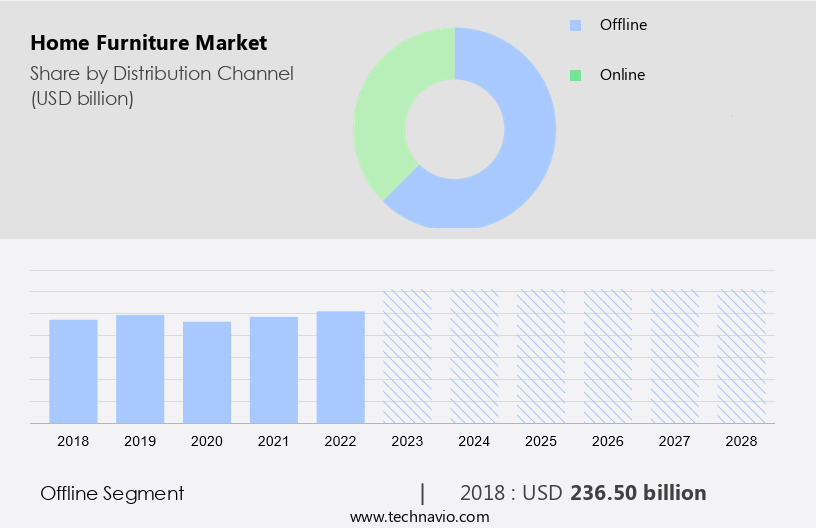
- Distribution Channel
- Offline
- Online
- Product
- Living room furniture
- Bedroom furniture
- Storage furniture
- Others
- Geography
- APAC
- China
- Japan
- North America
- Canada
- US
- Europe
- Germany
- Middle East and Africa
- South America
- APAC
By Distribution Channel Insights
- The offline segment is estimated to witness significant growth during the forecast period.
Offline stores enable consumers to physically experience the product before purchasing it. Therefore, offline stores are prominent in developed and developing countries across the world. The growth in offline distribution is augmented by a significant increase in the number of vendors expanding and operating their offline stores across both developed and developing regions. Such expansion has led to the growth of the global market through the offline distribution channel. Furthermore, the advent of online retailing positively impacted product sales in the regional market. Quick delivery options and secure transactions contribute to the popularity of online distribution channels in India. The global market is flooded with a rising number of online startups and various other already-established companies venturing into the digital space to reach out to a larger customer base. The millennial crowd is the largest set of the population using smartphones. This is driving the sales online.
Get a glance at the market report of share of various segments Request Free Sample
The Offline segment was valued at USD 236.50 billion in 2018 and showed a gradual increase during the forecast period.
Regional Analysis
- APAC is estimated to contribute 44% to the growth of the global market during the forecast period.
Technavio's analysts have elaborately explained the regional trends and drivers that shape the market during the forecast period.

For more insights on the market size of various regions, Request Free Sample
The rapidly growing real estate sector in APAC has led to an increase in the adoption of these by both domestic users, which in turn, has boosted the growth of the regional market. In India, consumers are opting for branded home furnishing products due to growing disposable incomes. Thus, various key companies are expanding their retention in the region. Thus, the increasing penetration of retail channels in the region will drive the growth of the regional market in focus during the forecast period.
Market Dynamics
Our researchers analyzed the data with 2023 as the base year, along with the key drivers, trends, and challenges. A holistic analysis of drivers will help companies refine their marketing strategies to gain a competitive advantage.
What are the key market drivers leading to the rise in the adoption of Home Furniture Industry?
Increasing online sales is the key driver of the market.
- The rising popularity of online channels is the primary driver behind the growth of the global market. Owing to increasing internet penetration globally, the influence of e-commerce-based shopping and online retailing has grown.
- Many major players have either launched their new specialist online stores or are planning to launch their new e-commerce-based outlets. The entry of horizontal players has been positively impacting the market in focus during the forecast period.
What are the market trends shaping the Home Furniture Industry?
Growing importance of innovative customized furniture is the upcoming market trend.
- There has been a substantial increase in the customization of this as people have become increasingly aware of technologically driven smart furniture. Major brands are actively engaging mainstream manufacturers in innovative and fabric customization, attracting various consumers to design their patterns right from the fabric to the type of wood being used in the manufacturing. Thus, growing innovation by companies operating in the market will drive the growth of the market in focus during the forecast period.
What challenges does the Home Furniture Industry face during its growth?
Fluctuating labor costs and raw material prices is a key challenge affecting the industry growth.
- Manufacturing and furnishing products include procurement and use of several raw materials such as steel, iron, plastic, wood, glass, petroleum products, and paints. Hence, fluctuations in raw material cost directly impact the price of products or the profit margins of manufacturers.
- This further imposes a major price challenge for the companies of these products. The major raw materials are witnessing increasing price volatility. This volatility has consequently led to either an increase in the price of final products or reduced profit margins.
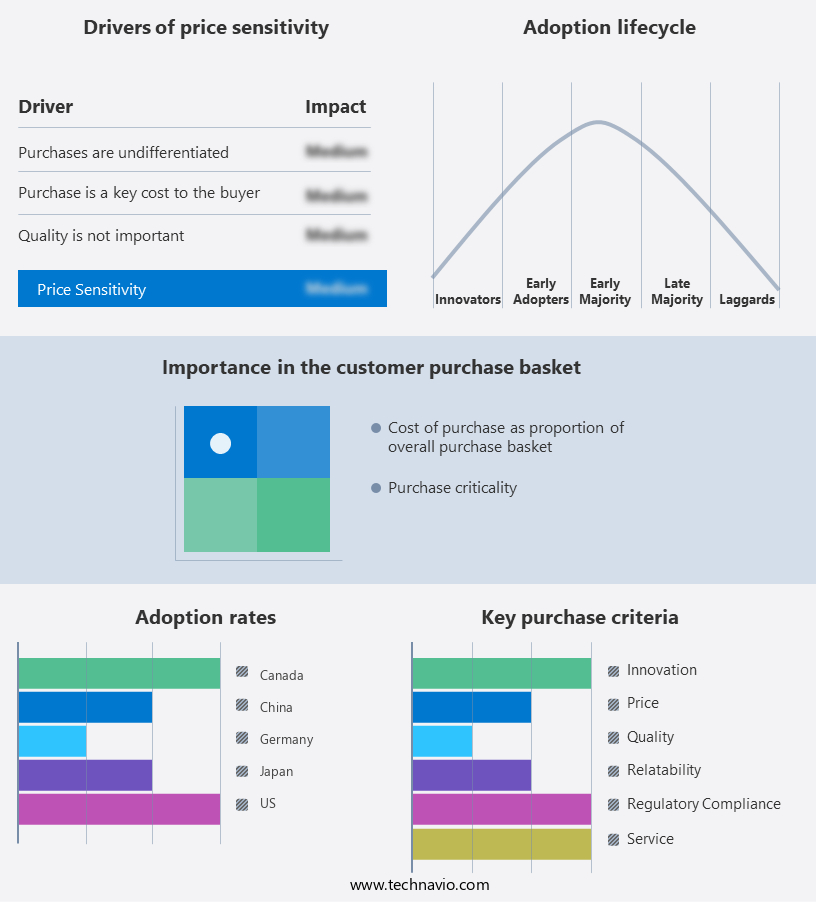
Exclusive Customer Landscape
The market forecasting report includes the adoption lifecycle of the market, covering from the innovator's stage to the laggard's stage. It focuses on adoption rates in different regions based on penetration. Furthermore, the market report also includes key purchase criteria and drivers of price sensitivity to help companies evaluate and develop their market growth analysis strategies.
Customer Landscape
Key Companies & Market Insights
Companies are implementing various strategies, such as strategic alliances, market forecast, partnerships, mergers and acquisitions, geographical expansion, and product/service launches, to enhance their presence in the industry.
The industry research and growth report includes detailed analyses of the competitive landscape of the market and information about key companies, including:
- Ashley Global Retail LLC
- Bernhardt Furniture Co.
- Dare Studio Ltd.
- Ethan Allen Interiors Inc.
- Flexsteel Industries Inc.
- Global Furniture USA Inc.
- Godrej Interio
- Inter IKEA Holding B.V.
- Kimball International Inc.
- LaZBoy Inc.
- MasterBrand Cabinets Inc.
- MillerKnoll Inc.
- Nitori Holdings Co. Ltd.
- ROCHE BOBOIS SA
- Roomstogo.com Inc.
- Stanley Lifestyles Ltd.
- Steelcase Inc.
- Steinhoff International Holdings NV
- Wayfair Inc.
- Williams Sonoma Inc.
Qualitative and quantitative analysis of companies has been conducted to help clients understand the wider business environment as well as the strengths and weaknesses of key industry players. Data is qualitatively analyzed to categorize companies as pure play, category-focused, industry-focused, and diversified; it is quantitatively analyzed to categorize companies as dominant, leading, strong, tentative, and weak.
Research Analyst Overview
The market is experiencing significant growth with the rising demand for kitchen islands, buffets, cabinets, and decor items, as interior design trends focus on premium quality home furnishings, including curtains, carpets, and ergonomically designed chairs. Home furnishing retailers cater to single and two-person households by offering portable and multi-purpose furniture, such as formaldehyde-free sofa sets made from recycled textiles, bamboo, and rattan. Additionally, the market is embracing smart sensing technology and eco-friendly materials like high-resilience foam and viscoelastic foams in wooden and metal beds and mattresses. With the rise of second-hand furniture items and unorganized industry players, home centers and flagship stores are becoming key anchoring points in the wooden furniture market. Cubicles, gaming tables, and customizable pieces are also gaining popularity, contributing to the evolving landscape of home furnishings.
The growing demand for eco-friendly furniture and ready-to-assemble options is reshaping the kitchen and dining furniture market, with consumers increasingly turning to e-commerce for convenience. Popular items like couches, coffee tables, entertainment centers, dining tables, chairs, bar stools, and kitchen islands are becoming essential pieces in modern homes, offering both style and functionality. The dining room and kitchen furniture markets are seeing increased demand, alongside lamps and lighting furniture, as consumers look for functional and stylish home decor. Plastic and other materials are also gaining popularity in furniture design. Specialty stores and online retail stores are becoming key channels for customers to explore and purchase these diverse home furnishings.
|
Market Scope |
|
|
Report Coverage |
Details |
|
Page number |
159 |
|
Base year |
2023 |
|
Historic period |
2018-2022 |
|
Forecast period |
2024-2028 |
|
Growth momentum & CAGR |
Accelerate at a CAGR of 4.72% |
|
Market growth 2024-2028 |
USD 95.7 billion |
|
Market structure |
Fragmented |
|
YoY growth 2023-2024(%) |
4.42 |
|
Key countries |
US, China, Japan, Germany, and Canada |
|
Competitive landscape |
Leading Companies, Market Positioning of Companies, Competitive Strategies, and Industry Risks |
What are the Key Data Covered in this Home Furniture Market Research and Growth Report?
- CAGR of the Home Furniture industry during the forecast period
- Detailed information on factors that will drive the market growth and forecasting between 2024 and 2028
- Precise estimation of the size of the market and its contribution of the industry in focus to the parent market
- Accurate predictions about upcoming growth and trends and changes in consumer behaviour
- Growth of the market across APAC, North America, Europe, Middle East and Africa, and South America
- Thorough analysis of the market's competitive landscape and detailed information about companies
- Comprehensive analysis of factors that will challenge the home furniture market growth of industry companies
We can help! Our analysts can customize this home furniture market research report to meet your requirements.
 RIA -
RIA - 
