
Homeopathy Product Market Size 2025-2029
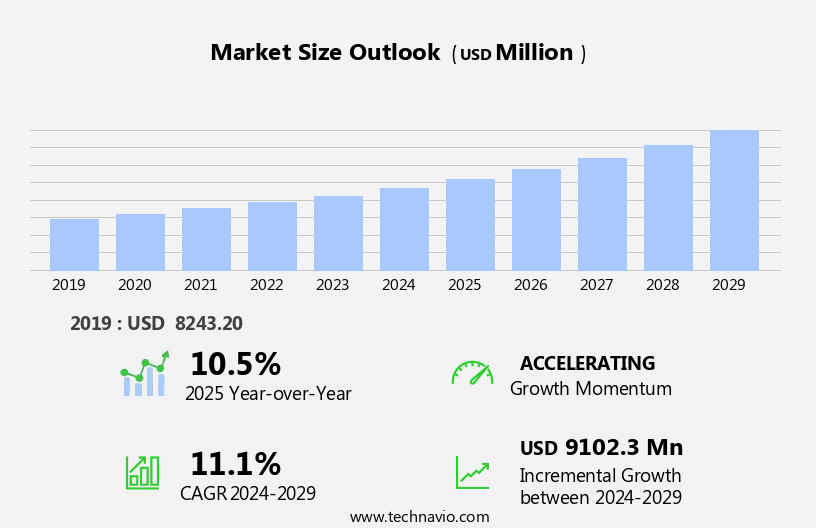
The homeopathy product market size is forecast to increase by USD 9.1 billion at a CAGR of 11.1% between 2024 and 2029.
- The market is witnessing significant growth, driven by the increasing prevalence of chronic diseases and the rising acceptance of homeopathy as a holistic treatment approach. The market is further moving by the increasing use of telemedicine and digital platforms for consultations on homeopathy treatment, enabling greater accessibility and convenience for consumers. The need for scientific validation and standardization is crucial to gain acceptance from mainstream healthcare providers and consumers. However, the market faces challenges related to concerns over the efficacy and safety regulations of homeopathy products. These concerns necessitate rigorous research and adherence to quality standards to ensure consumer trust and confidence.
- Companies seeking to capitalize on market opportunities should focus on developing evidence-based homeopathy products and leveraging digital platforms to expand their reach. Additionally, collaborating with healthcare providers and regulatory bodies can help navigate the challenges and build a strong market presence. Homeopathy offers a cost-effective solution, with tinctures and dynamized remedies providing relief for gastrointestinal issues, skin conditions, and immunological disorders.
What will be the Size of the Homeopathy Product Market during the forecast period?
Explore in-depth regional segment analysis with market size data - historical 2019-2023 and forecasts 2025-2029 - in the full report.
Request Free Sample
- Homeopathic complementary therapies continue to gain traction in the healthcare sector, with growing consumer demand for alternative treatment options. However, safety concerns surrounding homeopathic remedies persist, necessitating rigorous clinical studies to ensure their efficacy and safety. Future trends in homeopathy include integrative approaches, focusing on patient outcomes and cost-effectiveness. The homeopathic industry is witnessing a rise in systemic reviews, meta-analyses, and legal issues related to regulation and dispensing. Homeopathic practitioner education and consultation are crucial components of effective treatment plans, which often involve case taking and individualized remedy preparation. Homeopathic philosophy, materia medica, and provings form the foundation of homeopathic practice, but ethical considerations and misinformation require ongoing attention.
- Homeopathic regulation and legislation aim to ensure accessibility and patient satisfaction, while homeopathic follow-up and treatment plans contribute to long-term patient well-being. Homeopathic remedy preparation and homeopathic regulation are interconnected, with ongoing industry trends shaping the future of this holistic approach to healthcare. Probiotics, beneficial bacteria, are used to maintain a healthy gut microbiome, which plays a crucial role in overall health and wellbeing.
How is this Homeopathy Product Industry segmented?
The homeopathy product industry research report provides comprehensive data (region-wise segment analysis), with forecasts and estimates in "USD million" for the period 2025-2029, as well as historical data from 2019-2023 for the following segments.
- Source
- Plants
- Minerals
- Animals
- Route Of Administration
- Oral
- Topical
- End-user
- Homeopathic clinics
- Retail pharmacies
- E-commerce platforms
- Hospitals and specialty clinics
- Geography
- North America
- US
- Canada
- Mexico
- Europe
- France
- Germany
- UK
- APAC
- China
- India
- Japan
- South Korea
- Rest of World (ROW)
- North America
By Source Insights
The plants segment is estimated to witness significant growth during the forecast period. The market is characterized by its reliance on natural plant-based ingredients sourced globally, with Europe and India being significant contributors. In Europe, countries like Germany and France uphold deep-rooted herbal traditions, with companies such as BOIRON Co. Sourcing plants like Arnica montana and Calendula officinalis for their homeopathic remedies. India, with its rich biodiversity and traditional homeopathy practices, provides botanicals such as Rhus toxicodendron and Bryonia alba to companies like SBL Pvt. Ltd (SBL) and Dr. Reckeweg for their homeopathic preparations. Homeopathy adheres to the principles of similia similibus curentur, or "like cures like," and employs a holistic approach to address various health conditions, including acute and chronic ones.
The market encompasses homeopathic remedies for respiratory health, skin conditions, stress management, pain management, sleep disorders, and digestive health, among others. Patient education plays a crucial role, with licensed homeopaths and naturopathic doctors providing online consultations to disseminate knowledge about homeopathy's benefits. Homeopathic practitioners adhere to safety standards and regulatory compliance, ensuring the quality of homeopathic remedies through GMP standards and materia medica. The market integrates complementary medicine, functional medicine, and integrative medicine, with a focus on disease prevention and immune system support. Homeopathic dilution and potency levels are essential aspects of homeopathy principles, which are backed by clinical trials and scientific validation.
Herbal extracts and natural ingredients are integral to homeopathy, with traditional Chinese medicine and alternative medicine influencing its practices. The market also encompasses various alternative therapies, such as massage therapy, aromatherapy, and acupuncture. Energy medicine and the mind-body connection are also essential components, emphasizing the importance of the vital force in overall well-being. The homeopathy market is continually evolving, with a growing emphasis on patient-centered care, symptom relief, and adverse effect management. The market caters to a diverse range of health concerns, offering a natural and holistic approach to wellness.
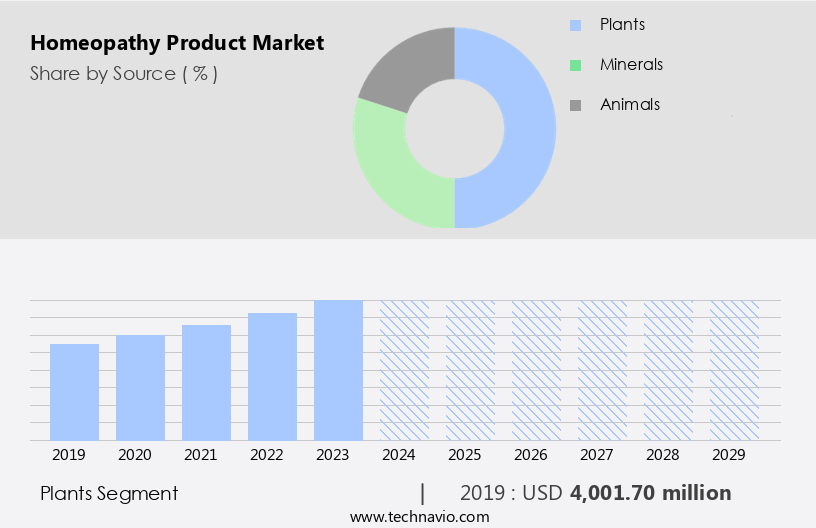
The plants segment was valued at USD 4 billion in 2019 and showed a gradual increase during the forecast period.
The Homeopathy Product Market is evolving with growing interest in homeopathic materia medica and homeopathic provings, ensuring accuracy in formulations. Improved homeopathic dispensing and homeopathic consultation enhance patient care, supported by detailed homeopathic case taking and personalized homeopathic treatment plans. Evaluating homeopathic patient outcomes highlight homeopathic cost-effectiveness and homeopathic accessibility. Phytotherapy, botanical medicine, and herbalism are integral components of naturopathic practice, offering effective and safe treatment options for a wide range of health concerns.
However, concerns about homeopathic safety concerns and homeopathic misinformation drive discussions on homeopathic legislation. Insights into homeopathic industry trends highlight shifts in homeopathic market share influenced by homeopathic consumer demand. Homeopathic clinical studies, including homeopathic meta-analysis and homeopathic systematic reviews, contribute to homeopathic evidence-based medicine. Exploring homeopathic integrative approaches enhances homeopathic patient satisfaction, while homeopathic ethical considerations and homeopathic legal issues shape homeopathic future trends.
Regional Analysis
North America is estimated to contribute 36% to the growth of the global market during the forecast period. Technavio's analysts have elaborately explained the regional trends and drivers that shape the market during the forecast period.
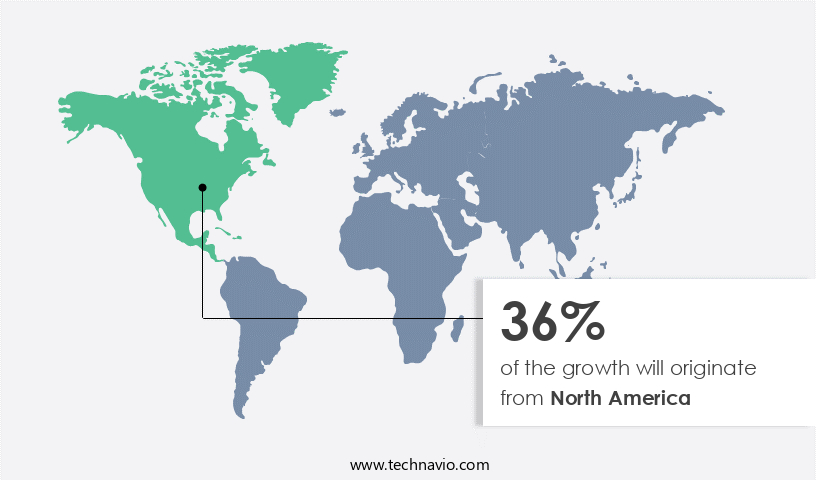
The North American market for homeopathy products is experiencing significant growth due to the increasing preference for alternative healthcare solutions. In the United States and Canada, consumers are seeking homeopathic remedies to address various health concerns, from acute conditions to chronic diseases and stress management. Key players in this region, such as BOIRON Co. and Homeocan Inc., are meeting this demand by providing a diverse range of homeopathic offerings, including tablets, tinctures, creams, and ointments. These companies adhere to regulatory compliance and safety standards, ensuring the quality and efficacy of their products. Homeopathy's holistic approach, based on the principles of similia similibus curentur, resonates with consumers seeking symptom relief and disease prevention.
Patient education plays a crucial role in the market, with licensed homeopaths, naturopathic doctors, and online consultations offering guidance on homeopathic remedies and their application. The homeopathic pharmacopeia, materia medica, and clinical trials provide scientific validation for these treatments, further bolstering consumer confidence. Herbal extracts and natural ingredients are integral to homeopathic remedies, as they align with the market trend towards natural health products. Homeopathy research continues to explore the potential of these treatments for respiratory health, digestive health, sleep disorders, and immune system support. The homeopathic dilution process, while a subject of debate, is an essential aspect of homeopathy's unique therapeutic approach.
This market caters to consumers seeking to prevent disease, manage chronic conditions, and promote overall health and wellness through alternative therapies, natural remedies, and lifestyle changes. Traditional Chinese medicine and homeopathy education further enrich the homeopathy market, offering a wealth of knowledge and expertise. The North American market for homeopathy products is a vibrant and evolving landscape, driven by consumer demand for alternative healthcare solutions and a growing body of scientific validation. Companies, practitioners, and researchers continue to innovate and expand the reach of homeopathy, ensuring its role as a valuable complement to conventional healthcare practices.
Market Dynamics
Our researchers analyzed the data with 2024 as the base year, along with the key drivers, trends, and challenges. A holistic analysis of drivers will help companies refine their marketing strategies to gain a competitive advantage.
What are the Homeopathy Product market drivers leading to the rise in the adoption of Industry?
- The prevalence of chronic diseases is the primary driving force behind market growth. Homeopathy, an holistic approach to healthcare, offers potential solutions for managing various chronic conditions, particularly skin conditions and respiratory health issues. The market is driven by the increasing prevalence of chronic diseases worldwide, with millions of people in the US alone suffering from conditions like diabetes, asthma, high blood pressure, heart disease, and arthritis. The principle of homeopathy, "similia similibus curentur," or "let likes be cured by likes," suggests that herbal extracts can stimulate the body's natural healing process when given in small doses. Certified homeopathic products, listed in the Homeopathic Pharmacopeia, undergo rigorous scientific validation to ensure their purity, potency, and safety.
- Patient education plays a crucial role in the effective use of homeopathic remedies, as proper application and dosage are essential for optimal results. The holistic nature of homeopathy addresses the root cause of symptoms, making it a promising alternative for managing chronic conditions. However, it is essential to acknowledge the placebo effect, which can influence the perceived benefits of homeopathic treatments. Despite this, the growing body of research supports the use of homeopathy for various conditions, as evidenced by numerous studies in materia medica. By focusing on patient-centered care and the body's innate ability to heal, homeopathy offers a complementary approach to conventional treatments for chronic diseases.
What are the Homeopathy Product market trends shaping the Industry?
- The growing adoption of telemedicine and digital platforms is a notable trend in the homeopathy market, with an increasing number of consultations being conducted online. Homeopathy treatments are now accessible through virtual means, providing patients with convenient and efficient access to professional care. The market experiences significant growth as more individuals seek complementary medicine for symptom relief and disease prevention. Homeopathic dilution, a key aspect of this therapeutic approach, continues to gain popularity. Stress management and pain management are prominent applications, with homeopathic remedies offering a holistic and natural alternative to conventional treatments. Integrative medicine practices increasingly incorporate homeopathy into their offerings, recognizing its potential benefits. Dietary supplements infused with homeopathic ingredients are gaining traction as well.
- Regulatory compliance is crucial in this market, ensuring the safety and efficacy of homeopathic remedies. Digestive health is a significant focus area, with homeopathy offering potential relief for various gastrointestinal issues. The advent of telemedicine has made homeopathic care more accessible, enabling remote consultations and eliminating geographical barriers. Leading companies are embracing this trend, offering telemedicine services to connect patients with qualified homeopathic practitioners worldwide. The market is driven by the increasing demand for natural and holistic healthcare solutions. Telemedicine and digital platforms are transforming the way homeopathic care is accessed, making it more convenient and accessible to a broader audience.
How does Homeopathy Product market face challenges during its growth?
- The homeopathy industry faces significant challenges due to concerns surrounding the efficacy and regulatory compliance of its products, which can hinder market expansion. Homeopathy, based on natural health principles, has gained popularity in managing various health conditions, including sleep disorders and chronic conditions. However, the market faces challenges due to regulatory scrutiny over its safety and efficacy. In some regions, homeopathy is subject to rigorous regulations, such as Good Manufacturing Practices (GMP) and clinical trials, ensuring product safety and quality.
- Functional medicine and energy medicine practitioners, including licensed homeopaths and naturopathic doctors, continue to advocate for homeopathy's benefits. By adhering to these principles, the market can build trust and credibility among consumers and regulatory bodies alike. For instance, in India, the Central Council of Homeopathy (CCH) regulates the practice and education, while Germany's Commission E provides guidelines for herbal remedies used in homeopathy. Despite these regulatory frameworks, skepticism persists due to the lack of robust scientific evidence. This method involves the ingestion of homeopathic preparations in various forms, including liquid solutions, sugar pellets, tablets, and drops.
Exclusive Customer Landscape
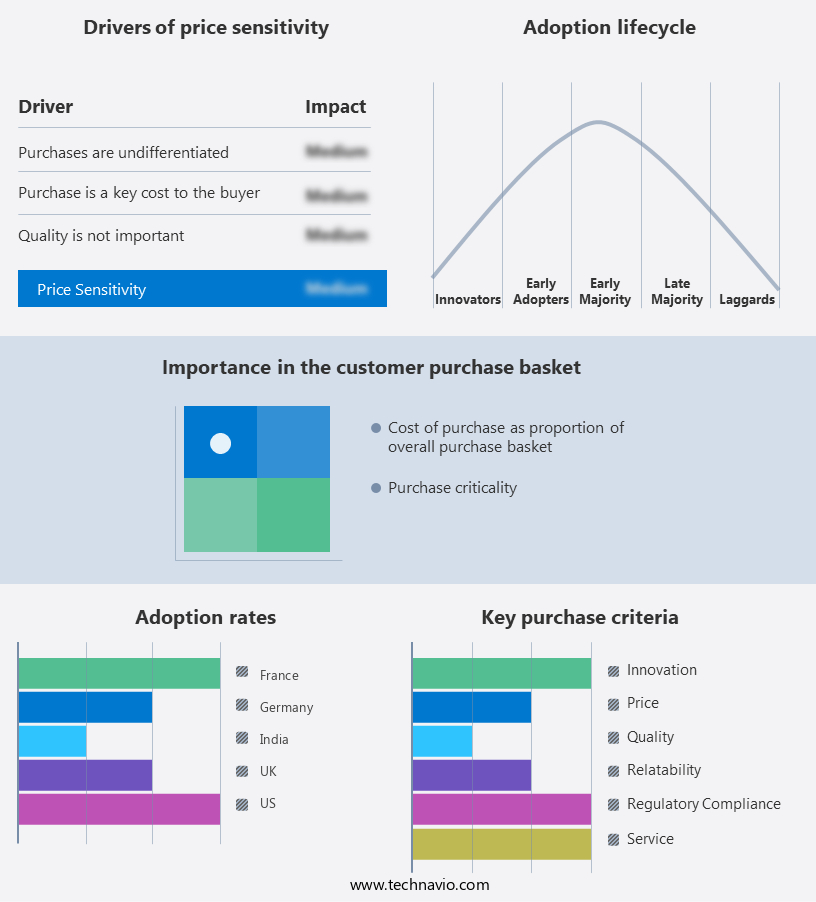
The homeopathy product market forecasting report includes the adoption lifecycle of the market, covering from the innovator's stage to the laggard's stage. It focuses on adoption rates in different regions based on penetration. Furthermore, the homeopathy product market report also includes key purchase criteria and drivers of price sensitivity to help companies evaluate and develop their market growth analysis strategies.
Customer Landscape
Key Companies & Market Insights
Companies are implementing various strategies, such as strategic alliances, homeopathy product market forecast, partnerships, mergers and acquisitions, geographical expansion, and product/service launches, to enhance their presence in the industry.
Ainsworths - The company specializes in homeopathy, providing a range of remedies including Aconitum, Arnica montana, Arsenicum album, Belladonna, Calcium carbonicum, Magnesium phosphoricum, Nux vomica, and Magnesium phosphoricum.
The industry research and growth report includes detailed analyses of the competitive landscape of the market and information about key companies, including:
- Ainsworths
- Bio-India Pharma
- Boiron
- Dr. Reckeweg
- Dr. Willmar Schwabe GmbH and Co. KG
- Hahnemann Laboratories Inc.
- Helios Homeopathy
- Hevert-Arzneimittel
- Homeocan Inc.
- LDD BIOSCIENCE
- Lords Homoeopathy
- Medisynth Chemicals Pvt. Ltd.
- Nelsons
- NP. DUTT and Son
- Pax Healthcare
- POWELL
- ROBUSCA PHARMA PVT LTD
- Rxhomeo Pvt. Ltd.
- SBL Pvt. Ltd.
Qualitative and quantitative analysis of companies has been conducted to help clients understand the wider business environment as well as the strengths and weaknesses of key industry players. Data is qualitatively analyzed to categorize companies as pure play, category-focused, industry-focused, and diversified; it is quantitatively analyzed to categorize companies as dominant, leading, strong, tentative, and weak.
Recent Development and News in Homeopathy Product Market
- In March 2024, Boericke & Tafel, a leading homeopathic remedy manufacturer, announced the launch of their new line of personalized homeopathic remedies. This innovative product offering utilizes advanced technology to create customized remedies based on individual health needs (Boericke & Tafel Press Release, 2024).
- In July 2024, Hahnemann Laboratories, a significant player in the homeopathy market, entered into a strategic partnership with a major pharmaceutical company, Merck KGaA. This collaboration aims to expand Hahnemann Laboratories' reach and distribution network, enabling them to serve a broader customer base (Merck KGaA Press Release, 2024).
- In January 2025, Hyland's, a renowned homeopathic brand, secured a significant investment of USD 50 million from a private equity firm, Quadrant Capital Partners. This funding will be used to expand production capacity and strengthen the company's market position (Quadrant Capital Partners Press Release, 2025).
- In May 2025, the European Commission approved the use of homeopathy in veterinary medicine. This decision marks a significant policy change, opening new opportunities for homeopathy product manufacturers in the animal healthcare sector (European Commission Press Release, 2025).
Research Analyst Overview
The market continues to evolve, reflecting the dynamic nature of consumer health preferences and scientific discoveries. Homeopathic remedies, derived from natural sources, offer symptom relief for various conditions, including skin issues and respiratory health. The holistic approach of homeopathy, rooted in the principle of "similia similibus curentur" (like cures like), integrates well with complementary medicine and integrative practices. Homeopathic dilution, a unique feature of these remedies, is subject to ongoing research and regulatory compliance. Complementary therapies, such as stress management and disease prevention, are gaining traction in the market. Dietary supplements, homeopathic remedies, and pain management solutions are increasingly sought after for their potential to support overall well-being.
Adverse effects, safety standards, and regulatory compliance are crucial aspects of the homeopathy market. Patient education and online consultations with licensed homeopaths and naturopathic doctors play a significant role in ensuring the proper use of these natural health products. Telemedicine allows patients to consult with homeopathic practitioners remotely, eliminating the need for in-person visits and overcoming geographical barriers. The homeopathic pharmacopeia, which includes herbal extracts and other natural ingredients, is continually expanding, with ongoing research and clinical trials contributing to the validation of homeopathic principles. The mind-body connection, immune system support, and energy medicine are also gaining attention in the homeopathy community. The market for homeopathy is diverse, with applications across various sectors, including chronic conditions, functional medicine, and sleep disorders.
The continuous unfolding of market activities and evolving patterns underscore the potential for growth and innovation in this dynamic field. The market for homeopathic remedies also encompasses complementary medicine, integrative medicine, and functional medicine, as consumers seek a more holistic and balanced approach to healthcare. Energy medicine and mind-body connection further expand the scope of homeopathy's application. Despite the placebo effect, homeopathy offers symptomatic relief and potential disease prevention, making it a valuable addition to conventional healthcare practices. The market for homeopathic products is subject to regulatory compliance, with GMP standards ensuring the safety and quality of manufacturing processes. Adverse effects, though rare, are a concern, and open communication between practitioners, patients, and regulatory bodies is essential for addressing any issues.
Dive into Technavio's robust research methodology, blending expert interviews, extensive data synthesis, and validated models for unparalleled Homeopathy Product Market insights. See full methodology.
|
Market Scope |
|
|
Report Coverage |
Details |
|
Page number |
202 |
|
Base year |
2024 |
|
Historic period |
2019-2023 |
|
Forecast period |
2025-2029 |
|
Growth momentum & CAGR |
Accelerate at a CAGR of 11.1% |
|
Market growth 2025-2029 |
USD 9.1 billion |
|
Market structure |
Fragmented |
|
YoY growth 2024-2025(%) |
10.5 |
|
Key countries |
US, India, Germany, Canada, France, China, Mexico, UK, Japan, and South Korea |
|
Competitive landscape |
Leading Companies, Market Positioning of Companies, Competitive Strategies, and Industry Risks |
What are the Key Data Covered in this Homeopathy Product Market Research and Growth Report?
- CAGR of the Homeopathy Product industry during the forecast period
- Detailed information on factors that will drive the growth and forecasting between 2025 and 2029
- Precise estimation of the size of the market and its contribution of the industry in focus to the parent market
- Accurate predictions about upcoming growth and trends and changes in consumer behaviour
- Growth of the market across North America, Europe, APAC, South America, and Middle East and Africa
- Thorough analysis of the market's competitive landscape and detailed information about companies
- Comprehensive analysis of factors that will challenge the homeopathy product market growth of industry companies
We can help! Our analysts can customize this homeopathy product market research report to meet your requirements.
 RIA -
RIA - 
