Homeowners Insurance Market Analysis North America, Europe, APAC, South America, Middle East and Africa - US, Japan, UK, China, Germany - Size and Forecast 2024-2028

Homeowners Insurance Market Analysis North America, Europe, APAC, South America, Middle East and Africa - US, Japan, UK, China, Germany - Size and Forecast 2024-2028

Published: Jul 2024 167 Pages SKU: IRTNTR74780

Market Overview at a Glance

$65.9 B
Market Opportunity
4.6%
CAGR
4.17
YoY growth 2023-2024(%)

Homeowners Insurance Market Size 2024-2028

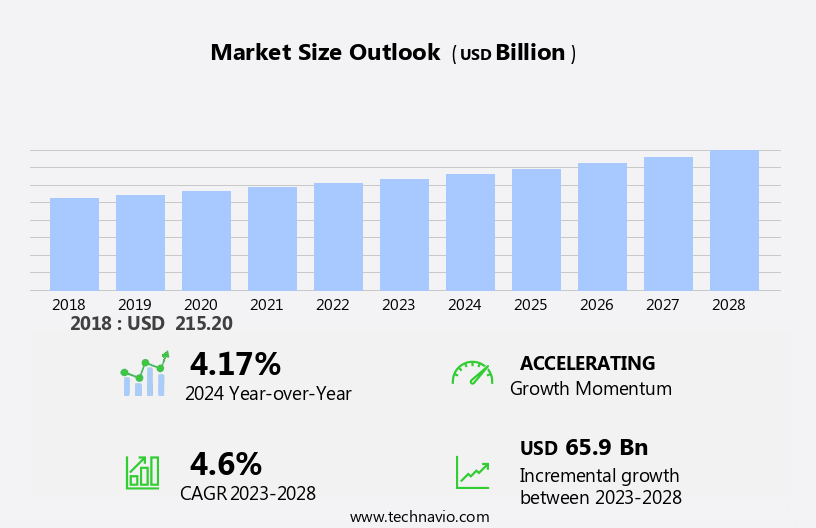
The homeowners insurance market size is forecast to increase by USD 65.9 billion at a CAGR of 4.6% between 2023 and 2028.

  • The market is experiencing significant growth due to several key factors. The increasing number of natural disasters and man-made hazards has led to a higher demand for comprehensive insurance coverage. New technological developments In the home insurance industry, such as the use of drones for property inspections and smart home systems for risk mitigation, are transforming the market. Additionally, the vulnerability to cybercrimes, including identity theft and hacking, is driving insurers to offer cyber insurance policies as part of their homeowners packages. These trends are shaping the future of the market and are expected to continue influencing its growth.

What will be the Size of the Homeowners Insurance Market During the Forecast Period?

Homeowners Insurance Market Size

 Request Free Sample

  • The market is a significant segment of the global casualty insurance sector, providing financial protection for homeowners against various risks. Homeowners, as key asset holders, rely on insurance companies to safeguard their financial security against potential losses from incidents such as natural disasters, theft, and property damage. Insurers employ advanced risk assessment tools to evaluate and price policies based on factors like location, property values, and historical claims data. Recent market trends include increasing concerns over catastrophic risks, driven by both natural disasters and pandemic-related losses. The low-interest-rate environment has also influenced the market, affecting loss reserves and policyholder surplus.
  • Moreover, insurance companies continue to navigate the challenges posed by financial market losses and the legal responsibility to policyholders for covered damages. Asset prices and loss reserves remain crucial indicators of market stability, with property insurance and household/private property insurance being the primary types of coverage sought by homeowners.

How is this Homeowners Insurance Industry segmented and which is the largest segment?

The homeowners insurance industry research report provides comprehensive data (region-wise segment analysis), with forecasts and estimates in "USD billion" for the period 2024-2028, as well as historical data from 2018-2022 for the following segments.
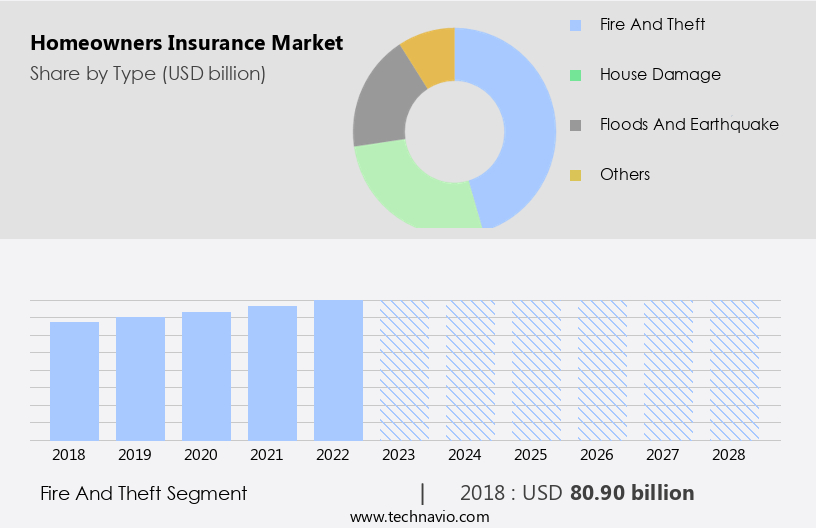
  • Type
    • Fire and theft
    • House damage
    • Floods and earthquake
    • Others
  • Source
    • Captive
    • Independent agent
    • Direct response
  • Geography
    • North America
      • US
    • Europe
      • Germany
      • UK
    • APAC
      • China
      • Japan
    • South America
    • Middle East and Africa

By Type Insights

  • The fire and theft segment is estimated to witness significant growth during the forecast period.

The market growth is driven by the increasing prevalence of natural disasters and theft incidents, leading homeowners to seek additional coverage beyond standard property insurance policies. Fire insurance, a significant segment, protects against losses caused by fire, with many homeowners opting for additional coverage to offset costs exceeding their base policy limits. Policies exclude certain perils, such as war and nuclear risks. Theft insurance, another essential component, safeguards against financial losses resulting from theft or vandalism. Advanced risk assessment tools enable insurance firms to customize policies based on clients' risk profiles and underwriting guidelines, offering premium payment flexibility and virtual interactions.

Homeowners Insurance Market Size

Get a glance at the  Homeowners Insurance Industry report of share of various segments Request Free Sample

The fire and theft segment was valued at USD 80.90 billion in 2018 and showed a gradual increase during the forecast period.

Regional Analysis

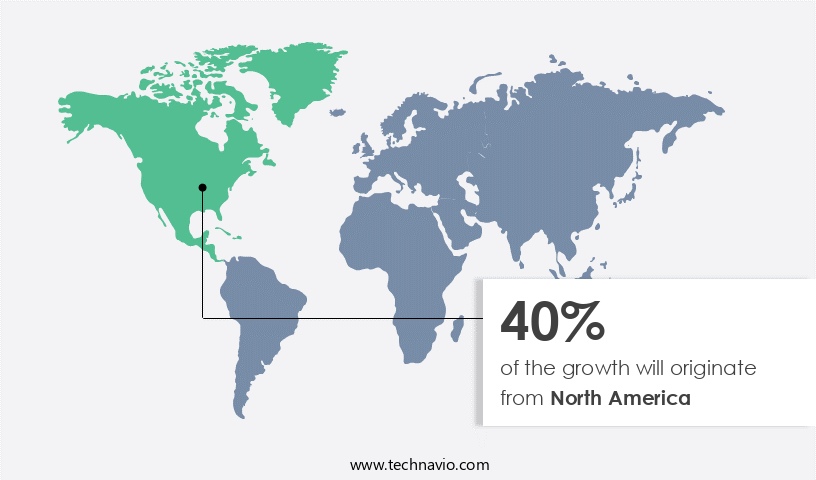
  • North America is estimated to contribute 40% to the growth of the global market during the forecast period.

Technavio's analysts have elaborately explained the regional trends and drivers that shape the market during the forecast period.

Homeowners Insurance Market Share by Geography

For more insights on the market share of various regions, Request Free Sample

The North American market will experience steady growth due to the high frequency of natural disasters, leading to an increased demand for reinsurance policies. Catastrophic events, such as hurricanes, tornados, and tsunamis, can cause significant damage to residential properties, resulting in substantial insurance claims. Reinsurers provide capital to primary insurers when the number of claims is high, ensuring financial security for policyholders. Despite the challenges, reinsurance firms have managed to maintain consistent revenue streams. Property values, homeowners, assets, and liability coverage are integral components of homeowners insurance policies. Insurance providers offer customized policies for various risks, including natural disasters, theft, and incidents.

Market Dynamics

Our researchers analyzed the data with 2023 as the base year, along with the key drivers, trends, and challenges. A holistic analysis of drivers will help companies refine their marketing strategies to gain a competitive advantage.

What are the key market drivers leading to the rise In the adoption of Homeowners Insurance Industry?

Rising number of natural disasters and man-made hazards is the key driver of the market.

  • The market experiences significant growth due to the increasing demand for coverage against various incidents, including property damage from fires, storms, vandalism, and theft. Homeowners seek financial security through customizable insurance policies that cater to their unique risk profiles and provide compensation for losses. Natural disasters, such as hurricanes, floods, earthquakes, and wildfires, have heightened the need for comprehensive coverage. Insurance companies employ risk assessment tools and underwriting guidelines to evaluate potential clients and their properties. Premiums vary based on factors like location, property values, and risk factors. Flexible payment plans enable clients to manage their insurance expenses. The integration of technology, such as artificial intelligence, machine learning, virtual reality, and blockchain technology, revolutionizes the insurance industry.
  • In addition, online insurance platforms facilitate virtual interactions, offering customized insurance products tailored to clients' needs. Dwelling coverage, content coverage, and liability coverage are essential components of home insurance policies. Landlords and tenants also require insurance for rental property operations, ensuring legal protection against financial losses, injuries, and accidents. Home values and construction activity influence insurance premiums. Loss reserves, unearned premium reserves, and underwriting operations are crucial aspects of traditional insurance companies' operations. Insurtech companies leverage self-made technology, application program interfaces, and data analytics to streamline insurance processes and offer innovative solutions for small and medium enterprises (SMEs) and entrepreneurs.

What are the market trends shaping the Homeowners Insurance Industry?

New technological developments in home insurance industry is the upcoming market trend.

  • The market is experiencing significant advancements driven by technology, leading to increased productivity and customized insurance solutions. Geo-location, application program interfaces (APIs), artificial intelligence (AI), data analytics, blockchain, and big data are transforming the industry. These technologies enable insurers to provide diverse covers like additional living expenses (ALE) and renter's insurance at the point of purchase. Furthermore, digital transformation offers personalized user experiences to clients. Insurers are also exploring the potential of big data analytics to generate premium revenue In the market. This technological evolution aims to preserve the market position and cater to various homeowners' risk profiles, including natural disasters, theft, and incidents.
  • Moreover, home values, loss from fire, storms, vandalism, and other perils are addressed through customizable policies for landlords, tenants, and homebuyers. Injuries, accidents, and legal protection are also covered. Premium payment flexibility, virtual interactions, and loss reserves are essential components of these policies. Insurance providers offer dwelling coverage, content coverage, and liability coverage for banking, construction activity, and housing residential properties. The casualty insurance sector is impacted by low interest rates, catastrophic concerns, and pandemic-related losses, affecting financial market losses and insurance losses. Policyholder surplus, asset prices, and unearned premium reserves are essential underwriting operations for traditional insurance companies and Insurtech firms alike.

What challenges does the Homeowners Insurance Industry face during its growth?

Vulnerability to cybercrimes is a key challenge affecting the industry growth.

  • The market is witnessing significant changes due to various factors. Property values continue to rise, leading to an increase in assets at risk for homeowners. Natural disasters, theft incidents, and other risks necessitate the use of advanced risk assessment tools by insurance companies to evaluate clients' risk profiles and adjust underwriting guidelines. Premium payment flexibility, virtual interactions, and customized insurance products are becoming essential for insurance firms to cater to clients' needs. Advancements in technology, such as artificial intelligence, machine learning, virtual reality, and augmented reality, are transforming the industry. Online insurance platforms enable clients to access dwelling coverage, content coverage, and liability coverage with ease.
  • In addition, banking and construction activity also impact home values, leading to potential financial losses from property damage due to fires, storms, vandalism, and other causes. Landlords and tenants, migration, and rental property operations require legal protection against financial losses, injuries, and accidents. Landowner insurance policies cover various natural catastrophes, including hurricanes, floods, earthquakes, and severe weather events. Homebuyers increasingly rely on insurance claims to cover losses and damages, making flexible payment plans a crucial offering for insurers. The tenants segment requires interior and exterior damage coverage, while liability coverage is essential for homeowners. Household pets, poor home maintenance, and man-made disasters also pose risks that insurance policies address.

Exclusive Customer Landscape

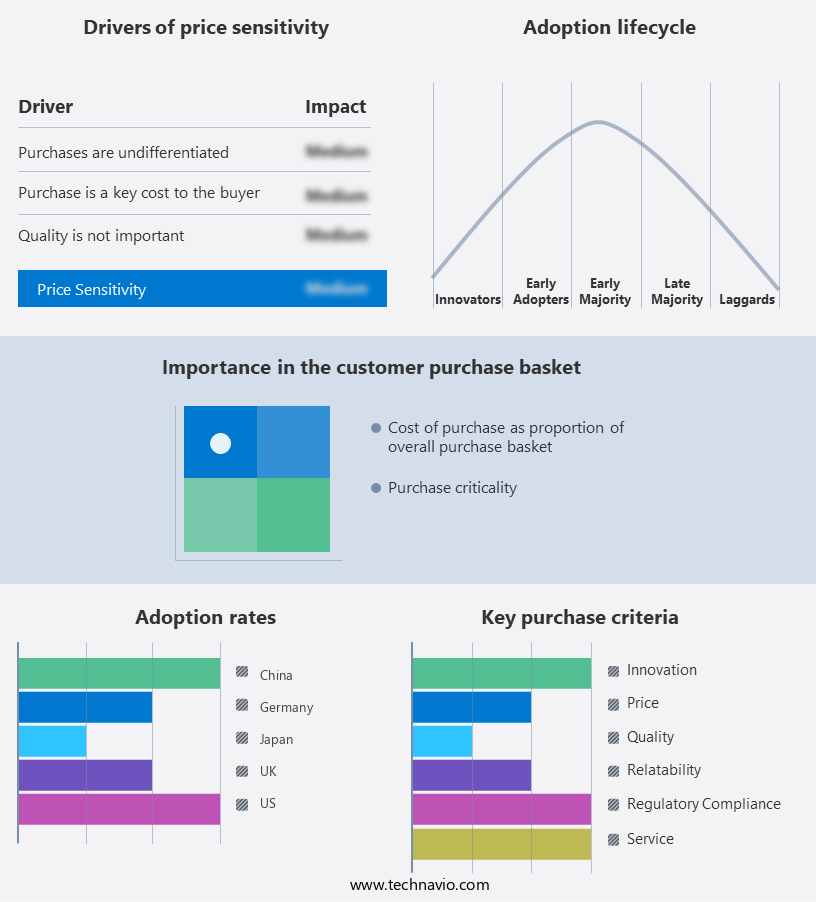
The homeowners insurance market forecasting report includes the adoption lifecycle of the market, covering from the innovator's stage to the laggard's stage. It focuses on adoption rates in different regions based on penetration. Furthermore, the homeowners insurance market report also includes key purchase criteria and drivers of price sensitivity to help companies evaluate and develop their market growth analysis strategies.

Homeowners Insurance Market Share by Geography

 Customer Landscape

Key Companies & Market Insights

Companies are implementing various strategies, such as strategic alliances, homeowners insurance market forecast, partnerships, mergers and acquisitions, geographical expansion, and product/service launches, to enhance their presence In the industry.

The industry research and growth report includes detailed analyses of the competitive landscape of the market and information about key companies, including:

  • Admiral Group plc
  • Allianz SE
  • American International Group Inc.
  • Amica Mutual Insurance Co.
  • AXA Group
  • Berkshire Hathaway Inc.
  • Chubb Ltd.
  • Erie Indemnity Co.
  • Lemonade Inc.
  • Liberty Mutual Insurance Co.
  • Metlife Inc.
  • Nationwide Mutual Insurance Co.
  • NJM Insurance Group
  • State Farm Mutual Automobile Insurance Co.
  • The Allstate Corp.
  • The Progressive Corp.
  • The Travelers Co. Inc.
  • USAA
  • Wells Fargo and Co.
  • Zurich Insurance Co. Ltd.

Qualitative and quantitative analysis of companies has been conducted to help clients understand the wider business environment as well as the strengths and weaknesses of key industry players. Data is qualitatively analyzed to categorize companies as pure play, category-focused, industry-focused, and diversified; it is quantitatively analyzed to categorize companies as dominant, leading, strong, tentative, and weak.

Research Analyst Overview

The market encompasses a significant segment of the property and casualty insurance sector. This market is driven by the need for financial security among homeowners, who seek to protect their assets against various risks. Homeowners' assets include not only the dwelling itself but also its contents and any liability that may arise from the property. Natural disasters, theft, and incidents are among the primary risks that homeowners face. To assess these risks, insurance providers employ various tools and techniques. These may include risk assessment models, underwriting guidelines, and premium payment flexibility. Virtual interactions and customized insurance products are also becoming increasingly popular.

In addition, artificial intelligence (AI) and machine learning are transforming the market. These technologies enable insurers to analyze vast amounts of data, including historical claims data, weather patterns, and construction materials. This information is used to calculate risk profiles and determine premiums. The market is also influenced by broader economic trends. For example, low interest rates can lead to increased home buying and construction activity, which in turn can lead to higher demand for insurance. Urbanization and the migration to rental properties are also impacting the market. Home values are a critical factor In the market. Losses from fires, storms, vandalism, and other perils can result in significant financial losses for policyholders.

Furthermore, customizable policies allow homeowners to tailor their coverage to their specific needs, including liability coverage for landlords and tenants. In the event of a loss, insurance policies provide compensation for damages and financial losses. This can include coverage for interior and exterior damage, injuries, and accidents. Household pets can also be covered under some policies. The market is not without challenges. Poor home maintenance and man-made disasters can lead to claims. Natural catastrophes, such as hurricanes, floods, earthquakes, and wildfires, can result in massive losses. Insurers must balance the need to provide coverage with the need to manage risk and maintain profitability.

In addition, the use of technology is transforming the market. Online insurance platforms and application program interfaces (APIs) enable efficient data collection and analysis. Big data analytics and fraud detection tools help insurers manage risk and prevent losses. Blockchain technology offers the potential for secure and transparent transactions. The market is evolving rapidly. Traditional insurance companies are facing competition from insurtech companies and self-made technology. APIs, IoT, and AI are enabling new business models and distribution platforms. The use of data analytics and big data is transforming underwriting operations.

Market Scope

Report Coverage

Details

Page number

167

Base year

2023

Historic period

2018-2022

Forecast period

2024-2028

Growth momentum & CAGR

Accelerate at a CAGR of 4.6%

Market growth 2024-2028

USD 65.9 billion

Market structure

Fragmented

YoY growth 2023-2024(%)

4.17

Key countries

US, Japan, UK, China, and Germany

Competitive landscape

Leading Companies, market growth and forecasting , Market Positioning of Companies, Competitive Strategies, and Industry Risks

Request Free Sample

What are the Key Data Covered in this Homeowners Insurance Market Research and Growth Report?

  • CAGR of the Homeowners Insurance industry during the forecast period
  • Detailed information on factors that will drive the growth and forecasting between 2024 and 2028
  • Precise estimation of the size of the market and its contribution of the industry in focus to the parent market
  • Accurate predictions about upcoming growth and trends and changes in consumer behaviour
  • Growth of the market across North America, Europe, APAC, South America, and Middle East and Africa
  • Thorough analysis of the market's competitive landscape and detailed information about companies
  • Comprehensive analysis of factors that will challenge the homeowners insurance market growth of industry companies

We can help! Our analysts can customize this homeowners insurance market research report to meet your requirements.

Get in touch

1 Executive Summary

  • 1.1 Market overview
    • Executive Summary - Chart on Market Overview
    • Executive Summary - Data Table on Market Overview
    • Executive Summary - Chart on Global Market Characteristics
    • Executive Summary - Chart on Market by Geography
    • Executive Summary - Chart on Market Segmentation by Type
    • Executive Summary - Chart on Market Segmentation by Source
    • Executive Summary - Chart on Incremental Growth
    • Executive Summary - Data Table on Incremental Growth
    • Executive Summary - Chart on Company Market Positioning

2 Market Landscape

  • 2.1 Market ecosystem
    • Parent Market
    • Data Table on - Parent Market
  • 2.2 Market characteristics
    • Market characteristics analysis
  • 2.3 Value chain analysis
    • Value Chain Analysis

3 Market Sizing

  • 3.1 Market definition
    • Offerings of companies included in the market definition
  • 3.2 Market segment analysis
    • Market segments
  • 3.3 Market size 2023
    • 3.4 Market outlook: Forecast for 2023-2028
      • Chart on Global - Market size and forecast 2023-2028 ($ billion)
      • Data Table on Global - Market size and forecast 2023-2028 ($ billion)
      • Chart on Global Market: Year-over-year growth 2023-2028 (%)
      • Data Table on Global Market: Year-over-year growth 2023-2028 (%)

    4 Historic Market Size

    • 4.1 Global Homeowners Insurance Market 2018 - 2022
      • Historic Market Size - Data Table on Global Homeowners Insurance Market 2018 - 2022 ($ billion)
    • 4.2 Type segment analysis 2018 - 2022
      • Historic Market Size - Type Segment 2018 - 2022 ($ billion)
    • 4.3 Source segment analysis 2018 - 2022
      • Historic Market Size - Source Segment 2018 - 2022 ($ billion)
    • 4.4 Geography segment analysis 2018 - 2022
      • Historic Market Size - Geography Segment 2018 - 2022 ($ billion)
    • 4.5 Country segment analysis 2018 - 2022
      • Historic Market Size - Country Segment 2018 - 2022 ($ billion)

    5 Five Forces Analysis

    • 5.1 Five forces summary
      • Five forces analysis - Comparison between 2023 and 2028
    • 5.2 Bargaining power of buyers
      • Bargaining power of buyers - Impact of key factors 2023 and 2028
    • 5.3 Bargaining power of suppliers
      • Bargaining power of suppliers - Impact of key factors in 2023 and 2028
    • 5.4 Threat of new entrants
      • Threat of new entrants - Impact of key factors in 2023 and 2028
    • 5.5 Threat of substitutes
      • Threat of substitutes - Impact of key factors in 2023 and 2028
    • 5.6 Threat of rivalry
      • Threat of rivalry - Impact of key factors in 2023 and 2028
    • 5.7 Market condition
      • Chart on Market condition - Five forces 2023 and 2028

    6 Market Segmentation by Type

    • 6.1 Market segments
      • Chart on Type - Market share 2023-2028 (%)
      • Data Table on Type - Market share 2023-2028 (%)
    • 6.2 Comparison by Type
      • Chart on Comparison by Type
      • Data Table on Comparison by Type
    • 6.3 Fire and theft - Market size and forecast 2023-2028
      • Chart on Fire and theft - Market size and forecast 2023-2028 ($ billion)
      • Data Table on Fire and theft - Market size and forecast 2023-2028 ($ billion)
      • Chart on Fire and theft - Year-over-year growth 2023-2028 (%)
      • Data Table on Fire and theft - Year-over-year growth 2023-2028 (%)
    • 6.4 House damage - Market size and forecast 2023-2028
      • Chart on House damage - Market size and forecast 2023-2028 ($ billion)
      • Data Table on House damage - Market size and forecast 2023-2028 ($ billion)
      • Chart on House damage - Year-over-year growth 2023-2028 (%)
      • Data Table on House damage - Year-over-year growth 2023-2028 (%)
    • 6.5 Floods and earthquake - Market size and forecast 2023-2028
      • Chart on Floods and earthquake - Market size and forecast 2023-2028 ($ billion)
      • Data Table on Floods and earthquake - Market size and forecast 2023-2028 ($ billion)
      • Chart on Floods and earthquake - Year-over-year growth 2023-2028 (%)
      • Data Table on Floods and earthquake - Year-over-year growth 2023-2028 (%)
    • 6.6 Others - Market size and forecast 2023-2028
      • Chart on Others - Market size and forecast 2023-2028 ($ billion)
      • Data Table on Others - Market size and forecast 2023-2028 ($ billion)
      • Chart on Others - Year-over-year growth 2023-2028 (%)
      • Data Table on Others - Year-over-year growth 2023-2028 (%)
    • 6.7 Market opportunity by Type
      • Market opportunity by Type ($ billion)
      • Data Table on Market opportunity by Type ($ billion)

    7 Market Segmentation by Source

    • 7.1 Market segments
      • Chart on Source - Market share 2023-2028 (%)
      • Data Table on Source - Market share 2023-2028 (%)
    • 7.2 Comparison by Source
      • Chart on Comparison by Source
      • Data Table on Comparison by Source
    • 7.3 Captive - Market size and forecast 2023-2028
      • Chart on Captive - Market size and forecast 2023-2028 ($ billion)
      • Data Table on Captive - Market size and forecast 2023-2028 ($ billion)
      • Chart on Captive - Year-over-year growth 2023-2028 (%)
      • Data Table on Captive - Year-over-year growth 2023-2028 (%)
    • 7.4 Independent agent - Market size and forecast 2023-2028
      • Chart on Independent agent - Market size and forecast 2023-2028 ($ billion)
      • Data Table on Independent agent - Market size and forecast 2023-2028 ($ billion)
      • Chart on Independent agent - Year-over-year growth 2023-2028 (%)
      • Data Table on Independent agent - Year-over-year growth 2023-2028 (%)
    • 7.5 Direct response - Market size and forecast 2023-2028
      • Chart on Direct response - Market size and forecast 2023-2028 ($ billion)
      • Data Table on Direct response - Market size and forecast 2023-2028 ($ billion)
      • Chart on Direct response - Year-over-year growth 2023-2028 (%)
      • Data Table on Direct response - Year-over-year growth 2023-2028 (%)
    • 7.6 Market opportunity by Source
      • Market opportunity by Source ($ billion)
      • Data Table on Market opportunity by Source ($ billion)

    8 Customer Landscape

    • 8.1 Customer landscape overview
      • Analysis of price sensitivity, lifecycle, customer purchase basket, adoption rates, and purchase criteria

    9 Geographic Landscape

    • 9.1 Geographic segmentation
      • Chart on Market share by geography 2023-2028 (%)
      • Data Table on Market share by geography 2023-2028 (%)
    • 9.2 Geographic comparison
      • Chart on Geographic comparison
      • Data Table on Geographic comparison
    • 9.3 North America - Market size and forecast 2023-2028
      • Chart on North America - Market size and forecast 2023-2028 ($ billion)
      • Data Table on North America - Market size and forecast 2023-2028 ($ billion)
      • Chart on North America - Year-over-year growth 2023-2028 (%)
      • Data Table on North America - Year-over-year growth 2023-2028 (%)
    • 9.4 Europe - Market size and forecast 2023-2028
      • Chart on Europe - Market size and forecast 2023-2028 ($ billion)
      • Data Table on Europe - Market size and forecast 2023-2028 ($ billion)
      • Chart on Europe - Year-over-year growth 2023-2028 (%)
      • Data Table on Europe - Year-over-year growth 2023-2028 (%)
    • 9.5 APAC - Market size and forecast 2023-2028
      • Chart on APAC - Market size and forecast 2023-2028 ($ billion)
      • Data Table on APAC - Market size and forecast 2023-2028 ($ billion)
      • Chart on APAC - Year-over-year growth 2023-2028 (%)
      • Data Table on APAC - Year-over-year growth 2023-2028 (%)
    • 9.6 South America - Market size and forecast 2023-2028
      • Chart on South America - Market size and forecast 2023-2028 ($ billion)
      • Data Table on South America - Market size and forecast 2023-2028 ($ billion)
      • Chart on South America - Year-over-year growth 2023-2028 (%)
      • Data Table on South America - Year-over-year growth 2023-2028 (%)
    • 9.7 Middle East and Africa - Market size and forecast 2023-2028
      • Chart on Middle East and Africa - Market size and forecast 2023-2028 ($ billion)
      • Data Table on Middle East and Africa - Market size and forecast 2023-2028 ($ billion)
      • Chart on Middle East and Africa - Year-over-year growth 2023-2028 (%)
      • Data Table on Middle East and Africa - Year-over-year growth 2023-2028 (%)
    • 9.8 US - Market size and forecast 2023-2028
      • Chart on US - Market size and forecast 2023-2028 ($ billion)
      • Data Table on US - Market size and forecast 2023-2028 ($ billion)
      • Chart on US - Year-over-year growth 2023-2028 (%)
      • Data Table on US - Year-over-year growth 2023-2028 (%)
    • 9.9 Japan - Market size and forecast 2023-2028
      • Chart on Japan - Market size and forecast 2023-2028 ($ billion)
      • Data Table on Japan - Market size and forecast 2023-2028 ($ billion)
      • Chart on Japan - Year-over-year growth 2023-2028 (%)
      • Data Table on Japan - Year-over-year growth 2023-2028 (%)
    • 9.10 China - Market size and forecast 2023-2028
      • Chart on China - Market size and forecast 2023-2028 ($ billion)
      • Data Table on China - Market size and forecast 2023-2028 ($ billion)
      • Chart on China - Year-over-year growth 2023-2028 (%)
      • Data Table on China - Year-over-year growth 2023-2028 (%)
    • 9.11 UK - Market size and forecast 2023-2028
      • Chart on UK - Market size and forecast 2023-2028 ($ billion)
      • Data Table on UK - Market size and forecast 2023-2028 ($ billion)
      • Chart on UK - Year-over-year growth 2023-2028 (%)
      • Data Table on UK - Year-over-year growth 2023-2028 (%)
    • 9.12 Germany - Market size and forecast 2023-2028
      • Chart on Germany - Market size and forecast 2023-2028 ($ billion)
      • Data Table on Germany - Market size and forecast 2023-2028 ($ billion)
      • Chart on Germany - Year-over-year growth 2023-2028 (%)
      • Data Table on Germany - Year-over-year growth 2023-2028 (%)
    • 9.13 Market opportunity by geography
      • Market opportunity by geography ($ billion)
      • Data Tables on Market opportunity by geography ($ billion)

    10 Drivers, Challenges, and Opportunity/Restraints

    • 10.1 Market drivers
      • 10.2 Market challenges
        • 10.3 Impact of drivers and challenges
          • Impact of drivers and challenges in 2023 and 2028
        • 10.4 Market opportunities/restraints

          11 Competitive Landscape

          • 11.1 Overview
            • 11.2 Competitive Landscape
              • Overview on criticality of inputs and factors of differentiation
            • 11.3 Landscape disruption
              • Overview on factors of disruption
            • 11.4 Industry risks
              • Impact of key risks on business

            12 Competitive Analysis

            • 12.1 Companies profiled
              • Companies covered
            • 12.2 Market positioning of companies
              • Matrix on companies position and classification
            • 12.3 Admiral Group plc
              • Admiral Group plc - Overview
              • Admiral Group plc - Business segments
              • Admiral Group plc - Key offerings
              • Admiral Group plc - Segment focus
            • 12.4 Allianz SE
              • Allianz SE - Overview
              • Allianz SE - Business segments
              • Allianz SE - Key news
              • Allianz SE - Key offerings
              • Allianz SE - Segment focus
            • 12.5 American International Group Inc.
              • American International Group Inc. - Overview
              • American International Group Inc. - Business segments
              • American International Group Inc. - Key news
              • American International Group Inc. - Key offerings
              • American International Group Inc. - Segment focus
            • 12.6 AXA Group
              • AXA Group - Overview
              • AXA Group - Business segments
              • AXA Group - Key news
              • AXA Group - Key offerings
              • AXA Group - Segment focus
            • 12.7 Chubb Ltd.
              • Chubb Ltd. - Overview
              • Chubb Ltd. - Business segments
              • Chubb Ltd. - Key news
              • Chubb Ltd. - Key offerings
              • Chubb Ltd. - Segment focus
            • 12.8 Erie Indemnity Co.
              • Erie Indemnity Co. - Overview
              • Erie Indemnity Co. - Product / Service
              • Erie Indemnity Co. - Key offerings
            • 12.9 Lemonade Inc.
              • Lemonade Inc. - Overview
              • Lemonade Inc. - Product / Service
              • Lemonade Inc. - Key offerings
            • 12.10 Liberty Mutual Insurance Co.
              • Liberty Mutual Insurance Co. - Overview
              • Liberty Mutual Insurance Co. - Business segments
              • Liberty Mutual Insurance Co. - Key offerings
              • Liberty Mutual Insurance Co. - Segment focus
            • 12.11 Nationwide Mutual Insurance Co.
              • Nationwide Mutual Insurance Co. - Overview
              • Nationwide Mutual Insurance Co. - Product / Service
              • Nationwide Mutual Insurance Co. - Key offerings
            • 12.12 State Farm Mutual Automobile Insurance Co.
              • State Farm Mutual Automobile Insurance Co. - Overview
              • State Farm Mutual Automobile Insurance Co. - Product / Service
              • State Farm Mutual Automobile Insurance Co. - Key offerings
            • 12.13 The Allstate Corp.
              • The Allstate Corp. - Overview
              • The Allstate Corp. - Business segments
              • The Allstate Corp. - Key offerings
              • The Allstate Corp. - Segment focus
            • 12.14 The Progressive Corp.
              • The Progressive Corp. - Overview
              • The Progressive Corp. - Product / Service
              • The Progressive Corp. - Key offerings
            • 12.15 The Travelers Co. Inc.
              • The Travelers Co. Inc. - Overview
              • The Travelers Co. Inc. - Business segments
              • The Travelers Co. Inc. - Key offerings
              • The Travelers Co. Inc. - Segment focus
            • 12.16 USAA
              • USAA - Overview
              • USAA - Product / Service
              • USAA - Key offerings
            • 12.17 Zurich Insurance Co. Ltd.
              • Zurich Insurance Co. Ltd. - Overview
              • Zurich Insurance Co. Ltd. - Business segments
              • Zurich Insurance Co. Ltd. - Key offerings
              • Zurich Insurance Co. Ltd. - Segment focus

            13 Appendix

            • 13.1 Scope of the report
              • 13.2 Inclusions and exclusions checklist
                • Inclusions checklist
                • Exclusions checklist
              • 13.3 Currency conversion rates for US$
                • Currency conversion rates for US$
              • 13.4 Research methodology
                • Research methodology
              • 13.5 Data procurement
                • Information sources
              • 13.6 Data validation
                • Data validation
              • 13.7 Validation techniques employed for market sizing
                • Validation techniques employed for market sizing
              • 13.8 Data synthesis
                • Data synthesis
              • 13.9 360 degree market analysis
                • 360 degree market analysis
              • 13.10 List of abbreviations
                • List of abbreviations

              Research Methodology

              Technavio presents a detailed picture of the market by way of study, synthesis, and summation of data from multiple sources. The analysts have presented the various facets of the market with a particular focus on identifying the key industry influencers. The data thus presented is comprehensive, reliable, and the result of extensive research, both primary and secondary.

              INFORMATION SOURCES

              Primary sources

              • Manufacturers and suppliers
              • Channel partners
              • Industry experts
              • Strategic decision makers

              Secondary sources

              • Industry journals and periodicals
              • Government data
              • Financial reports of key industry players
              • Historical data
              • Press releases

              DATA ANALYSIS

              Data Synthesis

              • Collation of data
              • Estimation of key figures
              • Analysis of derived insights

              Data Validation

              • Triangulation with data models
              • Reference against proprietary databases
              • Corroboration with industry experts

              REPORT WRITING

              Qualitative

              • Market drivers
              • Market challenges
              • Market trends
              • Five forces analysis

              Quantitative

              • Market size and forecast
              • Market segmentation
              • Geographical insights
              • Competitive landscape

              Interested in this report?

              Get your sample now to see our research methodology and insights!

              Download Now

              Frequently Asked Questions

              Homeowners Insurance market growth will increase by $ 65.9 bn during 2024-2028 .

              The Homeowners Insurance market is expected to grow at a CAGR of 4.6% during 2024-2028 .

              Homeowners Insurance market is segmented by Type( Fire and theft, House damage, Floods and earthquake, Others) Source( Captive, Independent agent, Direct response)

              Admiral Group plc, Allianz SE, American International Group Inc., Amica Mutual Insurance Co., AXA Group, Berkshire Hathaway Inc., Chubb Ltd., Erie Indemnity Co., Lemonade Inc., Liberty Mutual Insurance Co., Metlife Inc., Nationwide Mutual Insurance Co., NJM Insurance Group, State Farm Mutual Automobile Insurance Co., The Allstate Corp., The Progressive Corp., The Travelers Co. Inc., USAA, Wells Fargo and Co., Zurich Insurance Co. Ltd. are a few of the key vendors in the Homeowners Insurance market.

              North America will register the highest growth rate of 40% among the other regions. Therefore, the Homeowners Insurance market in North America is expected to garner significant business opportunities for the vendors during the forecast period.

              US, Japan, UK, China, Germany

              • Rising number of natural disasters and man-made hazardsThe rise in the demand for home insurance on accidents such as interior or exterior home damage is the driving factor this market.
              • damage to assets or injury is the driving factor this market.
              • theft is the driving factor this market.
              • and fire puts pressure on insurance companies to invest and develop such products that have less proliferation is the driving factor this market.
              • high coverage is the driving factor this market.
              • and provide financial security in the form of medical injury or any other damages is the driving factor this market.
              • which boosts the growth of the global home insurance market. Natural disasters such as floods is the driving factor this market.
              • earthquakes is the driving factor this market.
              • vandalism is the driving factor this market.
              • and landslides have led to a surge in the demand for house insurance in recent years. The majority of homeowners rely on house insurance to protect themselves against potential financial losses caused by harm to other people's property is the driving factor this market.
              • family members is the driving factor this market.
              • and pets. Moreover is the driving factor this market.
              • home insurance includes coverage is the driving factor this market.
              • which helps to compensate policyholders of the family members after his/her death. Such factors are expected to drive the growth of the global homeowners insurance market during the forecast period. is the driving factor this market.

              The Homeowners Insurance market vendors should focus on grabbing business opportunities from the Fire and theft segment as it accounted for the largest market share in the base year.