
North America HVAC Equipment Market Size 2025-2029
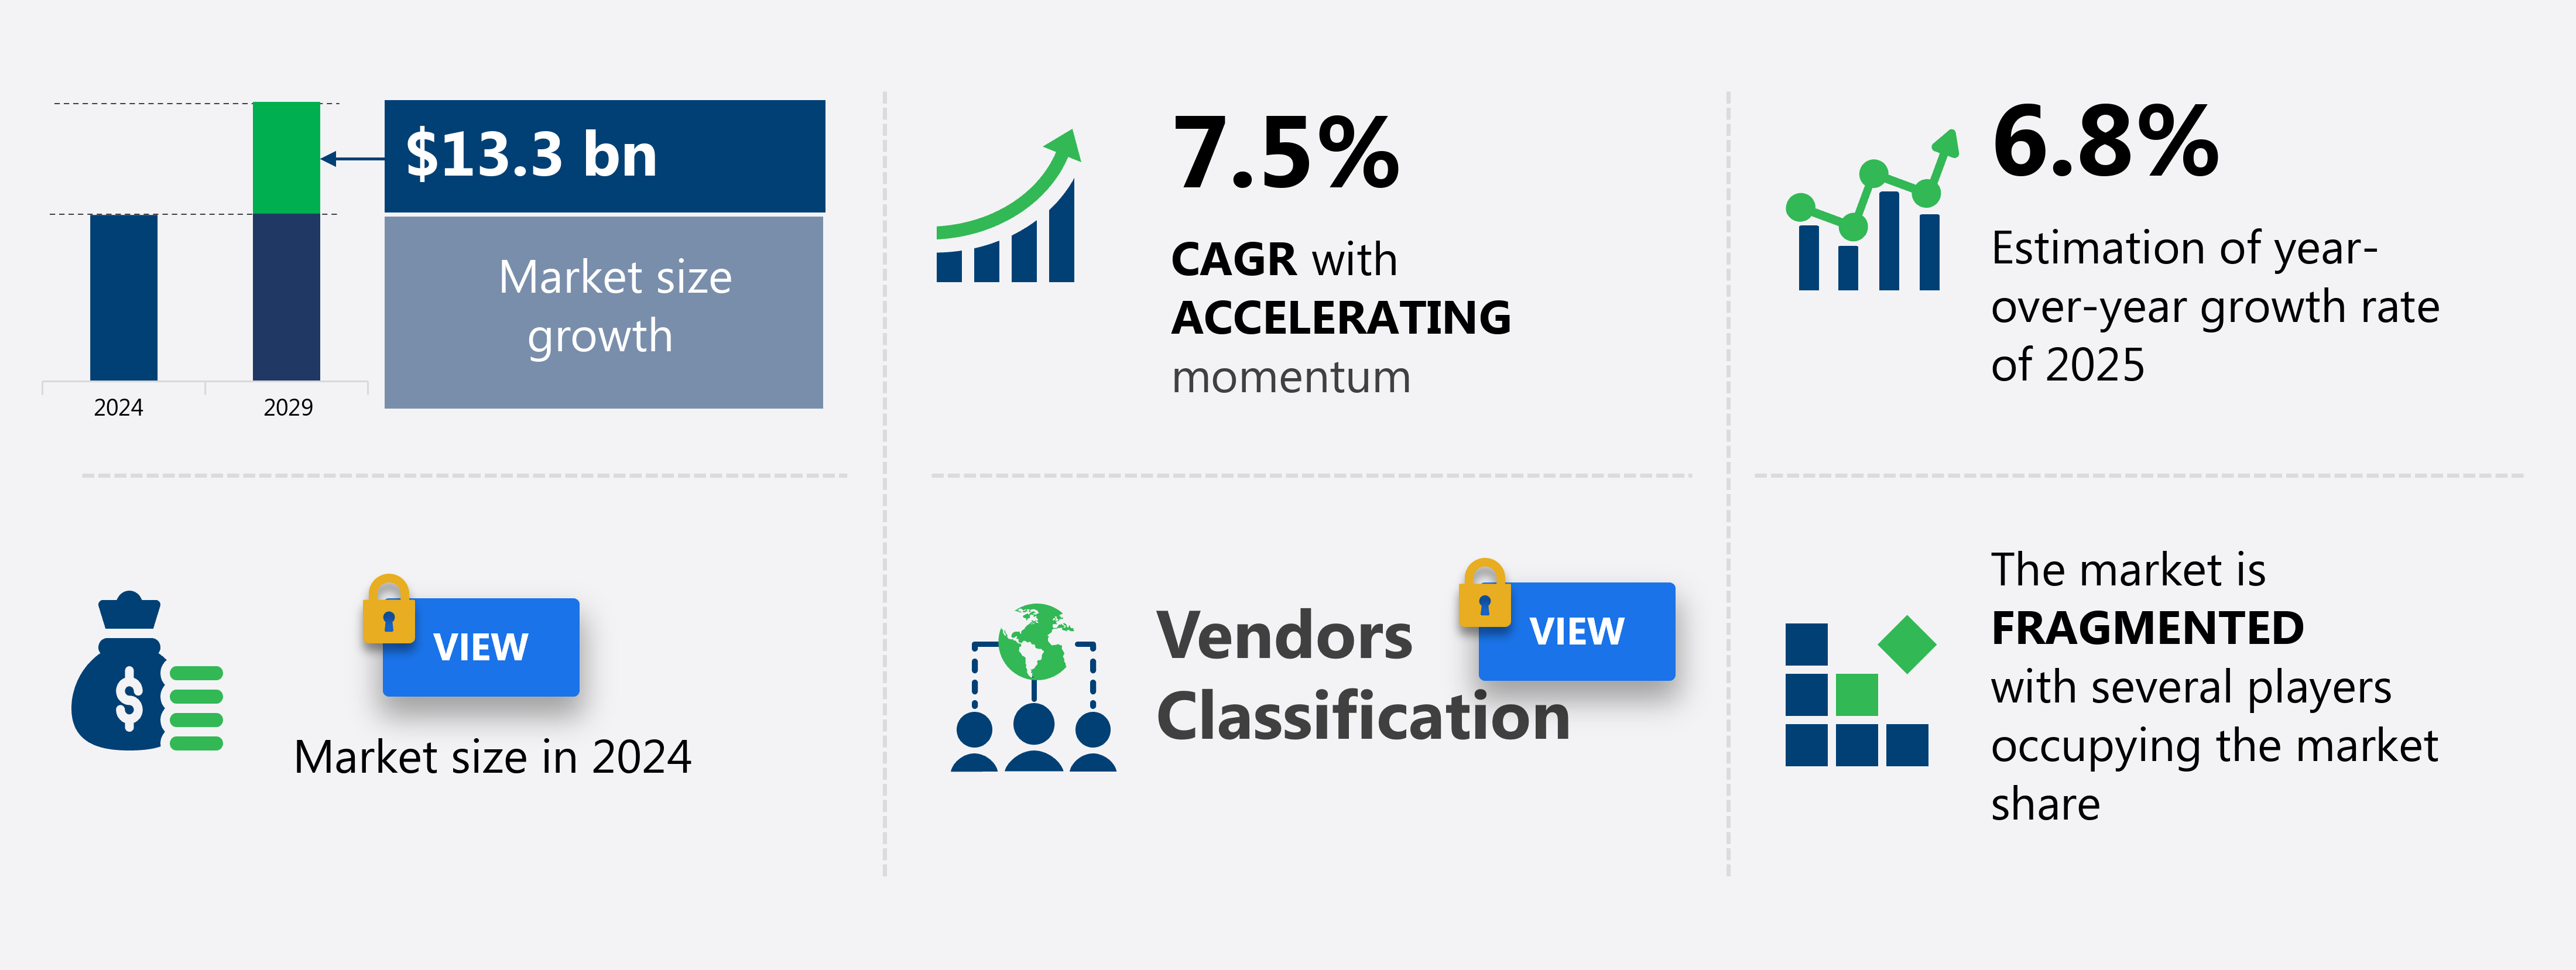
The HVAC equipment market size in North America is forecast to increase by USD 13.3 billion at a CAGR of 7.5% between 2024 and 2029.
-
The HVAC equipment market is experiencing significant growth, driven by the increasing demand for energy-efficient solutions in response to changing climate conditions. Smart HVAC systems, which offer enhanced energy management and improved indoor air quality, are gaining popularity among businesses and homeowners alike. Cooling towers and dehumidification systems are essential for industrial applications, while ground-source and air-source heat pumps cater to residential and commercial markets.
-
As the industry continues to evolve, staying informed about these trends and challenges is essential for businesses seeking to capitalize on the opportunities presented by the HVAC equipment market. However, the market faces challenges, including the shortage of skilled labor, which can hinder installation and maintenance processes. Additionally, regulatory compliance and the integration of renewable energy sources into HVAC systems are key considerations for market participants.
What will be the Size of the market During the Forecast Period?
-
The HVAC equipment market encompasses a range of technologies, including humidification systems and air filters, that enhance indoor air quality and comfort. Market trends reveal a shift towards energy efficiency, with the increasing adoption of R410A and R454B refrigerants in place of R134a. Performance monitoring, zone control, and fan coil units are gaining popularity, enabling businesses to optimize energy usage and reduce costs. Air filters, such as HEPA filters, play a crucial role in maintaining indoor air quality. Advanced technologies, like capillary tubes and damper actuators, facilitate efficient system operation.
-
Energy audits and HVAC inspections ensure system performance and identify potential energy savings. Mini-split systems and high-velocity systems offer flexible zoning solutions for businesses, while remote control, mobile app control, cloud-based management, and smart home integration enhance user convenience. UV air purifiers provide additional air quality benefits, contributing to overall system effectiveness.
-
The HVAC Equipment Market in North America is witnessing substantial growth, driven by advancements in energy efficiency and increasing demand for climate control solutions. Central air conditioning remains a staple for residential and commercial spaces, while residential refrigeration technology continues to evolve with sustainability in mind. Consumers now prioritize SEER ratings and HSPF ratings to ensure optimal performance and energy savings. The market also thrives on service and repair offerings, alongside seamless installation and commissioning of new systems. Innovative solutions such as geothermal HVAC are gaining traction for their eco-friendly benefits. Enhanced vibration control techniques improve equipment longevity, and the availability of parts and supplies ensures smooth maintenance operations.
How is this market segmented and which is the largest segment?
The market research report provides comprehensive data (region-wise segment analysis), with forecasts and estimates in "USD billion" for the period 2025-2029, as well as historical data from 2019-2023 for the following segments.
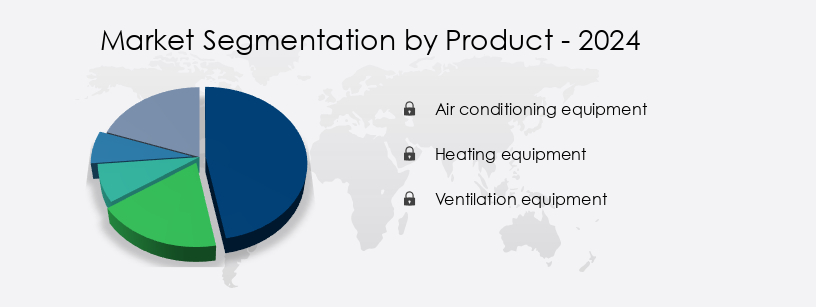
- Product
- Air conditioning equipment
- Heating equipment
- Ventilation equipment
- End-user
- Non-residential
- Residential
- Application
- New construction
- Renovation and retrofitting
- Industrial processes
- Geography
- North America
- US
- Canada
- Mexico
- North America
By Product Insights
- The air conditioning equipment segment is estimated to witness significant growth during the forecast period. The HVAC equipment market encompasses a range of systems and components, including air conditioners, heat pumps, and commercial refrigeration, evaluated based on energy efficiency ratings such as SEER and HSPF. Compliance with these ratings is mandatory for new equipment sales. Building codes and safety standards also influence HVAC design, from air flow and pressure control to temperature and humidity regulation. Renewable energy integration and building automation are emerging trends, with IoT and data analytics driving system optimization and performance. HVAC systems include rooftop units, split systems, and packaged units, requiring installation, commissioning, and maintenance contracts.
- Manufacturing processes prioritize material selection, fan speed, and noise reduction. HVAC contractors and distributors play crucial roles in system design and implementation. Energy codes and ASHRAE standards ensure building performance and indoor air quality. Geothermal and solar HVAC, as well as ventilation systems, contribute to energy efficiency and sustainability. HVAC components include refrigerant lines, expansion valves, and condensing units, requiring testing and certification for safety and efficiency. Overall, the HVAC market is driven by increasing urbanization and the need for temperature control and comfort in various sectors.
Get a glance at the market report of share of various segments Request Free Sample
Market Dynamics
Our North America HVAC Equipment Market researchers analyzed the data with 2024 as the base year, along with the key drivers, trends, and challenges. A holistic analysis of drivers will help companies refine their marketing strategies to gain a competitive advantage.
What are the key market drivers leading to the rise in adoption of North America HVAC Equipment Market?
-
Changing climate condition is the key driver of the market. The market witnessed notable growth in 2024 due to the increasing global temperature levels and extreme weather events. The rise in atmospheric carbon dioxide (CO2) levels, which reached an average concentration of 427 ppm, a 3.58 parts per million (ppm) increase from the previous year, significantly contributed to this trend. This rise in CO2 levels is a result of various factors, including continued fossil fuel emissions, widespread wildfires, and the effects of the El Nino climate pattern. In response to these environmental challenges, the demand for energy-efficient HVAC systems, such as green building-certified ductless systems, heat pumps, and air filtration systems, has increased.
-
HVAC distributors are focusing on quality control, noise reduction, and energy codes to meet the evolving market needs. Manufacturing processes and material selection are being optimized to enhance fan speed and cooling tower performance while ensuring testing and certification for energy efficiency and air quality. Condensing units and heat exchangers are being designed with advanced technologies to improve indoor air quality and reduce energy consumption. HVAC manufacturers are investing in research and development to create more efficient and sustainable HVAC systems, while also adhering to stringent testing and certification standards. This focus on innovation and sustainability is expected to drive the growth of the HVAC equipment market in the coming years.
What are the market trends shaping the North America HVAC Equipment Market?
-
Smart HVAC equipment is the upcoming trend in the market. HVAC systems have evolved with the integration of Internet of Things (IoT) technology, transforming traditional building automation systems. IoT networks connect various HVAC components and devices, enabling remote management and data collection. This technology stack empowers users to control appliances such as lights and heaters from anywhere. By combining devices with automated systems, data is generated and actions are initiated in real-time. Pressure control, energy efficiency, and safety standards are crucial market dynamics in the HVAC industry.
-
Air purification systems and data analytics further enhance the functionality of HVAC systems. Refrigerant lines and expansion valves are essential components that require precise control for optimal performance. Packaged units offer flexibility and ease of installation. Overall, the integration of IoT technology in HVAC systems offers numerous benefits, including improved air flow, energy savings, and enhanced safety features. Smart HVAC systems prioritize these factors, utilizing energy-efficient rooftop units, optimizing ventilation rates, and adhering to safety regulations. Ul certifications ensure safety and compliance with building codes.
What challenges does North America HVAC Equipment Market face during the growth?
-
Shortage of skilled labor is a key challenge affecting the market growth. The HVAC market in North America is experiencing significant growth, driven by the adoption of advanced technologies such as smart HVAC systems, building automation, and renewable energy integration. Commercial refrigeration, air handling units, and refrigeration systems are among the key product segments witnessing robust demand. However, the industry faces a major challenge in the form of a labor shortage. According to the US Bureau of Labor Statistics, the HVAC technician shortage is estimated to be around 70,000. This shortage can be attributed to several factors, including an aging workforce and a decline in the number of young people pursuing trades.
-
As a result, HVAC businesses are under pressure to meet increasing service calls, scheduling demands, and parts orders, while also addressing operational challenges. To mitigate these issues, companies are focusing on building performance optimization, temperature control, and comfort levels through the implementation of control systems and SEER and HSPF rating standards. The market is also witnessing a trend towards energy efficiency and sustainability, with a growing emphasis on thermal comfort and building automation. Overall, the HVAC industry is at a pivotal point, requiring innovative solutions and strategies to address the labor shortage and meet evolving customer needs.
Exclusive Customer Landscape
The market forecasting report includes the adoption lifecycle of the market, covering from the innovator's stage to the laggard's stage. It focuses on adoption rates in different regions based on penetration. Furthermore, the market report also includes key purchase criteria and drivers of price sensitivity to help companies evaluate and develop their market growth analysis strategies.

Customer Landscape
Key Companies & Market Insights
Companies are implementing various strategies, such as strategic alliances, market forecast, partnerships, mergers and acquisitions, geographical expansion, and product/service launches, to enhance their presence in the market.
A. O. Smith Corp. - The company specializes in providing advanced HVAC solutions, encompassing both residential and commercial water heaters and boilers.
The market research and growth report includes detailed analyses of the competitive landscape of the market and information about key companies, including:
- A. O. Smith Corp.
- AAON Inc.
- Daikin Industries Ltd.
- Electrolux Group
- Emerson Electric Co.
- Fujitsu Ltd.
- Haier Smart Home Co. Ltd.
- Hitachi Ltd.
- Ingersoll Rand Inc.
- Johnson Controls International Plc
- Lennox International Inc.
- LG Corp.
- MIDEA Group Co. Ltd.
- Nortek
- Rheem Manufacturing Co.
- Robert Bosch GmbH
- Samsung Electronics Co. Ltd.
- Seeley International Pty Ltd.
- Whirlpool Corp.
Qualitative and quantitative analysis of companies has been conducted to help clients understand the wider business environment as well as the strengths and weaknesses of key market players. Data is qualitatively analyzed to categorize companies as pure play, category-focused, industry-focused, and diversified; it is quantitatively analyzed to categorize companies as dominant, leading, strong, tentative, and weak.
Recent Development and News in HVAC Equipment Market In North America
- In January 2023, Carrier Global Corporation, a leading HVAC market player, announced the launch of its new AquaEdge 19DV centrifugal chiller, which boasts a 19% improvement in energy efficiency compared to its previous model. This innovation is expected to significantly reduce operational costs for commercial and industrial clients (Carrier Global Corporation, 2023).
- In March 2024, Johnson Controls, another major HVAC player, entered into a strategic partnership with Google to integrate Google's Energy Management Information System (EMIS) with Johnson Controls' Metasys building automation platform. This collaboration aims to enhance energy efficiency and optimize HVAC system performance for commercial buildings (Johnson Controls, 2024).
- In July 2024, LG Electronics acquired Danfoss' heating business, marking a significant expansion into the HVAC market for LG. The acquisition includes Danfoss' product portfolio, manufacturing facilities, and 3,000 employees. This move is expected to strengthen LG's presence in the European HVAC market (Danfoss, 2024).
Research Analyst Overview
The HVAC equipment market continues to evolve, driven by advancements in technology and shifting market dynamics. Green building initiatives have gained significant traction, leading to increased demand for energy-efficient solutions such as heat pumps and ductless systems. Indoor air quality is another key area of focus, with air filtration and purification systems becoming essential components of HVAC systems. Ductless systems, with their energy efficiency and flexibility, are increasingly being adopted in both residential and commercial sectors. Manufacturers are continually refining their manufacturing processes and material selection to improve product performance and reduce noise levels. Quality control measures, including testing and certification by organizations like UL, are crucial in ensuring product reliability and safety.
HVAC distributors play a vital role in the market, providing essential supplies and services to contractors and end-users. Energy codes and building codes continue to evolve, driving the need for higher energy efficiency and improved temperature control. Condensing units and cooling towers are being optimized for better performance and reduced water usage. Advancements in technology are also transforming the market. IoT integration and data analytics are enabling building performance optimization and predictive maintenance. Smart HVAC systems offer improved temperature control, comfort levels, and pressure control. Heat pumps, evaporative coolers, and solar HVAC are gaining popularity as renewable energy sources. The market's continuous dynamism is reflected in the ongoing development of new HVAC technologies and applications.
From fan speed optimization to humidity control, HVAC systems are becoming more sophisticated and efficient, meeting the evolving needs of various sectors. The future of the HVAC equipment market is bright, with innovation and sustainability at its core. The HVAC Equipment Market in North America is expanding as consumers seek efficient and sustainable climate control solutions. Groundsource heat pumps are gaining popularity for their energy-saving benefits, providing reliable heating and cooling with minimal environmental impact. Meanwhile, multizone systems are revolutionizing comfort by allowing precise temperature control across different areas within residential and commercial spaces. As technology advances, innovations like the capillary tube play a crucial role in optimizing refrigeration performance, enhancing efficiency, and reducing overall energy consumption.
|
Market Scope |
|
|
Report Coverage |
Details |
|
Page number |
192 |
|
Base year |
2024 |
|
Historic period |
2019-2023 |
|
Forecast period |
2025-2029 |
|
Growth momentum & CAGR |
Accelerate at a CAGR of 7.5% |
|
Market growth 2025-2029 |
USD 13.3 billion |
|
Market structure |
Fragmented |
|
YoY growth 2024-2025(%) |
6.8 |
|
Key countries |
US, Canada, and Mexico |
|
Competitive landscape |
Leading Companies, Market Positioning of Companies, Competitive Strategies, and Industry Risks |
What are the Key Data Covered in this Market Research and Growth Report?
- CAGR of the market during the forecast period
- Detailed information on factors that will drive the market growth and forecasting between 2025 and 2029
- Precise estimation of the size of the market and its contribution of the market in focus to the parent market
- Accurate predictions about upcoming market growth and trends and changes in consumer behaviour
- Growth of the market across North America
- Thorough analysis of the market's competitive landscape and detailed information about companies
- Comprehensive analysis of factors that will challenge the growth of market companies
We can help! Our analysts can customize this market research report to meet your requirements. Get in touch
 RIA -
RIA - 
