Hybrid Operating Room Market Analysis, Size, and Forecast 2026-2030: North America (US, Canada, and Mexico), Europe (Germany, UK, and France), APAC (China, Japan, and India), South America (Brazil, Argentina, and Colombia), Middle East and Africa (South Africa, Saudi Arabia, and UAE), Asia, Rest of World (ROW)

Hybrid Operating Room Market Analysis, Size, and Forecast 2026-2030:
North America (US, Canada, and Mexico), Europe (Germany, UK, and France), APAC (China, Japan, and India), South America (Brazil, Argentina, and Colombia), Middle East and Africa (South Africa, Saudi Arabia, and UAE), Asia, Rest of World (ROW)

Published: Jan 2026 293 Pages SKU: IRTNTR72111

Market Overview at a Glance

$2.58 B
Market Opportunity
13.1%
CAGR 2025 - 2030
41%
North America Growth
$1.53 B
Minimally invasive surgery segment 2024

Hybrid Operating Room Market Size 2026-2030

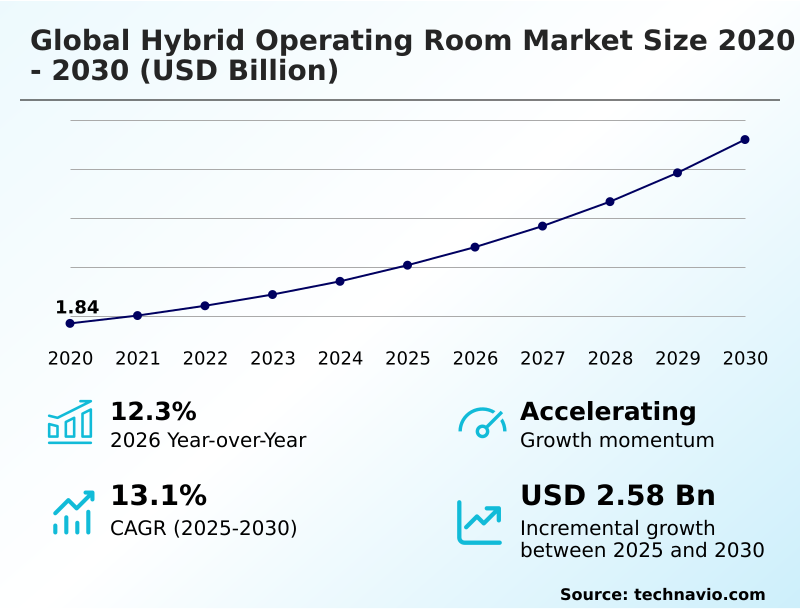
The hybrid operating room market size is valued to increase by USD 2.58 billion, at a CAGR of 13.1% from 2025 to 2030. Increasing adoption of minimally invasive surgical procedures will drive the hybrid operating room market.

Major Market Trends & Insights

  • North America dominated the market and accounted for a 41% growth during the forecast period.
  • By Application - Minimally invasive surgery segment was valued at USD 1.53 billion in 2024
  • By End-user - Hospitals segment accounted for the largest market revenue share in 2024

Market Size & Forecast

  • Market Opportunities: USD 3.77 billion
  • Market Future Opportunities: USD 2.58 billion
  • CAGR from 2025 to 2030 : 13.1%

Market Summary

  • The hybrid operating room market is characterized by the convergence of advanced surgical capabilities and high-precision diagnostic imaging within a single, sterile environment. This integration is crucial for performing complex procedures across cardiovascular surgery, neurosurgery, and trauma care.
  • The market's momentum is fueled by the growing adoption of minimally invasive surgery, which relies on technologies like image-guided therapy and surgical visualization platforms for enhanced procedural accuracy and patient safety. Integrated healthcare solutions are enabling multidisciplinary clinical teams to collaborate more effectively, using digital workflow tools for real-time intraoperative guidance and data coordination.
  • A key business application involves optimizing capital equipment investment by creating versatile suites that can handle a wide range of high-acuity surgical procedures, thereby improving resource utilization and reducing the need for separate diagnostic and surgical spaces. This approach not only improves surgical efficiency but also aligns with value-based care models by shortening recovery times and improving clinical outcomes.
  • The sophisticated nature of operating theater technology, from angiography systems to robotic-assisted surgery systems, continues to push the boundaries of what is possible in modern medicine, driving ongoing innovation in advanced operating environments.

What will be the Size of the Hybrid Operating Room Market during the forecast period?

Get Key Insights on Market Forecast (PDF) Request Free Sample

How is the Hybrid Operating Room Market Segmented?

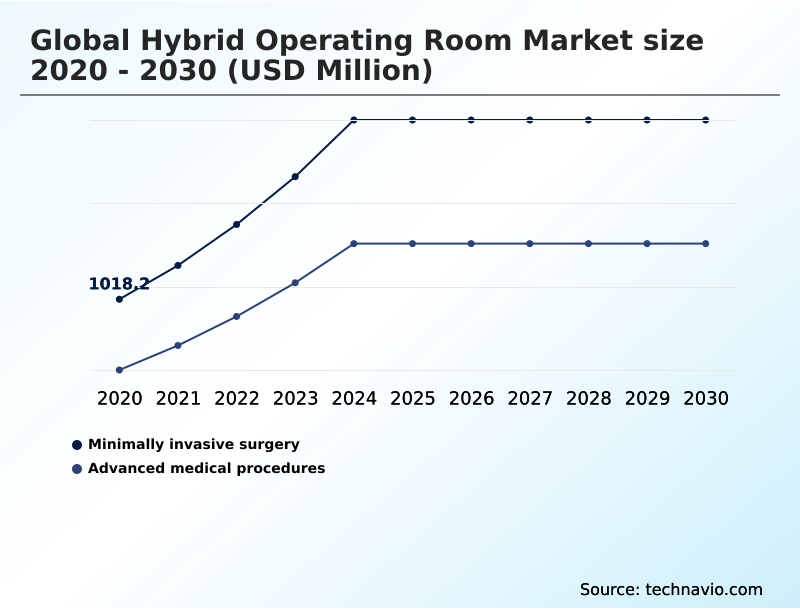
The hybrid operating room industry research report provides comprehensive data (region-wise segment analysis), with forecasts and estimates in "USD million" for the period 2026-2030, as well as historical data from 2020-2024 for the following segments.

  • Application
    • Minimally invasive surgery
    • Advanced medical procedures
  • End-user
    • Hospitals
    • Ambulatory surgical centers
  • Component
    • Intraoperative imaging systems
    • Operating room fixtures
    • OR integration and display systems
    • Others
  • Geography
    • North America
      • US
      • Canada
      • Mexico
    • Europe
      • Germany
      • UK
      • France
    • Asia
    • Rest of World (ROW)

By Application Insights

The minimally invasive surgery segment is estimated to witness significant growth during the forecast period.

The market is significantly shaped by the demand for high-acuity surgical procedures that necessitate sophisticated technological integration. The use of intraoperative imaging systems and advanced surgical visualization platforms provides real time intraoperative guidance, which is critical for enhancing surgical visibility.

Effective diagnostic imaging integration and intraoperative data coordination are achieved through advanced medical display systems and specialized clinical workflow tools.

This commitment to workflow optimization results in measurable performance gains, including a reduction in diagnostic errors by over 15%, solidifying the value of these integrated solutions.

Request Free Sample

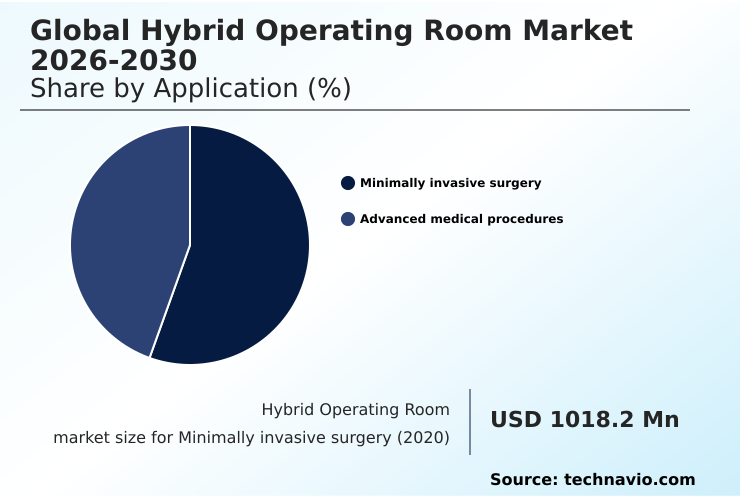
The Minimally invasive surgery segment was valued at USD 1.53 billion in 2024 and showed a gradual increase during the forecast period.

Request Free Sample

Regional Analysis

North America is estimated to contribute 41% to the growth of the global market during the forecast period.Technavio’s analysts have elaborately explained the regional trends and drivers that shape the market during the forecast period.

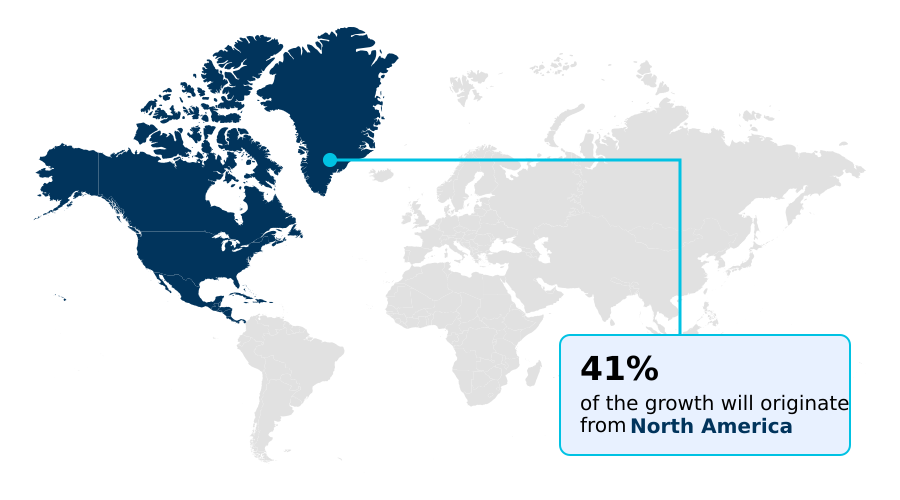
See How Hybrid Operating Room Market Demand is Rising in North America Request Free Sample

North America commands the largest market share, accounting for over 40% of activity, driven by high investment in advanced operating environments. This region sees extensive use of angiography systems and computed tomography platforms, especially in cardiovascular surgery and neurosurgery.

In contrast, the Asia region is exhibiting the fastest growth, with a CAGR over 13%, as healthcare systems there expand capabilities in orthopedic procedures and image-guided surgery.

The adoption of endoscopy imaging systems and precision motion control systems is rising globally, supporting multidisciplinary clinical teams and complex interventions.

Market Dynamics

Our researchers analyzed the data with 2025 as the base year, along with the key drivers, trends, and challenges. A holistic analysis of drivers will help companies refine their marketing strategies to gain a competitive advantage.

  • Strategic decision-making in the hybrid operating room market is increasingly focused on specialized applications and optimizing return on investment. The cost-benefit analysis of hybrid operating rooms is a central concern for hospital administrators, who must balance high initial outlays with long-term efficiency gains. For clinical departments, the focus is on technical capabilities.
  • For instance, the hybrid operating room design for cardiology must accommodate specific workflows for transcatheter procedures, while data integration in hybrid neurosurgery suites is critical for real-time navigation. The rise of AI-powered surgical planning in hybrid OR is another key development, promising to automate and refine preoperative strategies.
  • The specifics of intraoperative imaging for complex spine surgery are also driving technology choices, favoring systems with superior articulation and lower radiation dose. As these facilities become more common, the robotic surgery workflow in hybrid environments is being standardized to maximize throughput and safety.
  • Hospitals implementing these integrated systems are reporting procedural setup times nearly 40% faster than facilities relying on conventional, separate imaging and surgical suites, demonstrating a clear operational advantage.

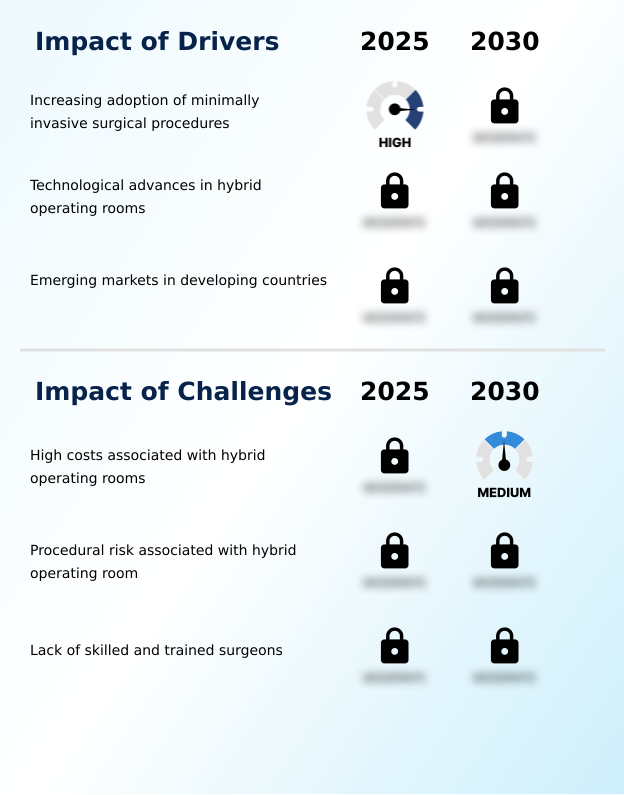
What are the key market drivers leading to the rise in the adoption of Hybrid Operating Room Industry?

  • The growing adoption of minimally invasive surgical procedures is a primary market driver, fostering demand for integrated and technologically advanced operating environments.

  • The increasing adoption of minimally invasive surgery is a primary driver, fueled by advances in image-guided therapy and interventional imaging technologies.
  • These capabilities, which allow for real-time imaging, are critical for complex procedures, enabling a more than 20% improvement in procedural accuracy. The use of advanced interventional surgical systems for image guided interventions facilitates diagnostic imaging integration within a single suite.
  • This streamlines surgical efficiency and promotes cross-departmental collaboration, reducing patient transfer times by up to 30% and optimizing hospital resource utilization.

What are the market trends shaping the Hybrid Operating Room Industry?

  • The rising adoption of robot-assisted surgeries is a notable market trend, driven by the continuous pursuit of greater surgical precision and improved patient outcomes.

  • The integration of robotic-assisted surgery systems is a defining trend, transforming procedures by improving surgical precision. This shift necessitates significant capital equipment investment but delivers substantial returns through workflow optimization and enhanced outcomes. The adoption of surgical navigation software and advanced patient monitoring systems is becoming standard, with facilities reporting up to a 15% reduction in procedural time.
  • Furthermore, video distribution platforms and digital workflow tools are creating integrated healthcare solutions that streamline data flow and improve team collaboration, pushing the boundaries of robotic surgery integration.

What challenges does the Hybrid Operating Room Industry face during its growth?

  • The substantial costs associated with the implementation and maintenance of hybrid operating rooms present a key challenge to widespread market adoption.

  • High capital equipment investment remains a significant challenge, particularly for facilities upgrading their operating theater technology. The installation of specialized operating room fixtures, modular ceiling infrastructure, and intraoperative magnetic resonance imaging systems requires substantial upfront costs. Ensuring a sterile surgical environment while integrating complex systems like anesthesia workstations and infection control systems adds another layer of complexity.
  • These factors can affect patient safety if not managed correctly, making the justification for investment in complex surgical interventions difficult for institutions facing budget constraints.

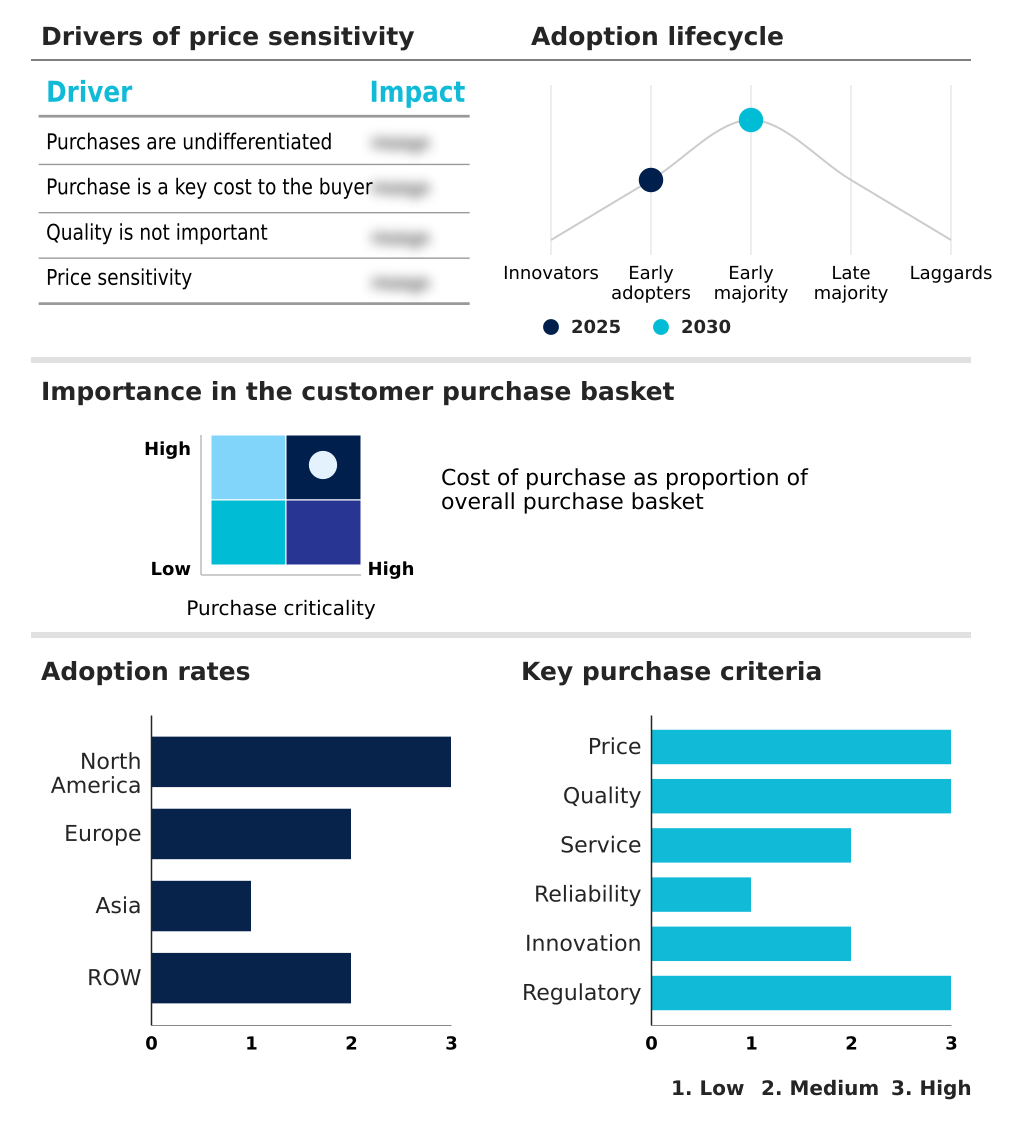
Exclusive Technavio Analysis on Customer Landscape

The hybrid operating room market forecasting report includes the adoption lifecycle of the market, covering from the innovator’s stage to the laggard’s stage. It focuses on adoption rates in different regions based on penetration. Furthermore, the hybrid operating room market report also includes key purchase criteria and drivers of price sensitivity to help companies evaluate and develop their market growth analysis strategies.

Customer Landscape of Hybrid Operating Room Industry

Competitive Landscape

Companies are implementing various strategies, such as strategic alliances, hybrid operating room market forecast, partnerships, mergers and acquisitions, geographical expansion, and product/service launches, to enhance their presence in the industry.

ALVO Ltd. Liability Co. Sp. k. - Offers integrated surgical lighting, controls, and modular ceilings for workflow optimization and enhanced visibility in advanced operating environments.

The industry research and growth report includes detailed analyses of the competitive landscape of the market and information about key companies, including:

  • ALVO Ltd. Liability Co. Sp. k.
  • Barco NV
  • Brainlab AG
  • Canon Medical Systems Corp.
  • Dragerwerk AG and Co. KGaA
  • GE Healthcare Technologies
  • Getinge AB
  • IMRIS Deerfield Imaging Inc.
  • KARL STORZ SE and Co. KG
  • Koninklijke Philips NV
  • Mediflex Surgical Products
  • Novanta Inc.
  • Nuvo Surgical
  • Siemens AG
  • SKYTRON LLC
  • STERIS plc
  • Stryker Corp.

Qualitative and quantitative analysis of companies has been conducted to help clients understand the wider business environment as well as the strengths and weaknesses of key industry players. Data is qualitatively analyzed to categorize companies as pure play, category-focused, industry-focused, and diversified; it is quantitatively analyzed to categorize companies as dominant, leading, strong, tentative, and weak.

Recent Development and News in Hybrid operating room market

  • In May 2025, the International Society for Minimally Invasive Cardiothoracic Surgery highlighted advancements in artificial intelligence applications within hybrid operating rooms, revolutionizing precision in cardiothoracic procedures.
  • In April 2025, Intuitive Surgical released research demonstrating that the introduction of robotic-assisted surgery systems significantly increased rates of minimally invasive procedures across US hospitals.
  • In April 2025, Long Island Jewish Medical Center opened a USD 6.1 million hybrid operating room, augmenting complex vascular surgeries with state-of-the-art technology to enhance precision and safety.
  • In March 2025, Texas Health Hospital Mansfield expanded its surgical services with a new hybrid operating room, integrating advanced imaging for both traditional and minimally invasive procedures.

Dive into Technavio’s robust research methodology, blending expert interviews, extensive data synthesis, and validated models for unparalleled Hybrid Operating Room Market insights. See full methodology.

Market Scope
Page number 293
Base year 2025
Historic period 2020-2024
Forecast period 2026-2030
Growth momentum & CAGR Accelerate at a CAGR of 13.1%
Market growth 2026-2030 USD 2577.5 million
Market structure Fragmented
YoY growth 2025-2026(%) 12.3%
Key countries US, Canada, Mexico, Germany, UK, France, Italy, Spain, The Netherlands, China, Japan, India, South Korea, Indonesia, Vietnam, Brazil, Argentina, South Africa, Saudi Arabia, UAE, Egypt, Turkey and Colombia
Competitive landscape Leading Companies, Market Positioning of Companies, Competitive Strategies, and Industry Risks

Request Free Sample

Research Analyst Overview

  • The hybrid operating room market is defined by the sophisticated integration of advanced technologies designed to enhance surgical decision-making and procedural outcomes. Core to this ecosystem are intraoperative imaging systems, including angiography systems and computed tomography platforms, which provide real-time imaging during image guided interventions.
  • These are complemented by surgical visualization platforms and advanced medical display systems, which facilitate intraoperative data coordination among clinical teams. Boardroom decisions increasingly center on standardizing these digital workflow tools to improve efficiency. For example, facilities adopting fully integrated surgical navigation software have achieved a 30% reduction in procedural planning time.
  • The physical environment is equally critical, with operating room fixtures and modular ceiling infrastructure designed to support everything from endoscopy imaging systems to intraoperative magnetic resonance imaging. This holistic approach, encompassing anesthesia workstations, infection control systems, and patient monitoring systems, ensures that these advanced interventional surgical systems operate with maximum precision and safety.

What are the Key Data Covered in this Hybrid Operating Room Market Research and Growth Report?

  • What is the expected growth of the Hybrid Operating Room Market between 2026 and 2030?

    • USD 2.58 billion, at a CAGR of 13.1%

  • What segmentation does the market report cover?

    • The report is segmented by Application (Minimally invasive surgery, and Advanced medical procedures), End-user (Hospitals, and Ambulatory surgical centers), Component (Intraoperative imaging systems, Operating room fixtures, OR integration and display systems, and Others) and Geography (North America, Europe, Asia, Rest of World (ROW))

  • Which regions are analyzed in the report?

    • North America, Europe, Asia and Rest of World (ROW)

  • What are the key growth drivers and market challenges?

    • Increasing adoption of minimally invasive surgical procedures, High costs associated with hybrid operating rooms

  • Who are the major players in the Hybrid Operating Room Market?

    • ALVO Ltd. Liability Co. Sp. k., Barco NV, Brainlab AG, Canon Medical Systems Corp., Dragerwerk AG and Co. KGaA, GE Healthcare Technologies, Getinge AB, IMRIS Deerfield Imaging Inc., KARL STORZ SE and Co. KG, Koninklijke Philips NV, Mediflex Surgical Products, Novanta Inc., Nuvo Surgical, Siemens AG, SKYTRON LLC, STERIS plc and Stryker Corp.

Market Research Insights

  • The market dynamic is heavily influenced by the push for integrated healthcare solutions that facilitate cross-departmental collaboration and enhance surgical precision. The adoption of these advanced operating environments for minimally invasive surgery has been shown to reduce post-operative complication rates by up to 20%.
  • As healthcare providers focus on workflow optimization, these systems improve surgical efficiency, leading to a 15% reduction in average procedure times. This focus on efficiency is critical for justifying capital equipment investment in high-acuity surgical procedures, where improved patient safety and outcomes are paramount.
  • The ability to perform complex surgical interventions in fields like neurosurgery and trauma care within a single suite is transforming operating theater technology.

We can help! Our analysts can customize this hybrid operating room market research report to meet your requirements.

Get in touch

1. Executive Summary

1.1 Market overview

Executive Summary - Chart on Market Overview
Executive Summary - Data Table on Market Overview
Executive Summary - Chart on Global Market Characteristics
Executive Summary - Chart on Market by Geography
Executive Summary - Chart on Market Segmentation by Application
Executive Summary - Chart on Market Segmentation by End-user
Executive Summary - Chart on Market Segmentation by Component
Executive Summary - Chart on Incremental Growth
Executive Summary - Data Table on Incremental Growth
Executive Summary - Chart on Company Market Positioning

2. Technavio Analysis

2.1 Analysis of price sensitivity, lifecycle, customer purchase basket, adoption rates, and purchase criteria

2.2 Criticality of inputs and Factors of differentiation

Chart on Overview on criticality of inputs and factors of differentiation

2.3 Factors of disruption

Chart on Overview on factors of disruption

2.4 Impact of drivers and challenges

Chart on Impact of drivers and challenges in 2025 and 2030

3. Market Landscape

3.1 Market ecosystem

Chart on Parent Market
Data Table on - Parent Market

3.2 Market characteristics

Chart on Market characteristics analysis

3.3 Value chain analysis

Chart on Value chain analysis

4. Market Sizing

4.1 Market definition

Data Table on Offerings of companies included in the market definition

4.2 Market segment analysis

Market segments

4.3 Market size 2025

4.4 Market outlook: Forecast for 2025-2030

Chart on Global - Market size and forecast 2025-2030 ($ million)
Data Table on Global - Market size and forecast 2025-2030 ($ million)
Chart on Global Market: Year-over-year growth 2025-2030 (%)
Data Table on Global Market: Year-over-year growth 2025-2030 (%)

5. Historic Market Size

5.1 Global Hybrid Operating Room Market 2020 - 2024

Historic Market Size - Data Table on Global Hybrid Operating Room Market 2020 - 2024 ($ million)

5.2 Application segment analysis 2020 - 2024

Historic Market Size - Application Segment 2020 - 2024 ($ million)

5.3 End-user segment analysis 2020 - 2024

Historic Market Size - End-user Segment 2020 - 2024 ($ million)

5.4 Component segment analysis 2020 - 2024

Historic Market Size - Component Segment 2020 - 2024 ($ million)

5.5 Geography segment analysis 2020 - 2024

Historic Market Size - Geography Segment 2020 - 2024 ($ million)

5.6 Country segment analysis 2020 - 2024

Historic Market Size - Country Segment 2020 - 2024 ($ million)

6. Qualitative Analysis

6.1 Impact of AI in Global Hybrid Operating Room Market

7. Five Forces Analysis

7.1 Five forces summary

Five forces analysis - Comparison between 2025 and 2030

7.2 Bargaining power of buyers

Bargaining power of buyers - Impact of key factors 2025 and 2030

7.3 Bargaining power of suppliers

Bargaining power of suppliers - Impact of key factors in 2025 and 2030

7.4 Threat of new entrants

Threat of new entrants - Impact of key factors in 2025 and 2030

7.5 Threat of substitutes

Threat of substitutes - Impact of key factors in 2025 and 2030

7.6 Threat of rivalry

Threat of rivalry - Impact of key factors in 2025 and 2030

7.7 Market condition

Chart on Market condition - Five forces 2025 and 2030

8. Market Segmentation by Application

8.1 Market segments

Chart on Application - Market share 2025-2030 (%)
Data Table on Application - Market share 2025-2030 (%)

8.2 Comparison by Application

Chart on Comparison by Application
Data Table on Comparison by Application

8.3 Minimally invasive surgery - Market size and forecast 2025-2030

Chart on Minimally invasive surgery - Market size and forecast 2025-2030 ($ million)
Data Table on Minimally invasive surgery - Market size and forecast 2025-2030 ($ million)
Chart on Minimally invasive surgery - Year-over-year growth 2025-2030 (%)
Data Table on Minimally invasive surgery - Year-over-year growth 2025-2030 (%)

8.4 Advanced medical procedures - Market size and forecast 2025-2030

Chart on Advanced medical procedures - Market size and forecast 2025-2030 ($ million)
Data Table on Advanced medical procedures - Market size and forecast 2025-2030 ($ million)
Chart on Advanced medical procedures - Year-over-year growth 2025-2030 (%)
Data Table on Advanced medical procedures - Year-over-year growth 2025-2030 (%)

8.5 Market opportunity by Application

Market opportunity by Application ($ million)
Data Table on Market opportunity by Application ($ million)

9. Market Segmentation by End-user

9.1 Market segments

Chart on End-user - Market share 2025-2030 (%)
Data Table on End-user - Market share 2025-2030 (%)

9.2 Comparison by End-user

Chart on Comparison by End-user
Data Table on Comparison by End-user

9.3 Hospitals - Market size and forecast 2025-2030

Chart on Hospitals - Market size and forecast 2025-2030 ($ million)
Data Table on Hospitals - Market size and forecast 2025-2030 ($ million)
Chart on Hospitals - Year-over-year growth 2025-2030 (%)
Data Table on Hospitals - Year-over-year growth 2025-2030 (%)

9.4 Ambulatory surgical centers - Market size and forecast 2025-2030

Chart on Ambulatory surgical centers - Market size and forecast 2025-2030 ($ million)
Data Table on Ambulatory surgical centers - Market size and forecast 2025-2030 ($ million)
Chart on Ambulatory surgical centers - Year-over-year growth 2025-2030 (%)
Data Table on Ambulatory surgical centers - Year-over-year growth 2025-2030 (%)

9.5 Market opportunity by End-user

Market opportunity by End-user ($ million)
Data Table on Market opportunity by End-user ($ million)

10. Market Segmentation by Component

10.1 Market segments

Chart on Component - Market share 2025-2030 (%)
Data Table on Component - Market share 2025-2030 (%)

10.2 Comparison by Component

Chart on Comparison by Component
Data Table on Comparison by Component

10.3 Intraoperative imaging systems - Market size and forecast 2025-2030

Chart on Intraoperative imaging systems - Market size and forecast 2025-2030 ($ million)
Data Table on Intraoperative imaging systems - Market size and forecast 2025-2030 ($ million)
Chart on Intraoperative imaging systems - Year-over-year growth 2025-2030 (%)
Data Table on Intraoperative imaging systems - Year-over-year growth 2025-2030 (%)

10.4 Operating room fixtures - Market size and forecast 2025-2030

Chart on Operating room fixtures - Market size and forecast 2025-2030 ($ million)
Data Table on Operating room fixtures - Market size and forecast 2025-2030 ($ million)
Chart on Operating room fixtures - Year-over-year growth 2025-2030 (%)
Data Table on Operating room fixtures - Year-over-year growth 2025-2030 (%)

10.5 OR integration and display systems - Market size and forecast 2025-2030

Chart on OR integration and display systems - Market size and forecast 2025-2030 ($ million)
Data Table on OR integration and display systems - Market size and forecast 2025-2030 ($ million)
Chart on OR integration and display systems - Year-over-year growth 2025-2030 (%)
Data Table on OR integration and display systems - Year-over-year growth 2025-2030 (%)

10.6 Others - Market size and forecast 2025-2030

Chart on Others - Market size and forecast 2025-2030 ($ million)
Data Table on Others - Market size and forecast 2025-2030 ($ million)
Chart on Others - Year-over-year growth 2025-2030 (%)
Data Table on Others - Year-over-year growth 2025-2030 (%)

10.7 Market opportunity by Component

Market opportunity by Component ($ million)
Data Table on Market opportunity by Component ($ million)

11. Customer Landscape

11.1 Customer landscape overview

Analysis of price sensitivity, lifecycle, customer purchase basket, adoption rates, and purchase criteria

12. Geographic Landscape

12.1 Geographic segmentation

Chart on Market share by geography 2025-2030 (%)
Data Table on Market share by geography 2025-2030 (%)

12.2 Geographic comparison

Chart on Geographic comparison
Data Table on Geographic comparison

12.3 North America - Market size and forecast 2025-2030

Chart on North America - Market size and forecast 2025-2030 ($ million)
Data Table on North America - Market size and forecast 2025-2030 ($ million)
Chart on North America - Year-over-year growth 2025-2030 (%)
Data Table on North America - Year-over-year growth 2025-2030 (%)
Chart on Regional Comparison - North America
Data Table on Regional Comparison - North America

12.3.1 US - Market size and forecast 2025-2030

Chart on US - Market size and forecast 2025-2030 ($ million)
Data Table on US - Market size and forecast 2025-2030 ($ million)
Chart on US - Year-over-year growth 2025-2030 (%)
Data Table on US - Year-over-year growth 2025-2030 (%)

12.3.2 Canada - Market size and forecast 2025-2030

Chart on Canada - Market size and forecast 2025-2030 ($ million)
Data Table on Canada - Market size and forecast 2025-2030 ($ million)
Chart on Canada - Year-over-year growth 2025-2030 (%)
Data Table on Canada - Year-over-year growth 2025-2030 (%)

12.3.3 Mexico - Market size and forecast 2025-2030

Chart on Mexico - Market size and forecast 2025-2030 ($ million)
Data Table on Mexico - Market size and forecast 2025-2030 ($ million)
Chart on Mexico - Year-over-year growth 2025-2030 (%)
Data Table on Mexico - Year-over-year growth 2025-2030 (%)

12.4 Europe - Market size and forecast 2025-2030

Chart on Europe - Market size and forecast 2025-2030 ($ million)
Data Table on Europe - Market size and forecast 2025-2030 ($ million)
Chart on Europe - Year-over-year growth 2025-2030 (%)
Data Table on Europe - Year-over-year growth 2025-2030 (%)
Chart on Regional Comparison - Europe
Data Table on Regional Comparison - Europe

12.4.1 Germany - Market size and forecast 2025-2030

Chart on Germany - Market size and forecast 2025-2030 ($ million)
Data Table on Germany - Market size and forecast 2025-2030 ($ million)
Chart on Germany - Year-over-year growth 2025-2030 (%)
Data Table on Germany - Year-over-year growth 2025-2030 (%)

12.4.2 UK - Market size and forecast 2025-2030

Chart on UK - Market size and forecast 2025-2030 ($ million)
Data Table on UK - Market size and forecast 2025-2030 ($ million)
Chart on UK - Year-over-year growth 2025-2030 (%)
Data Table on UK - Year-over-year growth 2025-2030 (%)

12.4.3 France - Market size and forecast 2025-2030

Chart on France - Market size and forecast 2025-2030 ($ million)
Data Table on France - Market size and forecast 2025-2030 ($ million)
Chart on France - Year-over-year growth 2025-2030 (%)
Data Table on France - Year-over-year growth 2025-2030 (%)

12.4.4 Italy - Market size and forecast 2025-2030

Chart on Italy - Market size and forecast 2025-2030 ($ million)
Data Table on Italy - Market size and forecast 2025-2030 ($ million)
Chart on Italy - Year-over-year growth 2025-2030 (%)
Data Table on Italy - Year-over-year growth 2025-2030 (%)

12.4.5 Spain - Market size and forecast 2025-2030

Chart on Spain - Market size and forecast 2025-2030 ($ million)
Data Table on Spain - Market size and forecast 2025-2030 ($ million)
Chart on Spain - Year-over-year growth 2025-2030 (%)
Data Table on Spain - Year-over-year growth 2025-2030 (%)

12.4.6 The Netherlands - Market size and forecast 2025-2030

Chart on The Netherlands - Market size and forecast 2025-2030 ($ million)
Data Table on The Netherlands - Market size and forecast 2025-2030 ($ million)
Chart on The Netherlands - Year-over-year growth 2025-2030 (%)
Data Table on The Netherlands - Year-over-year growth 2025-2030 (%)

12.5 Asia - Market size and forecast 2025-2030

Chart on Asia - Market size and forecast 2025-2030 ($ million)
Data Table on Asia - Market size and forecast 2025-2030 ($ million)
Chart on Asia - Year-over-year growth 2025-2030 (%)
Data Table on Asia - Year-over-year growth 2025-2030 (%)
Chart on Regional Comparison - Asia
Data Table on Regional Comparison - Asia

12.5.1 China - Market size and forecast 2025-2030

Chart on China - Market size and forecast 2025-2030 ($ million)
Data Table on China - Market size and forecast 2025-2030 ($ million)
Chart on China - Year-over-year growth 2025-2030 (%)
Data Table on China - Year-over-year growth 2025-2030 (%)

12.5.2 Japan - Market size and forecast 2025-2030

Chart on Japan - Market size and forecast 2025-2030 ($ million)
Data Table on Japan - Market size and forecast 2025-2030 ($ million)
Chart on Japan - Year-over-year growth 2025-2030 (%)
Data Table on Japan - Year-over-year growth 2025-2030 (%)

12.5.3 India - Market size and forecast 2025-2030

Chart on India - Market size and forecast 2025-2030 ($ million)
Data Table on India - Market size and forecast 2025-2030 ($ million)
Chart on India - Year-over-year growth 2025-2030 (%)
Data Table on India - Year-over-year growth 2025-2030 (%)

12.5.4 South Korea - Market size and forecast 2025-2030

Chart on South Korea - Market size and forecast 2025-2030 ($ million)
Data Table on South Korea - Market size and forecast 2025-2030 ($ million)
Chart on South Korea - Year-over-year growth 2025-2030 (%)
Data Table on South Korea - Year-over-year growth 2025-2030 (%)

12.5.5 Indonesia - Market size and forecast 2025-2030

Chart on Indonesia - Market size and forecast 2025-2030 ($ million)
Data Table on Indonesia - Market size and forecast 2025-2030 ($ million)
Chart on Indonesia - Year-over-year growth 2025-2030 (%)
Data Table on Indonesia - Year-over-year growth 2025-2030 (%)

12.5.6 Vietnam - Market size and forecast 2025-2030

Chart on Vietnam - Market size and forecast 2025-2030 ($ million)
Data Table on Vietnam - Market size and forecast 2025-2030 ($ million)
Chart on Vietnam - Year-over-year growth 2025-2030 (%)
Data Table on Vietnam - Year-over-year growth 2025-2030 (%)

12.6 Rest of World (ROW) - Market size and forecast 2025-2030

Chart on Rest of World (ROW) - Market size and forecast 2025-2030 ($ million)
Data Table on Rest of World (ROW) - Market size and forecast 2025-2030 ($ million)
Chart on Rest of World (ROW) - Year-over-year growth 2025-2030 (%)
Data Table on Rest of World (ROW) - Year-over-year growth 2025-2030 (%)
Chart on Regional Comparison - Rest of World (ROW)
Data Table on Regional Comparison - Rest of World (ROW)

12.6.1 Brazil - Market size and forecast 2025-2030

Chart on Brazil - Market size and forecast 2025-2030 ($ million)
Data Table on Brazil - Market size and forecast 2025-2030 ($ million)
Chart on Brazil - Year-over-year growth 2025-2030 (%)
Data Table on Brazil - Year-over-year growth 2025-2030 (%)

12.6.2 Argentina - Market size and forecast 2025-2030

Chart on Argentina - Market size and forecast 2025-2030 ($ million)
Data Table on Argentina - Market size and forecast 2025-2030 ($ million)
Chart on Argentina - Year-over-year growth 2025-2030 (%)
Data Table on Argentina - Year-over-year growth 2025-2030 (%)

12.6.3 South Africa - Market size and forecast 2025-2030

Chart on South Africa - Market size and forecast 2025-2030 ($ million)
Data Table on South Africa - Market size and forecast 2025-2030 ($ million)
Chart on South Africa - Year-over-year growth 2025-2030 (%)
Data Table on South Africa - Year-over-year growth 2025-2030 (%)

12.6.4 Saudi Arabia - Market size and forecast 2025-2030

Chart on Saudi Arabia - Market size and forecast 2025-2030 ($ million)
Data Table on Saudi Arabia - Market size and forecast 2025-2030 ($ million)
Chart on Saudi Arabia - Year-over-year growth 2025-2030 (%)
Data Table on Saudi Arabia - Year-over-year growth 2025-2030 (%)

12.6.5 UAE - Market size and forecast 2025-2030

Chart on UAE - Market size and forecast 2025-2030 ($ million)
Data Table on UAE - Market size and forecast 2025-2030 ($ million)
Chart on UAE - Year-over-year growth 2025-2030 (%)
Data Table on UAE - Year-over-year growth 2025-2030 (%)

12.6.6 Egypt - Market size and forecast 2025-2030

Chart on Egypt - Market size and forecast 2025-2030 ($ million)
Data Table on Egypt - Market size and forecast 2025-2030 ($ million)
Chart on Egypt - Year-over-year growth 2025-2030 (%)
Data Table on Egypt - Year-over-year growth 2025-2030 (%)

12.6.7 Turkey - Market size and forecast 2025-2030

Chart on Turkey - Market size and forecast 2025-2030 ($ million)
Data Table on Turkey - Market size and forecast 2025-2030 ($ million)
Chart on Turkey - Year-over-year growth 2025-2030 (%)
Data Table on Turkey - Year-over-year growth 2025-2030 (%)

12.6.8 Colombia - Market size and forecast 2025-2030

Chart on Colombia - Market size and forecast 2025-2030 ($ million)
Data Table on Colombia - Market size and forecast 2025-2030 ($ million)
Chart on Colombia - Year-over-year growth 2025-2030 (%)
Data Table on Colombia - Year-over-year growth 2025-2030 (%)

12.7 Market opportunity by geography

Market opportunity by geography ($ million)
Data Tables on Market opportunity by geography ($ million)

13. Drivers, Challenges, and Opportunity

13.1 Market drivers

Increasing adoption of minimally invasive surgical procedures
Technological advances in hybrid operating rooms
Emerging markets in developing countries

13.2 Market challenges

High costs associated with hybrid operating rooms
Procedural risk associated with hybrid operating room
Lack of skilled and trained surgeons

13.3 Impact of drivers and challenges

Impact of drivers and challenges in 2025 and 2030

13.4 Market opportunities

Rising adoption of robot-assisted surgeries
High investment in research and development for hybrid operating rooms
Increased emphasis on cardiovascular hybrid operation rooms

14. Competitive Landscape

14.1 Overview

14.2

Overview on criticality of inputs and factors of differentiation

14.3 Landscape disruption

Overview on factors of disruption

14.4 Industry risks

Impact of key risks on business

15. Competitive Analysis

15.1 Companies profiled

Companies covered

15.2 Company ranking index

15.3 Market positioning of companies

Matrix on companies position and classification

15.4 ALVO Ltd. Liability Co. Sp. k.

ALVO Ltd. Liability Co. Sp. k. - Overview
ALVO Ltd. Liability Co. Sp. k. - Product / Service
ALVO Ltd. Liability Co. Sp. k. - Key offerings
SWOT

15.5 Barco NV

Barco NV - Overview
Barco NV - Business segments
Barco NV - Key news
Barco NV - Key offerings
Barco NV - Segment focus
SWOT

15.6 Brainlab AG

Brainlab AG - Overview
Brainlab AG - Product / Service
Brainlab AG - Key offerings
SWOT

15.7 Canon Medical Systems Corp.

Canon Medical Systems Corp. - Overview
Canon Medical Systems Corp. - Product / Service
Canon Medical Systems Corp. - Key offerings
SWOT

15.8 Dragerwerk AG and Co. KGaA

Dragerwerk AG and Co. KGaA - Overview
Dragerwerk AG and Co. KGaA - Business segments
Dragerwerk AG and Co. KGaA - Key offerings
Dragerwerk AG and Co. KGaA - Segment focus
SWOT

15.9 GE Healthcare Technologies

GE Healthcare Technologies - Overview
GE Healthcare Technologies - Business segments
GE Healthcare Technologies - Key news
GE Healthcare Technologies - Key offerings
GE Healthcare Technologies - Segment focus
SWOT

15.10 Getinge AB

Getinge AB - Overview
Getinge AB - Business segments
Getinge AB - Key news
Getinge AB - Key offerings
Getinge AB - Segment focus
SWOT

15.11 IMRIS Deerfield Imaging Inc.

IMRIS Deerfield Imaging Inc. - Overview
IMRIS Deerfield Imaging Inc. - Product / Service
IMRIS Deerfield Imaging Inc. - Key offerings
SWOT

15.12 KARL STORZ SE and Co. KG

KARL STORZ SE and Co. KG - Overview
KARL STORZ SE and Co. KG - Product / Service
KARL STORZ SE and Co. KG - Key offerings
SWOT

15.13 Koninklijke Philips NV

Koninklijke Philips NV - Overview
Koninklijke Philips NV - Business segments
Koninklijke Philips NV - Key news
Koninklijke Philips NV - Key offerings
Koninklijke Philips NV - Segment focus
SWOT

15.14 Novanta Inc.

Novanta Inc. - Overview
Novanta Inc. - Business segments
Novanta Inc. - Key news
Novanta Inc. - Key offerings
Novanta Inc. - Segment focus
SWOT

15.15 Nuvo Surgical

Nuvo Surgical - Overview
Nuvo Surgical - Product / Service
Nuvo Surgical - Key offerings
SWOT

15.16 Siemens AG

Siemens AG - Overview
Siemens AG - Business segments
Siemens AG - Key news
Siemens AG - Key offerings
Siemens AG - Segment focus
SWOT

15.17 STERIS plc

STERIS plc - Overview
STERIS plc - Business segments
STERIS plc - Key news
STERIS plc - Key offerings
STERIS plc - Segment focus
SWOT

15.18 Stryker Corp.

Stryker Corp. - Overview
Stryker Corp. - Business segments
Stryker Corp. - Key news
Stryker Corp. - Key offerings
Stryker Corp. - Segment focus
SWOT

16. Appendix

16.1 Scope of the report

Market definition
Objectives
Notes and caveats

16.2 Inclusions and exclusions checklist

Inclusions checklist
Exclusions checklist

16.3 Currency conversion rates for US$

16.4 Research methodology

16.5 Data procurement

Information sources

16.6 Data validation

16.7 Validation techniques employed for market sizing

16.8 Data synthesis

16.9 360 degree market analysis

16.10 List of abbreviations

Research Methodology

Technavio presents a detailed picture of the market by way of study, synthesis, and summation of data from multiple sources. The analysts have presented the various facets of the market with a particular focus on identifying the key industry influencers. The data thus presented is comprehensive, reliable, and the result of extensive research, both primary and secondary.

INFORMATION SOURCES

Primary sources

  • Manufacturers and suppliers
  • Channel partners
  • Industry experts
  • Strategic decision makers

Secondary sources

  • Industry journals and periodicals
  • Government data
  • Financial reports of key industry players
  • Historical data
  • Press releases

DATA ANALYSIS

Data Synthesis

  • Collation of data
  • Estimation of key figures
  • Analysis of derived insights

Data Validation

  • Triangulation with data models
  • Reference against proprietary databases
  • Corroboration with industry experts

REPORT WRITING

Qualitative

  • Market drivers
  • Market challenges
  • Market trends
  • Five forces analysis

Quantitative

  • Market size and forecast
  • Market segmentation
  • Geographical insights
  • Competitive landscape

Interested in this report?

Get your sample now to see our research methodology and insights!

Download Now

Frequently Asked Questions

Hybrid Operating Room market growth will increase by USD 2577.5 million during 2026-2030.

The Hybrid Operating Room market is expected to grow at a CAGR of 13.1% during 2026-2030.

Hybrid Operating Room market is segmented by Application (Minimally invasive surgery, Advanced medical procedures) End-user (Hospitals, Ambulatory surgical centers) Component (Intraoperative imaging systems, Operating room fixtures, OR integration and display systems, Others)

ALVO Ltd. Liability Co. Sp. k., Barco NV, Brainlab AG, Canon Medical Systems Corp., Dragerwerk AG and Co. KGaA, GE Healthcare Technologies, Getinge AB, IMRIS Deerfield Imaging Inc., KARL STORZ SE and Co. KG, Koninklijke Philips NV, Mediflex Surgical Products, Novanta Inc., Nuvo Surgical, Siemens AG, SKYTRON LLC, STERIS plc, Stryker Corp. are a few of the key vendors in the Hybrid Operating Room market.

North America will register the highest growth rate of 41% among the other regions. Therefore, the Hybrid Operating Room market in North America is expected to garner significant business opportunities for the vendors during the forecast period.

US, Canada, Mexico, Germany, UK, France, Italy, Spain, The Netherlands, China, Japan, India, South Korea, Indonesia, Vietnam, Brazil, Argentina, South Africa, Saudi Arabia, UAE, Egypt, Turkey, Colombia

  • Increasing adoption of minimally invasive surgical procedures is the driving factor this market.

The Hybrid Operating Room market vendors should focus on grabbing business opportunities from the Application segment as it accounted for the largest market share in the base year.