Hydraulic Elevators Market Size 2026-2030
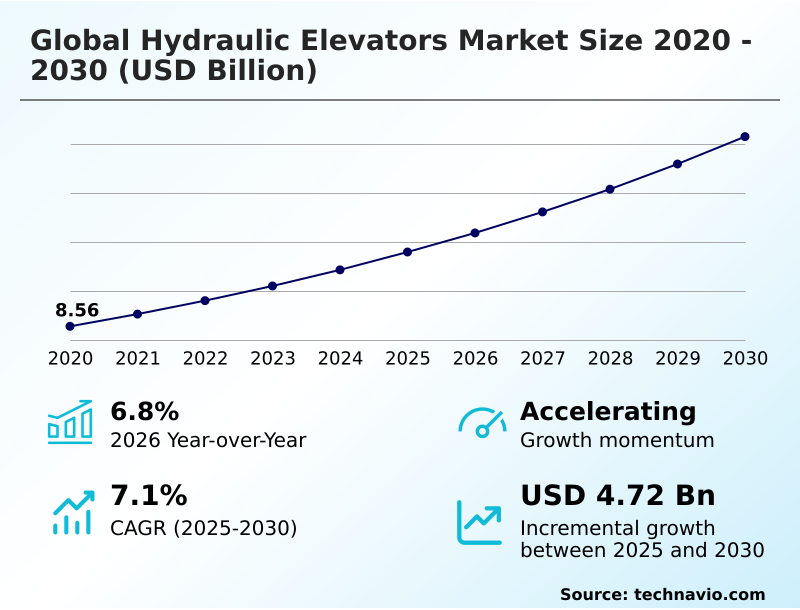
The hydraulic elevators market size is valued to increase by USD 4.72 billion, at a CAGR of 7.1% from 2025 to 2030. Rising demand for residential and low-rise infrastructure will drive the hydraulic elevators market.
Major Market Trends & Insights
- APAC dominated the market and accounted for a 51.4% growth during the forecast period.
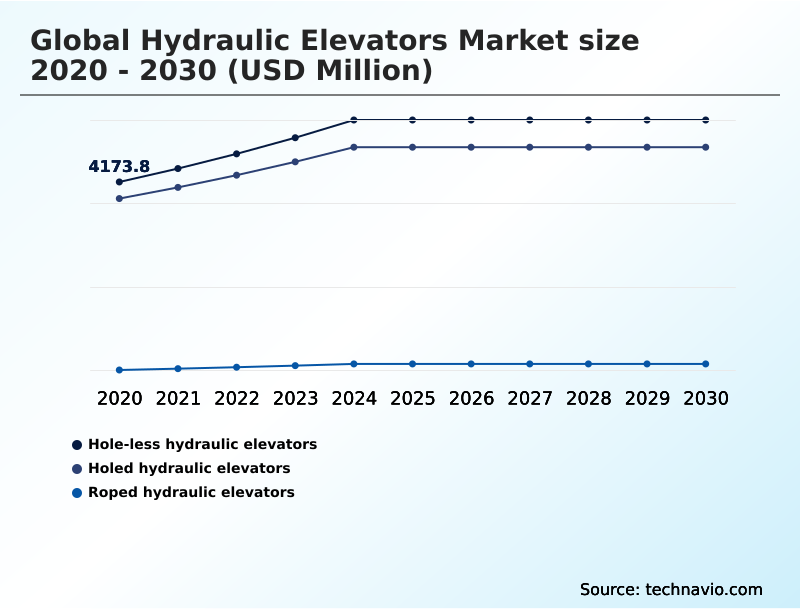
- By Type - Hole-less hydraulic elevators segment was valued at USD 5.37 billion in 2024
- By End-user - Residential segment accounted for the largest market revenue share in 2024
Market Size & Forecast
- Market Opportunities: USD 7.75 billion
- Market Future Opportunities: USD 4.72 billion
- CAGR from 2025 to 2030 : 7.1%
Market Summary
- The hydraulic elevators market is undergoing a significant transformation, driven by the demand for cost-effective and space-saving vertical mobility in low-to-mid-rise structures. These systems, operating on a fluid-driven piston mechanism, remain fundamental in construction due to their minimal structural requirements and superior lifting capacity for heavy-duty freight applications.
- A key trend is the digitalization of assets through IoT-enabled elevator monitoring and predictive maintenance platforms, which enhance reliability and reduce lifecycle costs. Building modernization and retrofitting in mature economies presents a continuous revenue stream, as property owners upgrade aging systems with high-efficiency power units and eco-friendly hydraulic fluids.
- For instance, a facility manager can use remote diagnostics platforms to anticipate a component failure, scheduling maintenance preemptively to avoid costly downtime. However, the industry faces challenges from intensifying competition from traction alternatives and stringent environmental regulations that mandate innovations like double-walled cylinder containment.
- As a result, manufacturers are focusing on developments like roped hydraulic elevators and panoramic glass elevator cabins to maintain a competitive edge.
What will be the Size of the Hydraulic Elevators Market during the forecast period?
Get Key Insights on Market Forecast (PDF) Get Free Sample
How is the Hydraulic Elevators Market Segmented?
The hydraulic elevators industry research report provides comprehensive data (region-wise segment analysis), with forecasts and estimates in "USD million" for the period 2026-2030, as well as historical data from 2020-2024 for the following segments.
- Type
- Hole-less hydraulic elevators
- Holed hydraulic elevators
- Roped hydraulic elevators
- End-user
- Residential
- Commercial
- Industrial
- Application
- From 1000 to 3000 KG
- Up to 1000 KG
- From 3000 to 6000 KG
- More than 6000 KG
- Geography
- APAC
- China
- Japan
- India
- North America
- US
- Canada
- Mexico
- Europe
- Germany
- UK
- France
- Middle East and Africa
- Saudi Arabia
- UAE
- South Africa
- South America
- Brazil
- Argentina
- Rest of World (ROW)
- APAC
By Type Insights
The hole-less hydraulic elevators segment is estimated to witness significant growth during the forecast period.
Hole-less hydraulic elevators are a key segment, defined by space-optimized elevator designs that eliminate the need for a subterranean pit.
This pit-free installation design is critical for building modernization and retrofitting, particularly for elevator retrofitting in historic buildings where excavation is not feasible.
By using side-mounted piston systems and a telescoping cylinder design, these systems mitigate risks of groundwater contamination, aligning with green building certification compliance goals.
Their adoption for sustainable vertical mobility is growing, as they offer the advantages of modular elevator components and quiet pump unit technology.
New installations have shown to reduce site disruption by over 40% compared to traditional holed systems, making them more viable and cost-effective.
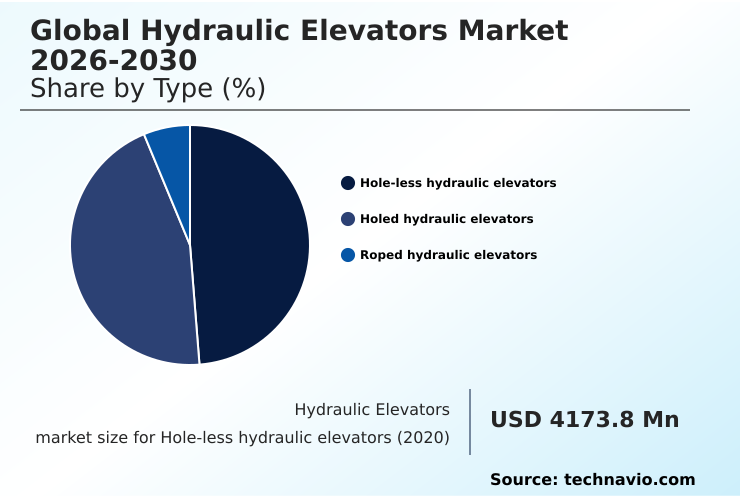
The Hole-less hydraulic elevators segment was valued at USD 5.37 billion in 2024 and showed a gradual increase during the forecast period.
Regional Analysis
APAC is estimated to contribute 51.4% to the growth of the global market during the forecast period.Technavio’s analysts have elaborately explained the regional trends and drivers that shape the market during the forecast period.

See How Hydraulic Elevators Market Demand is Rising in APAC Get Free Sample
The geographic landscape is dominated by APAC, projected to account for 51.4% of market growth. This expansion is driven by rapid urbanization and infrastructure projects requiring robust vertical transportation systems.
The region's industrial sector fuels demand for heavy-duty freight applications and high industrial freight elevator capacity, often utilizing a fluid-driven piston mechanism for reliability.
Innovations like roped hydraulic elevators using a cable and sheave roping system are gaining traction in mid-rise buildings. Furthermore, advanced control algorithms are being integrated for automated guided vehicle integration in manufacturing hubs, enabling seamless workflows.
Hydraulic elevator service contracts are expanding to support these complex systems, ensuring operational uptime in high-traffic environment solutions.
Market Dynamics
Our researchers analyzed the data with 2025 as the base year, along with the key drivers, trends, and challenges. A holistic analysis of drivers will help companies refine their marketing strategies to gain a competitive advantage.
- Strategic decision-making in the vertical transportation sector requires a nuanced understanding of key performance and cost variables. The choice between hole-less vs holed hydraulic elevators, for instance, has significant implications for installation complexity and environmental compliance.
- A thorough hydraulic vs traction elevator comparison reveals that while traction systems offer speed, hydraulic systems provide superior heavy-load performance at a lower initial cost for low-rise buildings. Businesses evaluating the cost of residential hydraulic elevator installations must also factor in long-term operational expenses, where hydraulic elevator maintenance best practices play a crucial role.
- The energy consumption of hydraulic elevators, a key concern, is being addressed by the benefits of MRL hydraulic elevators and other energy-efficient designs. For developers, understanding the space requirements for hydraulic elevators is essential for architectural planning, especially when retrofitting elevators in older buildings.
- The hydraulic freight elevator weight capacity remains a primary advantage in industrial settings, influencing decisions in industrial warehouse vertical transport solutions. As businesses adopt smarter technologies, integrating IoT into hydraulic elevators is a key topic, alongside the use of eco-friendly hydraulic fluid alternatives and implementing predictive maintenance for elevator systems.
- The hydraulic elevator modernization benefits, such as enhanced safety and efficiency, often outweigh the initial investment, making it a compelling option. For specialized needs, understanding panoramic hydraulic elevator design options and seismic standards for hydraulic elevators is vital.
- Finally, effective hydraulic elevator noise reduction techniques and compliance with commercial building elevator regulations are critical for both user satisfaction and legal adherence.
What are the key market drivers leading to the rise in the adoption of Hydraulic Elevators Industry?
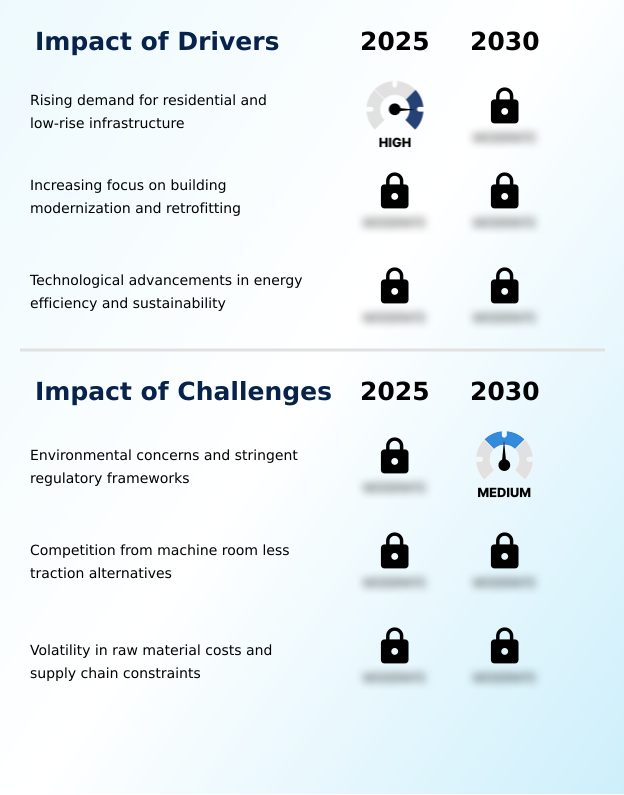
- The increasing demand for vertical mobility solutions in residential and low-rise infrastructure projects is a primary driver fueling market growth.
- A primary market driver is the sustained demand for low-rise infrastructure solutions, particularly for residential and light commercial applications. Machine-room-less hydraulic elevators, featuring compact hydraulic power units, are increasingly preferred for their space efficiency.
- Technological advancements in high-efficiency power units and energy-efficient valve technology are addressing historical concerns about energy consumption; modern systems now offer up to 20% lower energy use compared to older models.
- The adoption of eco-friendly hydraulic fluids and real-time energy monitoring further supports sustainability goals. This push for efficiency, combined with the need for residential elevator customization and reliable vertical mobility for aging populations, ensures the segment's continued relevance and growth.
What are the market trends shaping the Hydraulic Elevators Industry?
- The integration of IoT and predictive maintenance is emerging as a significant market trend. This shift enables real-time monitoring and data analytics to enhance operational efficiency and reliability.
- The market is rapidly evolving beyond basic functionality, driven by digitalization and customization. Predictive maintenance platforms, enabled by IoT-enabled elevator monitoring, are becoming standard for commercial low-rise elevators, with some systems reducing unexpected downtime by up to 30%. This smart building integration extends to remote diagnostics platforms and touchless control interfaces, enhancing both service efficiency and user hygiene.
- In the residential sector, demand for luxury home elevator systems is fueling innovation in aesthetics, including panoramic glass elevator cabins and extensive custom elevator interior finishes. This focus on user interface customization and residential accessibility lifts is transforming vertical transport into a design-centric feature, significantly improving passenger ride quality and property value.
What challenges does the Hydraulic Elevators Industry face during its growth?
- Growing environmental concerns, coupled with stringent regulatory frameworks, present a significant challenge to industry growth and product development.
- The market faces significant challenges from environmental regulations and competition. Traditional holed hydraulic elevators with their in-ground hydraulic configuration are under scrutiny for potential soil contamination, leading to mandates for double-walled cylinder containment and the use of biodegradable hydraulic oils. This increases upfront costs by as much as 15%.
- Simultaneously, the market is challenged by the performance of traction systems, prompting innovation in hydraulic technology, such as regenerative drive technology and the use of high-tensile synthetic ropes to improve efficiency. Adapting systems with seismic protection features and robust emergency lowering features remains critical for compliance and safety, pushing manufacturers to invest in comprehensive hydraulic elevator modernization packages.
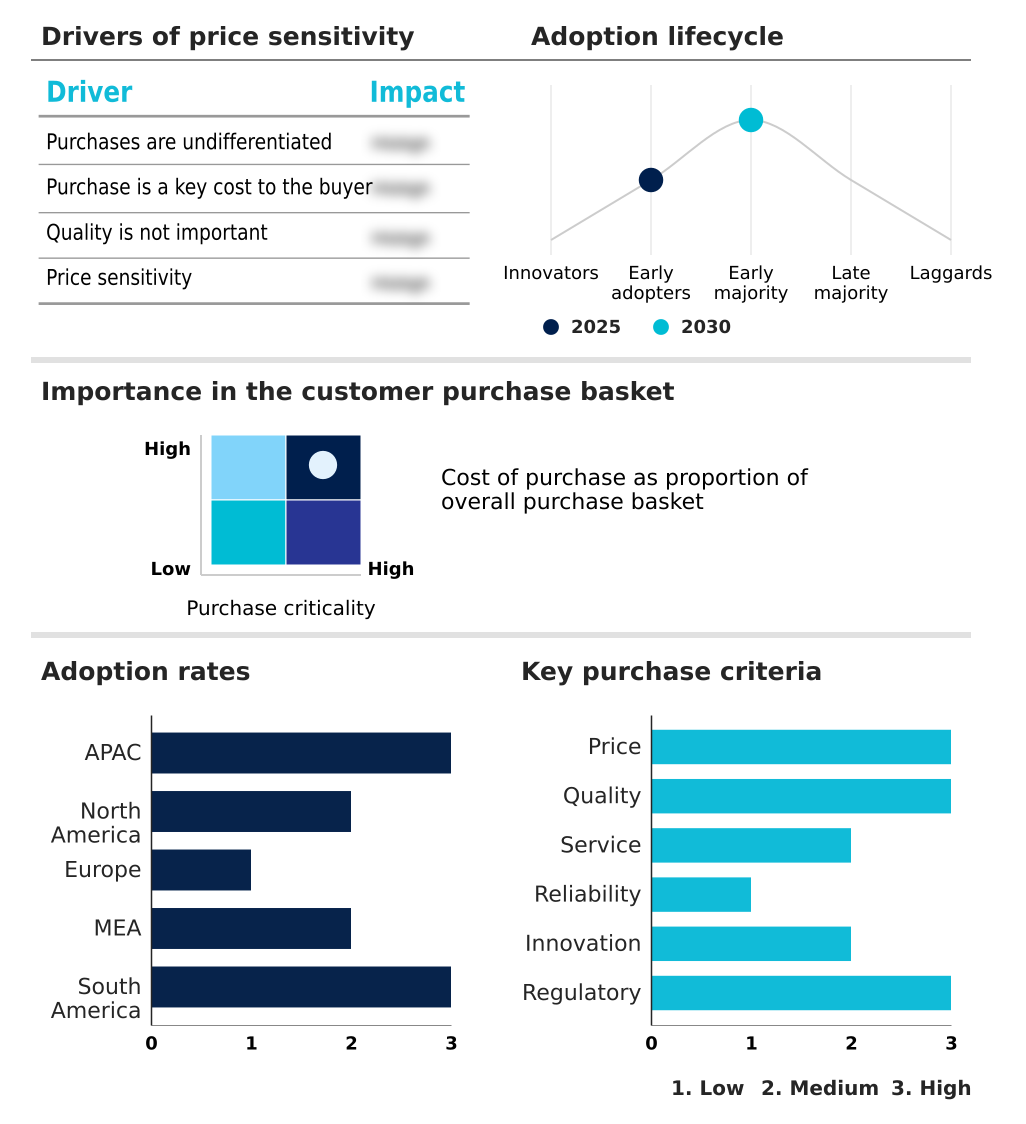
Exclusive Technavio Analysis on Customer Landscape
The hydraulic elevators market forecasting report includes the adoption lifecycle of the market, covering from the innovator’s stage to the laggard’s stage. It focuses on adoption rates in different regions based on penetration. Furthermore, the hydraulic elevators market report also includes key purchase criteria and drivers of price sensitivity to help companies evaluate and develop their market growth analysis strategies.
Customer Landscape of Hydraulic Elevators Industry
Competitive Landscape
Companies are implementing various strategies, such as strategic alliances, hydraulic elevators market forecast, partnerships, mergers and acquisitions, geographical expansion, and product/service launches, to enhance their presence in the industry.
Cambridge Elevating Inc. - The vendor offers hydraulic and traction elevators, parking systems, and marine lifts for residential and commercial needs, demonstrating diversified vertical transport expertise.
The industry research and growth report includes detailed analyses of the competitive landscape of the market and information about key companies, including:
- Cambridge Elevating Inc.
- Cibes Lift Group
- Delta Elevator Co. Ltd.
- Elite Elevators
- Excel Elevator and Escalator
- Fujitec Co. Ltd.
- Hitachi Ltd.
- Hyundai Elevator Co. Ltd.
- Inclinator Co. of America
- Kleemann Hellas SA
- KONE Oyj
- Mitsubishi Electric Corp.
- Otis Worldwide Corp.
- Residential Elevators Inc.
- Schindler Holding Ltd.
- Schumacher Elevator Co.
- Stiltz Lifts Ltd.
- TK Elevator GmbH
Qualitative and quantitative analysis of companies has been conducted to help clients understand the wider business environment as well as the strengths and weaknesses of key industry players. Data is qualitatively analyzed to categorize companies as pure play, category-focused, industry-focused, and diversified; it is quantitatively analyzed to categorize companies as dominant, leading, strong, tentative, and weak.
Recent Development and News in Hydraulic elevators market
- In August 2024, the European Commission's revised Industrial Emissions Directive (IED 2.0) came into effect, introducing stricter rules to reduce pollution from industrial installations across the EU, impacting manufacturing standards.
- In February 2025, KONE collaborated on the Hotel Marcel project, which is becoming the first net-zero hotel in the United States, utilizing regenerative drive technologies to return energy to the building’s grid.
- In March 2025, BRIO Elevators introduced the Brio BE360, a hybrid hydraulic elevator featuring a 360-degree panoramic view and a pit-free design tailored for high-end residential and boutique commercial spaces.
- In May 2025, Savaria Corp. announced the acquisition of Western Elevator, a move designed to expand its market presence and enhance its product portfolio in the accessibility equipment sector.
Dive into Technavio’s robust research methodology, blending expert interviews, extensive data synthesis, and validated models for unparalleled Hydraulic Elevators Market insights. See full methodology.
| Market Scope | |
|---|---|
| Page number | 296 |
| Base year | 2025 |
| Historic period | 2020-2024 |
| Forecast period | 2026-2030 |
| Growth momentum & CAGR | Accelerate at a CAGR of 7.1% |
| Market growth 2026-2030 | USD 4721.1 million |
| Market structure | Fragmented |
| YoY growth 2025-2026(%) | 6.8% |
| Key countries | China, Japan, India, South Korea, Australia, Indonesia, US, Canada, Mexico, Germany, UK, France, Italy, Spain, The Netherlands, Saudi Arabia, UAE, South Africa, Israel, Turkey, Brazil, Argentina and Chile |
| Competitive landscape | Leading Companies, Market Positioning of Companies, Competitive Strategies, and Industry Risks |
Research Analyst Overview
- The market for hydraulic elevators is defined by a strategic push toward technological sophistication and sustainability. Innovations in a fluid-driven piston mechanism and the adoption of a pit-free installation design are addressing long-standing spatial and environmental constraints.
- For boardroom-level budgeting, the focus is shifting from initial capex to total lifecycle value, a metric heavily influenced by the integration of predictive maintenance platforms. These systems, utilizing remote diagnostics platforms and smart building integration, have demonstrated the ability to reduce unscheduled service calls by up to 30%, directly impacting operational expenditures.
- The evolution of hole-less hydraulic elevators and roped hydraulic elevators is expanding the application range, while features like panoramic glass elevator cabins and touchless control interfaces cater to a growing demand for aesthetic and user-centric vertical transportation systems.
- The push for building modernization and retrofitting continues to be a stable revenue driver, necessitating advanced solutions like high-tensile synthetic ropes and regenerative drive technology to keep hydraulic systems competitive.
What are the Key Data Covered in this Hydraulic Elevators Market Research and Growth Report?
-
What is the expected growth of the Hydraulic Elevators Market between 2026 and 2030?
-
USD 4.72 billion, at a CAGR of 7.1%
-
-
What segmentation does the market report cover?
-
The report is segmented by Type (Hole-less hydraulic elevators, Holed hydraulic elevators, and Roped hydraulic elevators), End-user (Residential, Commercial, and Industrial), Application (From 1000 to 3000 KG, Up to 1000 KG, From 3000 to 6000 KG, and More than 6000 KG) and Geography (APAC, North America, Europe, Middle East and Africa, South America)
-
-
Which regions are analyzed in the report?
-
APAC, North America, Europe, Middle East and Africa and South America
-
-
What are the key growth drivers and market challenges?
-
Rising demand for residential and low-rise infrastructure, Environmental concerns and stringent regulatory frameworks
-
-
Who are the major players in the Hydraulic Elevators Market?
-
Cambridge Elevating Inc., Cibes Lift Group, Delta Elevator Co. Ltd., Elite Elevators, Excel Elevator and Escalator, Fujitec Co. Ltd., Hitachi Ltd., Hyundai Elevator Co. Ltd., Inclinator Co. of America, Kleemann Hellas SA, KONE Oyj, Mitsubishi Electric Corp., Otis Worldwide Corp., Residential Elevators Inc., Schindler Holding Ltd., Schumacher Elevator Co., Stiltz Lifts Ltd. and TK Elevator GmbH
-
Market Research Insights
- The market's dynamics are shaped by a focus on lifecycle value and customization. Hydraulic elevator modernization packages are increasingly popular, with some upgrades improving energy efficiency by over 25% compared to legacy systems. In the residential sector, demand for customization is high, with panoramic residential elevator designs and luxury home elevator systems becoming key differentiators.
- This has led to the development of quiet pump unit technology that reduces operational noise by up to 15 decibels. The total cost of ownership is a critical factor for commercial clients, driving the adoption of IoT-enabled elevator monitoring and comprehensive hydraulic elevator service contracts that guarantee uptime and predictive interventions.
We can help! Our analysts can customize this hydraulic elevators market research report to meet your requirements.
 RIA -
RIA - 
