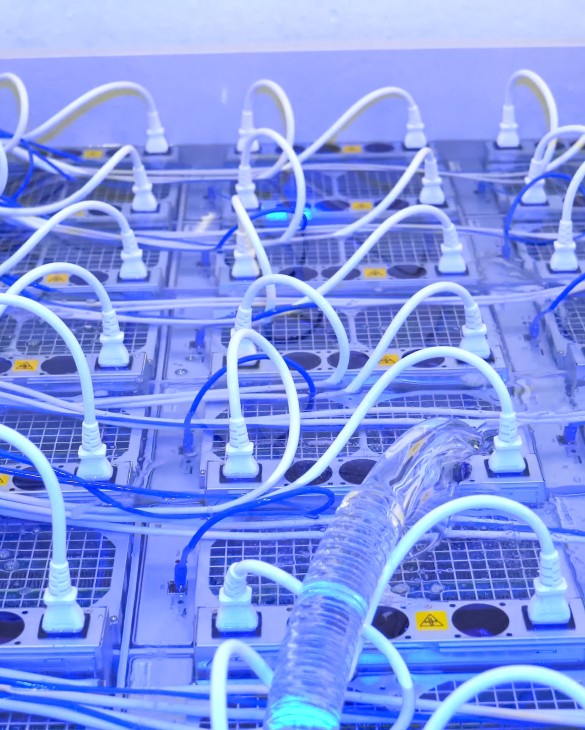
Immersion Cooling Market Analysis, Size, and Forecast 2026-2030: North America (US, Canada, and Mexico), Europe (Germany, UK, and France), APAC (China, Japan, and India), South America (Brazil, Argentina, and Chile), Middle East and Africa (UAE, Saudi Arabia, and South Africa), and Rest of World (ROW)

Immersion Cooling Market Analysis, Size, and Forecast 2026-2030:
North America (US, Canada, and Mexico), Europe (Germany, UK, and France), APAC (China, Japan, and India), South America (Brazil, Argentina, and Chile), Middle East and Africa (UAE, Saudi Arabia, and South Africa), and Rest of World (ROW)

Published: Oct 2026 296 Pages SKU: IRTNTR71337

Market Overview at a Glance

$1.45 B
Market Opportunity
27.9%
CAGR 2025 - 2030
42.3%
North America Growth
$374.7 Mn
Single-phase immersion cooling segment 2024

Immersion Cooling Market Size 2026-2030

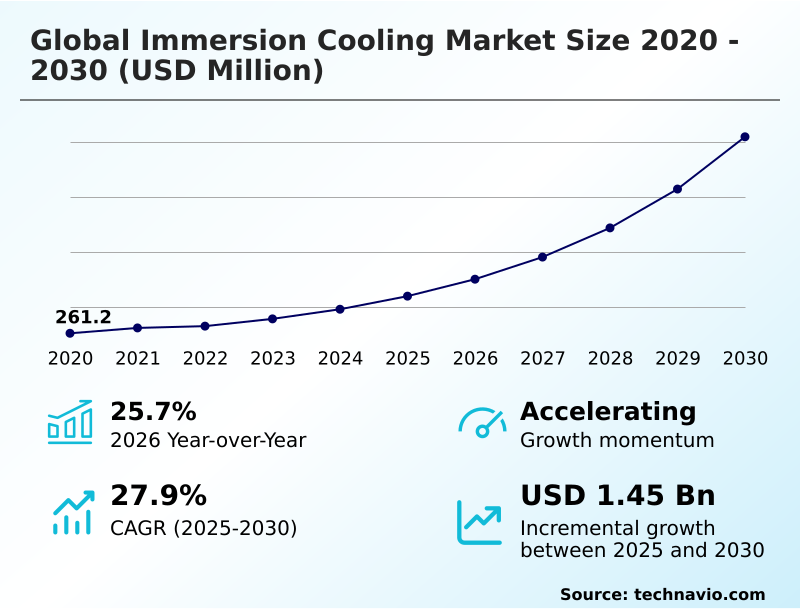
The immersion cooling market size is valued to increase by USD 1.45 billion, at a CAGR of 27.9% from 2025 to 2030. Rising processor and rack densities exceeding air-cooling capabilities will drive the immersion cooling market.

Major Market Trends & Insights

  • North America dominated the market and accounted for a 42.3% growth during the forecast period.
  • By Type - Single-phase immersion cooling segment was valued at USD 374.7 million in 2024
  • By Application - High-performance computing segment accounted for the largest market revenue share in 2024

Market Size & Forecast

  • Market Opportunities: USD 1.79 billion
  • Market Future Opportunities: USD 1.45 billion
  • CAGR from 2025 to 2030 : 27.9%

Market Summary

  • The Immersion Cooling Market is experiencing a fundamental structural shift as computational demands rapidly outpace legacy thermal management methodologies. Data center operators face intense pressure to handle heavy thermal output while simultaneously meeting aggressive decarbonization targets.
  • For example, in large-scale cloud infrastructure operations, facilities are transitioning from air-chilled server halls to liquid-submerged compute clusters utilizing advanced fluid chemistry, enabling operators to achieve a 40% reduction in facility-level energy consumption compared to traditional mechanical refrigeration.
  • This profound efficiency gain is primarily driven by the relentless densification of processors required for next-generation computing power, where heat generation makes air cooling physically and economically unviable. However, the transition is notably constrained by significant upfront capital requirements, as retrofitting existing facilities necessitates heavy financial investment.
  • Despite these initial deployment costs, the operational necessity of maintaining stable computing environments ensures continuous adoption. Ultimately, advanced thermal liquid solutions provide an essential pathway for sustaining the reliable operation of dense digital infrastructure.

What will be the Size of the Immersion Cooling Market during the forecast period?
Get Key Insights on Market Forecast (PDF) Get Free Sample

How is the Immersion Cooling Market Segmented?

The immersion cooling industry research report provides comprehensive data (region-wise segment analysis), with forecasts and estimates in "USD million" for the period 2026-2030, as well as historical data from 2020-2024 for the following segments.

  • Type
    • Single-phase immersion cooling
    • Two-phase immersion cooling
  • Application
    • High-performance computing
    • Edge computing
    • Cryptocurrency mining
  • Component
    • Solutions
    • Services
  • Geography
    • North America
      • US
      • Canada
      • Mexico
    • Europe
      • Germany
      • UK
      • France
      • The Netherlands
      • Sweden
      • Italy
    • APAC
      • China
      • Japan
      • India
      • South Korea
      • Singapore
      • Australia
    • South America
      • Brazil
      • Argentina
      • Chile
    • Middle East and Africa
      • UAE
      • Saudi Arabia
      • South Africa
      • Israel
      • Qatar

By Type Insights

The single-phase immersion cooling segment is estimated to witness significant growth during the forecast period.

Single-phase immersion cooling operates by circulating a single-phase cooling fluid to achieve optimal dielectric heat transfer without phase changes, offering operational simplicity and robust performance.

As server rack power densification accelerates across enterprise facilities, conventional air-based methods struggle to maintain hardware stability.

This submerged server infrastructure approach bypasses traditional thermal limits by directly absorbing heat and transferring it through a secondary water loop, ensuring continuous hardware operation under intense workloads.

By implementing this method, operators can experience a 45% reduction in facility cooling energy consumption compared to legacy forced-air architectures. The enhanced liquid thermal efficiency not only stabilizes high-density clusters but also lowers overall infrastructure overhead.

Consequently, organizations achieve a more sustainable operational footprint while seamlessly supporting modern data-intensive applications.
Get Free Sample

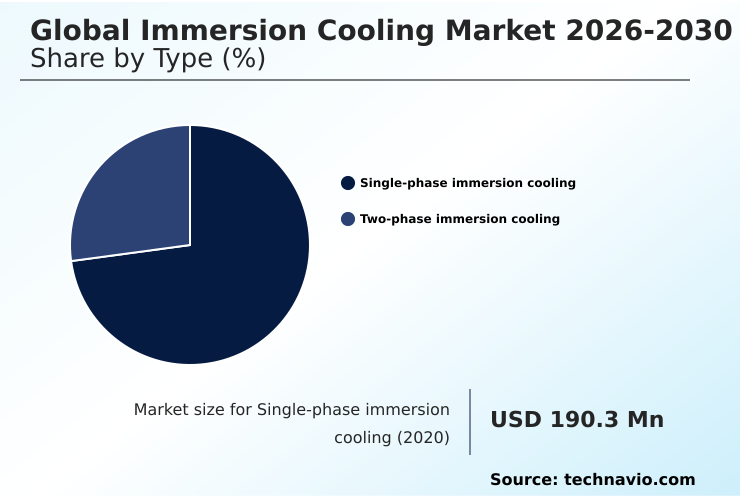
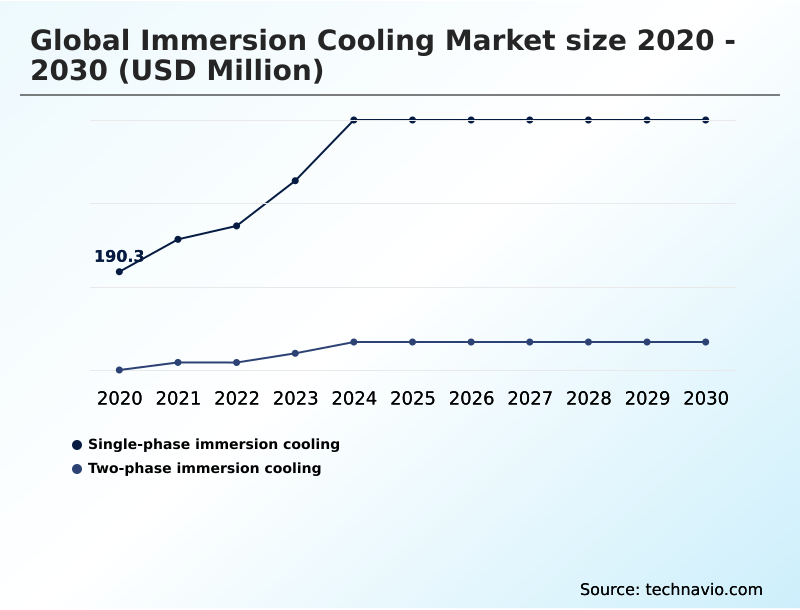
The Single-phase immersion cooling segment was valued at USD 374.7 million in 2024 and showed a gradual increase during the forecast period.
Get Free Sample

Regional Analysis

North America is estimated to contribute 42.3% to the growth of the global market during the forecast period.Technavio’s analysts have elaborately explained the regional trends and drivers that shape the market during the forecast period.
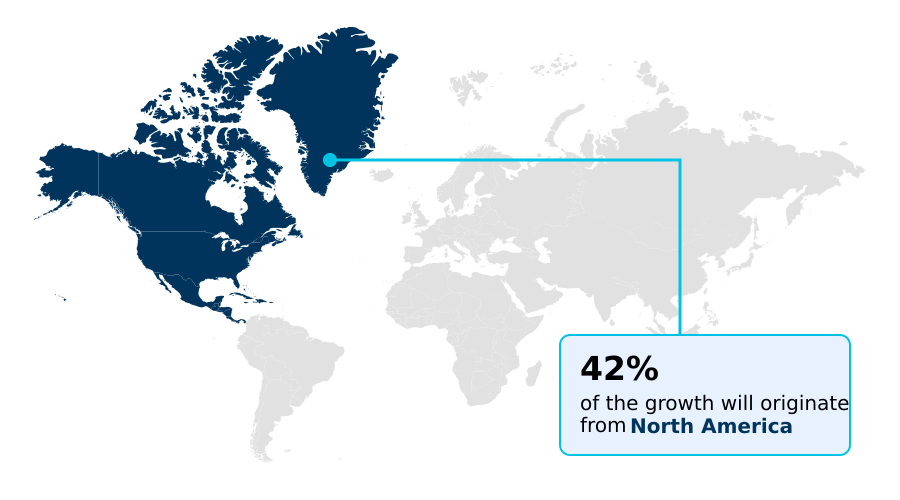
See How Immersion Cooling Market Demand is Rising in North America Get Free Sample

The geographic adoption of thermal management hardware reveals distinct regional strategies driven by disparate environmental and regulatory pressures.

In North America, the rapid deployment of liquid-cooled blade servers is largely motivated by extreme rack densities, enabling operators to achieve a 30% higher rack utilization rate compared to legacy air-cooled sites.

Conversely, the European landscape prioritizes sustainability and data center heat rejection capabilities, utilizing specialized immersion tanks filled with synthetic dielectric liquid to capture and repurpose thermal energy for district heating networks.

This regulatory-driven approach in Europe has led to a 25% faster adoption rate of heat-reuse frameworks than in North America. Furthermore, localized data processing needs in remote areas ensure continuous equipment failure mitigation.

Ultimately, these contrasting regional dynamics dictate how enterprises design and scale their advanced thermal infrastructures.

Market Dynamics

Our researchers analyzed the data with 2025 as the base year, along with the key drivers, trends, and challenges. A holistic analysis of drivers will help companies refine their marketing strategies to gain a competitive advantage.

  • The integration of advanced thermal architectures is fundamentally reshaping modern digital infrastructure, particularly as organizations transition toward sustainable cloud data center cooling. Facility operators are rapidly deploying single-phase dielectric fluid cooling systems to manage escalating compute loads, shifting away from inefficient mechanical chillers.
  • Simultaneously, the aggressive expansion of artificial intelligence is driving the adoption of two-phase immersion cooling for AI, utilizing passive vaporization server cooling technology to handle extreme processing demands. This transition facilitates a 55% improvement in high-density server rack heat dissipation compared to traditional air-blown containment aisles.
  • Implementing robust modular immersion tank cooling infrastructure enables a highly scalable approach to extreme density computing thermal regulation. To ensure system longevity, operators conduct rigorous dielectric coolant material compatibility testing before introducing high heat capacity synthetic coolants into their hardware environments.
  • In remote industrial sectors, the demand for edge computing rugged thermal management has surged, protecting sensitive components from airborne contaminants. Likewise, specialized operations rely heavily on cryptocurrency ASIC miner liquid submersion to sustain peak hashing performance without thermal throttling.
  • The broader enterprise sector is increasingly focused on hyper-converged infrastructure liquid cooling, which seamlessly integrates with liquid-to-liquid heat exchange loops to remove thermal energy from the facility.
  • Ultimately, these advanced frameworks support the implementation of highly effective data center waste heat recovery solutions, closing the loop on energy efficient supercomputer immersion cooling and transforming operational heat exhaust into a measurable utility asset.
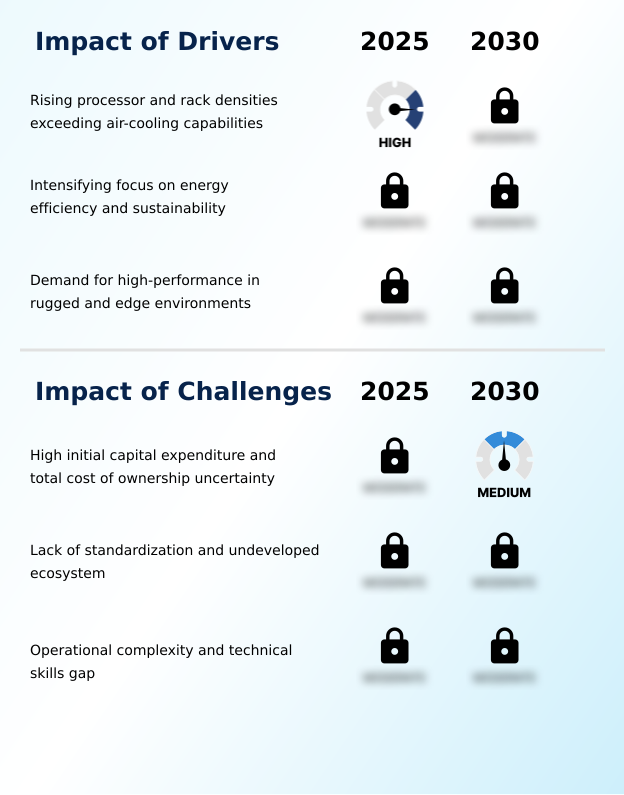
What are the key market drivers leading to the rise in the adoption of Immersion Cooling Industry?

  • The continuous escalation of processor and rack densities beyond the practical limits of traditional air-cooling capabilities serves as the primary driver propelling the market.

  • The explosive demand for artificial intelligence inference and real-time analytics acts as a primary catalyst accelerating the widespread adoption of hardware submersion technology. Traditional air-cooling constraints inhibit digital scaling, forcing enterprises to rethink their infrastructure to prevent performance bottlenecks.
  • By utilizing liquid immersion, organizations achieve complete server component isolation, which fundamentally provides harsh environment protection for sensitive electronics against airborne contaminants.
  • This capability enables a 45% reduction in mechanical failure rates and lowers facility energy use by 30% against standard air-chilled environments.
  • Furthermore, the superior ambient temperature resilience of these submerged systems allows for the seamless rollout of edge computing nodes in varied climates. Ultimately, this robust thermal stability is crucial for ensuring uninterrupted, low-latency data processing across distributed global networks.

What are the market trends shaping the Immersion Cooling Industry?

  • The development of advanced and sustainable dielectric fluids represents a critical market trend. This shift emphasizes the creation of eco-friendly coolants optimized for superior thermal performance and long-term material compatibility.

  • The transition toward autonomous cooling automation represents a transformative trend in managing complex thermal environments across modern digital facilities. As enterprises scale their smart city infrastructure and edge capabilities, they increasingly rely on liquid-cooled GPU clusters to process immense datasets. This shift is driving extensive innovation in dielectric fluid formulation to ensure chemical stability during long-term IT equipment submersion.
  • By integrating an advanced coolant distribution unit into these systems, operators can dynamically regulate flow rates based on real-time thermal loads. Consequently, this precision automation reduces thermal-related hardware downtime by 35% while simultaneously improving overall compute efficiency by 22% compared to static cooling models. These intelligent thermal management frameworks allow organizations to safely maximize the performance of high-density computational assets.

What challenges does the Immersion Cooling Industry face during its growth?

  • Substantial initial capital expenditure coupled with uncertainty regarding the total cost of ownership remains a significant challenge impeding broader industry adoption.

  • The structural complexity of integrating advanced liquid systems into legacy facilities presents a substantial operational challenge that restricts widespread market penetration. Transitioning to high-frequency processing cooling requires intricate facility retrofits, often leading to prolonged deployment cycles and increased upfront capital expenditure. Furthermore, ensuring precise thermal interface compatibility between specialized fluids and submerged IT components demands rigorous, time-consuming material validation.
  • Without proper automated fluid monitoring to detect degradation or contamination, operators risk catastrophic hardware failure, directly undermining the core objective of hardware lifecycle extension. Due to these complex integration requirements, retrofitted data centers often experience a 25% higher initial deployment cost and require 40% more specialized technician training compared to standard expansions.
  • Overcoming these technical barriers remains critical for standardizing supercomputer thermal regulation across the broader enterprise sector.

Exclusive Technavio Analysis on Customer Landscape

The immersion cooling market forecasting report includes the adoption lifecycle of the market, covering from the innovator’s stage to the laggard’s stage. It focuses on adoption rates in different regions based on penetration. Furthermore, the immersion cooling market report also includes key purchase criteria and drivers of price sensitivity to help companies evaluate and develop their market growth analysis strategies.
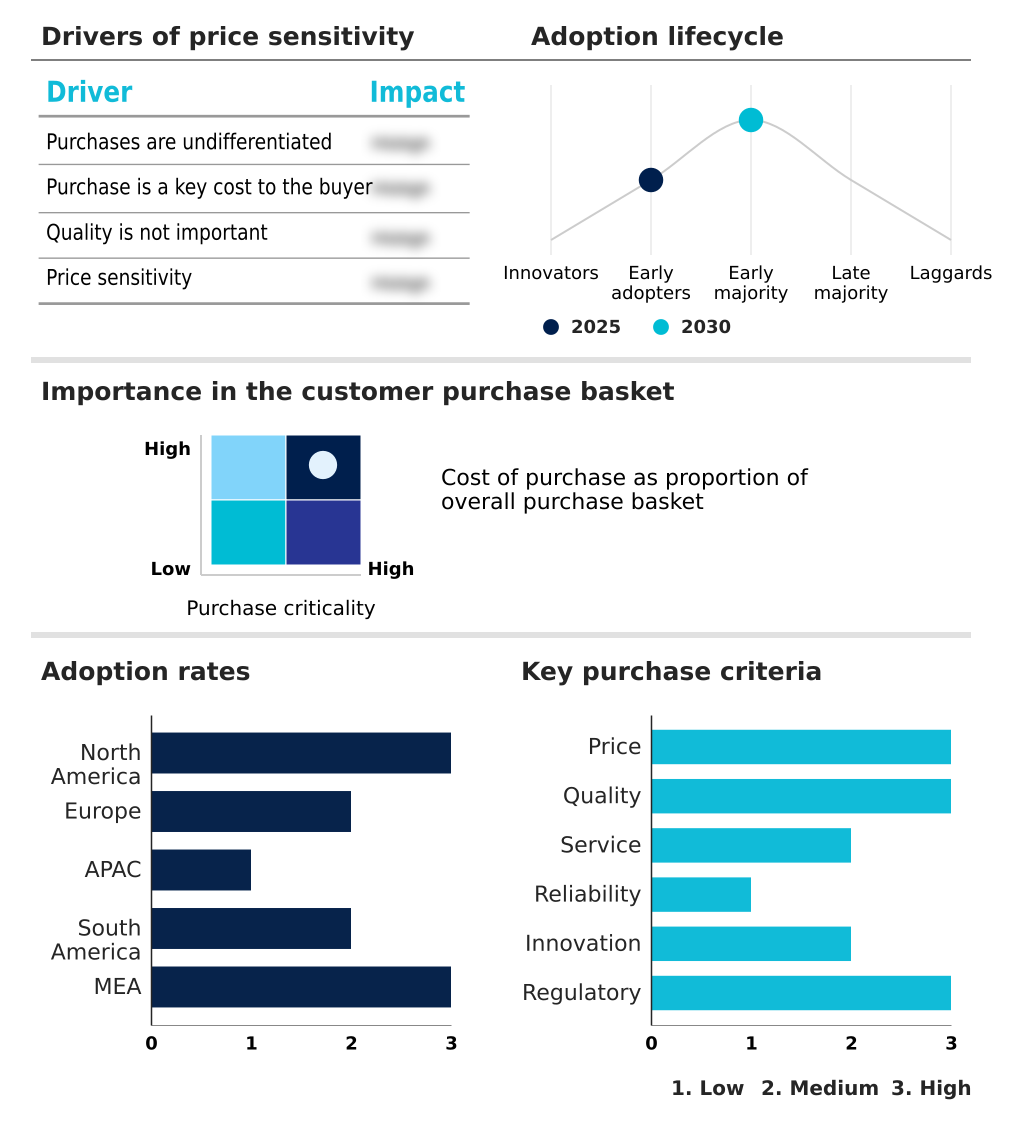
Customer Landscape of Immersion Cooling Industry

Competitive Landscape

Companies are implementing various strategies, such as strategic alliances, immersion cooling market forecast, partnerships, mergers and acquisitions, geographical expansion, and product/service launches, to enhance their presence in the industry.

3M Co. - Core offerings include advanced single-phase and two-phase dielectric thermal management systems, engineered to dissipate intense computational heat while significantly reducing overall data center energy expenditure and infrastructure footprint.

The industry research and growth report includes detailed analyses of the competitive landscape of the market and information about key companies, including:

  • 3M Co.
  • Asperitas
  • Cargill Inc.
  • Castrol Ltd.
  • Coolit Systems
  • Dow Chemical Co.
  • DUG Technology Ltd.
  • Exxon Mobil Corp.
  • Fujitsu Ltd.
  • Google LLC
  • Green Revolution Cooling Inc.
  • Hewlett Packard Enterprise Co.
  • Intel Corp.
  • Microsoft Corp.
  • NVIDIA Corp.
  • Rittal GmbH and Co. KG
  • Schneider Electric SE
  • Shell plc
  • STULZ GmbH
  • Super Micro Computer Inc.

Qualitative and quantitative analysis of companies has been conducted to help clients understand the wider business environment as well as the strengths and weaknesses of key industry players. Data is qualitatively analyzed to categorize companies as pure play, category-focused, industry-focused, and diversified; it is quantitatively analyzed to categorize companies as dominant, leading, strong, tentative, and weak.

Recent Development and News in Immersion cooling market

  • In the Industrial Machinery and Supplies and Components industry, the integration of automation into smart factories has demanded extreme computing density, directly impacting Immersion Cooling Market demand by forcing operators to transition toward highly efficient thermal solutions.
  • Stringent sustainability mandates like the European Energy Efficiency Directive require mechanical system manufacturers to implement waste heat repurposing capabilities, accelerating the deployment of secondary fluid heat exchange loops to capture and reuse thermal energy.
  • The rapid 5G network expansion into remote edge deployments necessitates advanced hardware strategies, driving telecommunications infrastructure providers to adopt a compact infrastructure footprint design utilizing a direct liquid-to-chip pathway.
  • Advancements in industrial fluid engineering have enabled the production of environmentally safe coolants, significantly lowering the total cost of ownership for operators managing passive vaporization server cooling technology across global supply chains.

Dive into Technavio’s robust research methodology, blending expert interviews, extensive data synthesis, and validated models for unparalleled Immersion Cooling Market insights. See full methodology.

Market Scope
Page number 296
Base year 2025
Historic period 2020-2024
Forecast period 2026-2030
Growth momentum & CAGR Accelerate at a CAGR of 27.9%
Market growth 2026-2030 USD 1448.7 million
Market structure Fragmented
YoY growth 2025-2026(%) 25.7%
Key countries US, Canada, Mexico, Germany, UK, France, The Netherlands, Sweden, Italy, China, Japan, India, South Korea, Singapore, Australia, Brazil, Argentina, Chile, UAE, Saudi Arabia, South Africa, Israel and Qatar
Competitive landscape Leading Companies, Market Positioning of Companies, Competitive Strategies, and Industry Risks

Request Free Sample

Research Analyst Overview

  • The continuous evolution of thermal infrastructure is deeply integrated into board-level strategic planning, particularly concerning capital budgeting and long-term environmental compliance. As computational densities reach unprecedented levels, the shift toward closed-loop thermal systems has become an operational imperative rather than a discretionary upgrade.
  • Facilities implementing two-phase vaporization cooling achieve a 60% reduction in mechanical cooling overhead compared to legacy forced-air designs. This profound cost reduction is largely enabled by the deployment of synthetic fluorocarbon fluids, which provide unparalleled high heat flux dissipation directly at the component level. By leveraging modular data center enclosures, enterprises can safely maximize hardware performance without risking thermal degradation.
  • Furthermore, the integration of advanced manifolds allows operators to transition from sheer energy consumption to liquid-based heat recovery, repurposing thermal exhaust for adjacent applications. These engineered efficiencies fundamentally align high-density computing capabilities with stringent usage regulations.

What are the Key Data Covered in this Immersion Cooling Market Research and Growth Report?

  • What is the expected growth of the Immersion Cooling Market between 2026 and 2030?

    • USD 1.45 billion, at a CAGR of 27.9%

  • What segmentation does the market report cover?

    • The report is segmented by Type (Single-phase immersion cooling, and Two-phase immersion cooling), Application (High-performance computing, Edge computing, and Cryptocurrency mining), Component (Solutions, and Services) and Geography (North America, Europe, APAC, South America, Middle East and Africa)

  • Which regions are analyzed in the report?

    • North America, Europe, APAC, South America and Middle East and Africa

  • What are the key growth drivers and market challenges?

    • Rising processor and rack densities exceeding air-cooling capabilities, High initial capital expenditure and total cost of ownership uncertainty

  • Who are the major players in the Immersion Cooling Market?

    • 3M Co., Asperitas, Cargill Inc., Castrol Ltd., Coolit Systems, Dow Chemical Co., DUG Technology Ltd., Exxon Mobil Corp., Fujitsu Ltd., Google LLC, Green Revolution Cooling Inc., Hewlett Packard Enterprise Co., Intel Corp., Microsoft Corp., NVIDIA Corp., Rittal GmbH and Co. KG, Schneider Electric SE, Shell plc, STULZ GmbH and Super Micro Computer Inc.

Market Research Insights

  • The Immersion Cooling Market continues to evolve as enterprises aggressively restructure their thermal infrastructure to support high-performance computing workloads. By abandoning legacy air systems in favor of advanced liquid solutions, data centers are achieving a 35% improvement in energy usage effectiveness, which directly drives operational carbon reduction and aligns with strict sustainability mandates.
  • Furthermore, specialized applications depend on this technology to sustain peak processing capacity; for instance, facilities utilizing liquid submersion experience a 20% increase in cryptocurrency mining hash rate due to minimized thermal throttling. These efficiency improvements allow organizations to scale computational output within a compact footprint, effectively mitigating the rising electricity costs associated with modern, ultra-dense digital infrastructure operations.

We can help! Our analysts can customize this immersion cooling market research report to meet your requirements.

Get in touch

1. Executive Summary

1.1 Market overview

Executive Summary - Chart on Market Overview
Executive Summary - Data Table on Market Overview
Executive Summary - Chart on Global Market Characteristics
Executive Summary - Chart on Market by Geography
Executive Summary - Chart on Market Segmentation by Type
Executive Summary - Chart on Market Segmentation by Application
Executive Summary - Chart on Market Segmentation by Component
Executive Summary - Chart on Incremental Growth
Executive Summary - Data Table on Incremental Growth
Executive Summary - Chart on Company Market Positioning

2. Technavio Analysis

2.1 Analysis of price sensitivity, lifecycle, customer purchase basket, adoption rates, and purchase criteria

2.2 Criticality of inputs and Factors of differentiation

Chart on Overview on criticality of inputs and factors of differentiation

2.3 Factors of disruption

Chart on Overview on factors of disruption

2.4 Impact of drivers and challenges

Chart on Impact of drivers and challenges in 2025 and 2030

3. Market Landscape

3.1 Market ecosystem

Chart on Parent Market
Data Table on - Parent Market

3.2 Market characteristics

Chart on Market characteristics analysis

3.3 Value chain analysis

Chart on Value chain analysis

4. Market Sizing

4.1 Market definition

Data Table on Offerings of companies included in the market definition

4.2 Market segment analysis

Market segments

4.3 Market size 2025

4.4 Market outlook: Forecast for 2025-2030

Chart on Global - Market size and forecast 2025-2030 ($ million)
Data Table on Global - Market size and forecast 2025-2030 ($ million)
Chart on Global Market: Year-over-year growth 2025-2030 (%)
Data Table on Global Market: Year-over-year growth 2025-2030 (%)

5. Historic Market Size

5.1 Global Immersion Cooling Market 2020 - 2024

Historic Market Size - Data Table on Global Immersion Cooling Market 2020 - 2024 ($ million)

5.2 Type segment analysis 2020 - 2024

Historic Market Size - Type Segment 2020 - 2024 ($ million)

5.3 Application segment analysis 2020 - 2024

Historic Market Size - Application Segment 2020 - 2024 ($ million)

5.4 Component segment analysis 2020 - 2024

Historic Market Size - Component Segment 2020 - 2024 ($ million)

5.5 Geography segment analysis 2020 - 2024

Historic Market Size - Geography Segment 2020 - 2024 ($ million)

5.6 Country segment analysis 2020 - 2024

Historic Market Size - Country Segment 2020 - 2024 ($ million)

6. Qualitative Analysis

6.1 Impact of AI on Global Immersion Cooling Market

6.2 Impact of Geopolitical Conflicts on Global Immersion Cooling Market

7. Five Forces Analysis

7.1 Five forces summary

Five forces analysis - Comparison between 2025 and 2030

7.2 Bargaining power of buyers

Bargaining power of buyers - Impact of key factors 2025 and 2030

7.3 Bargaining power of suppliers

Bargaining power of suppliers - Impact of key factors in 2025 and 2030

7.4 Threat of new entrants

Threat of new entrants - Impact of key factors in 2025 and 2030

7.5 Threat of substitutes

Threat of substitutes - Impact of key factors in 2025 and 2030

7.6 Threat of rivalry

Threat of rivalry - Impact of key factors in 2025 and 2030

7.7 Market condition

Chart on Market condition - Five forces 2025 and 2030

8. Market Segmentation by Type

8.1 Market segments

Chart on Type - Market share 2025-2030 (%)
Data Table on Type - Market share 2025-2030 (%)

8.2 Comparison by Type

Chart on Comparison by Type
Data Table on Comparison by Type

8.3 Single-phase immersion cooling - Market size and forecast 2025-2030

Chart on Single-phase immersion cooling - Market size and forecast 2025-2030 ($ million)
Data Table on Single-phase immersion cooling - Market size and forecast 2025-2030 ($ million)
Chart on Single-phase immersion cooling - Year-over-year growth 2025-2030 (%)
Data Table on Single-phase immersion cooling - Year-over-year growth 2025-2030 (%)

8.4 Two-phase immersion cooling - Market size and forecast 2025-2030

Chart on Two-phase immersion cooling - Market size and forecast 2025-2030 ($ million)
Data Table on Two-phase immersion cooling - Market size and forecast 2025-2030 ($ million)
Chart on Two-phase immersion cooling - Year-over-year growth 2025-2030 (%)
Data Table on Two-phase immersion cooling - Year-over-year growth 2025-2030 (%)

8.5 Market opportunity by Type

Market opportunity by Type ($ million)
Data Table on Market opportunity by Type ($ million)

9. Market Segmentation by Application

9.1 Market segments

Chart on Application - Market share 2025-2030 (%)
Data Table on Application - Market share 2025-2030 (%)

9.2 Comparison by Application

Chart on Comparison by Application
Data Table on Comparison by Application

9.3 High-performance computing - Market size and forecast 2025-2030

Chart on High-performance computing - Market size and forecast 2025-2030 ($ million)
Data Table on High-performance computing - Market size and forecast 2025-2030 ($ million)
Chart on High-performance computing - Year-over-year growth 2025-2030 (%)
Data Table on High-performance computing - Year-over-year growth 2025-2030 (%)

9.4 Edge computing - Market size and forecast 2025-2030

Chart on Edge computing - Market size and forecast 2025-2030 ($ million)
Data Table on Edge computing - Market size and forecast 2025-2030 ($ million)
Chart on Edge computing - Year-over-year growth 2025-2030 (%)
Data Table on Edge computing - Year-over-year growth 2025-2030 (%)

9.5 Cryptocurrency mining - Market size and forecast 2025-2030

Chart on Cryptocurrency mining - Market size and forecast 2025-2030 ($ million)
Data Table on Cryptocurrency mining - Market size and forecast 2025-2030 ($ million)
Chart on Cryptocurrency mining - Year-over-year growth 2025-2030 (%)
Data Table on Cryptocurrency mining - Year-over-year growth 2025-2030 (%)

9.6 Market opportunity by Application

Market opportunity by Application ($ million)
Data Table on Market opportunity by Application ($ million)

10. Market Segmentation by Component

10.1 Market segments

Chart on Component - Market share 2025-2030 (%)
Data Table on Component - Market share 2025-2030 (%)

10.2 Comparison by Component

Chart on Comparison by Component
Data Table on Comparison by Component

10.3 Solutions - Market size and forecast 2025-2030

Chart on Solutions - Market size and forecast 2025-2030 ($ million)
Data Table on Solutions - Market size and forecast 2025-2030 ($ million)
Chart on Solutions - Year-over-year growth 2025-2030 (%)
Data Table on Solutions - Year-over-year growth 2025-2030 (%)

10.4 Services - Market size and forecast 2025-2030

Chart on Services - Market size and forecast 2025-2030 ($ million)
Data Table on Services - Market size and forecast 2025-2030 ($ million)
Chart on Services - Year-over-year growth 2025-2030 (%)
Data Table on Services - Year-over-year growth 2025-2030 (%)

10.5 Market opportunity by Component

Market opportunity by Component ($ million)
Data Table on Market opportunity by Component ($ million)

11. Customer Landscape

11.1 Customer landscape overview

Analysis of price sensitivity, lifecycle, customer purchase basket, adoption rates, and purchase criteria

12. Geographic Landscape

12.1 Geographic segmentation

Chart on Market share by geography 2025-2030 (%)
Data Table on Market share by geography 2025-2030 (%)

12.2 Geographic comparison

Chart on Geographic comparison
Data Table on Geographic comparison

12.3 North America - Market size and forecast 2025-2030

Chart on North America - Market size and forecast 2025-2030 ($ million)
Data Table on North America - Market size and forecast 2025-2030 ($ million)
Chart on North America - Year-over-year growth 2025-2030 (%)
Data Table on North America - Year-over-year growth 2025-2030 (%)
Chart on Regional Comparison - North America
Data Table on Regional Comparison - North America

12.3.1 US - Market size and forecast 2025-2030

Chart on US - Market size and forecast 2025-2030 ($ million)
Data Table on US - Market size and forecast 2025-2030 ($ million)
Chart on US - Year-over-year growth 2025-2030 (%)
Data Table on US - Year-over-year growth 2025-2030 (%)

12.3.2 Canada - Market size and forecast 2025-2030

Chart on Canada - Market size and forecast 2025-2030 ($ million)
Data Table on Canada - Market size and forecast 2025-2030 ($ million)
Chart on Canada - Year-over-year growth 2025-2030 (%)
Data Table on Canada - Year-over-year growth 2025-2030 (%)

12.3.3 Mexico - Market size and forecast 2025-2030

Chart on Mexico - Market size and forecast 2025-2030 ($ million)
Data Table on Mexico - Market size and forecast 2025-2030 ($ million)
Chart on Mexico - Year-over-year growth 2025-2030 (%)
Data Table on Mexico - Year-over-year growth 2025-2030 (%)

12.4 Europe - Market size and forecast 2025-2030

Chart on Europe - Market size and forecast 2025-2030 ($ million)
Data Table on Europe - Market size and forecast 2025-2030 ($ million)
Chart on Europe - Year-over-year growth 2025-2030 (%)
Data Table on Europe - Year-over-year growth 2025-2030 (%)
Chart on Regional Comparison - Europe
Data Table on Regional Comparison - Europe

12.4.1 Germany - Market size and forecast 2025-2030

Chart on Germany - Market size and forecast 2025-2030 ($ million)
Data Table on Germany - Market size and forecast 2025-2030 ($ million)
Chart on Germany - Year-over-year growth 2025-2030 (%)
Data Table on Germany - Year-over-year growth 2025-2030 (%)

12.4.2 UK - Market size and forecast 2025-2030

Chart on UK - Market size and forecast 2025-2030 ($ million)
Data Table on UK - Market size and forecast 2025-2030 ($ million)
Chart on UK - Year-over-year growth 2025-2030 (%)
Data Table on UK - Year-over-year growth 2025-2030 (%)

12.4.3 France - Market size and forecast 2025-2030

Chart on France - Market size and forecast 2025-2030 ($ million)
Data Table on France - Market size and forecast 2025-2030 ($ million)
Chart on France - Year-over-year growth 2025-2030 (%)
Data Table on France - Year-over-year growth 2025-2030 (%)

12.4.4 The Netherlands - Market size and forecast 2025-2030

Chart on The Netherlands - Market size and forecast 2025-2030 ($ million)
Data Table on The Netherlands - Market size and forecast 2025-2030 ($ million)
Chart on The Netherlands - Year-over-year growth 2025-2030 (%)
Data Table on The Netherlands - Year-over-year growth 2025-2030 (%)

12.4.5 Sweden - Market size and forecast 2025-2030

Chart on Sweden - Market size and forecast 2025-2030 ($ million)
Data Table on Sweden - Market size and forecast 2025-2030 ($ million)
Chart on Sweden - Year-over-year growth 2025-2030 (%)
Data Table on Sweden - Year-over-year growth 2025-2030 (%)

12.4.6 Italy - Market size and forecast 2025-2030

Chart on Italy - Market size and forecast 2025-2030 ($ million)
Data Table on Italy - Market size and forecast 2025-2030 ($ million)
Chart on Italy - Year-over-year growth 2025-2030 (%)
Data Table on Italy - Year-over-year growth 2025-2030 (%)

12.5 APAC - Market size and forecast 2025-2030

Chart on APAC - Market size and forecast 2025-2030 ($ million)
Data Table on APAC - Market size and forecast 2025-2030 ($ million)
Chart on APAC - Year-over-year growth 2025-2030 (%)
Data Table on APAC - Year-over-year growth 2025-2030 (%)
Chart on Regional Comparison - APAC
Data Table on Regional Comparison - APAC

12.5.1 China - Market size and forecast 2025-2030

Chart on China - Market size and forecast 2025-2030 ($ million)
Data Table on China - Market size and forecast 2025-2030 ($ million)
Chart on China - Year-over-year growth 2025-2030 (%)
Data Table on China - Year-over-year growth 2025-2030 (%)

12.5.2 Japan - Market size and forecast 2025-2030

Chart on Japan - Market size and forecast 2025-2030 ($ million)
Data Table on Japan - Market size and forecast 2025-2030 ($ million)
Chart on Japan - Year-over-year growth 2025-2030 (%)
Data Table on Japan - Year-over-year growth 2025-2030 (%)

12.5.3 India - Market size and forecast 2025-2030

Chart on India - Market size and forecast 2025-2030 ($ million)
Data Table on India - Market size and forecast 2025-2030 ($ million)
Chart on India - Year-over-year growth 2025-2030 (%)
Data Table on India - Year-over-year growth 2025-2030 (%)

12.5.4 South Korea - Market size and forecast 2025-2030

Chart on South Korea - Market size and forecast 2025-2030 ($ million)
Data Table on South Korea - Market size and forecast 2025-2030 ($ million)
Chart on South Korea - Year-over-year growth 2025-2030 (%)
Data Table on South Korea - Year-over-year growth 2025-2030 (%)

12.5.5 Singapore - Market size and forecast 2025-2030

Chart on Singapore - Market size and forecast 2025-2030 ($ million)
Data Table on Singapore - Market size and forecast 2025-2030 ($ million)
Chart on Singapore - Year-over-year growth 2025-2030 (%)
Data Table on Singapore - Year-over-year growth 2025-2030 (%)

12.5.6 Australia - Market size and forecast 2025-2030

Chart on Australia - Market size and forecast 2025-2030 ($ million)
Data Table on Australia - Market size and forecast 2025-2030 ($ million)
Chart on Australia - Year-over-year growth 2025-2030 (%)
Data Table on Australia - Year-over-year growth 2025-2030 (%)

12.6 South America - Market size and forecast 2025-2030

Chart on South America - Market size and forecast 2025-2030 ($ million)
Data Table on South America - Market size and forecast 2025-2030 ($ million)
Chart on South America - Year-over-year growth 2025-2030 (%)
Data Table on South America - Year-over-year growth 2025-2030 (%)
Chart on Regional Comparison - South America
Data Table on Regional Comparison - South America

12.6.1 Brazil - Market size and forecast 2025-2030

Chart on Brazil - Market size and forecast 2025-2030 ($ million)
Data Table on Brazil - Market size and forecast 2025-2030 ($ million)
Chart on Brazil - Year-over-year growth 2025-2030 (%)
Data Table on Brazil - Year-over-year growth 2025-2030 (%)

12.6.2 Argentina - Market size and forecast 2025-2030

Chart on Argentina - Market size and forecast 2025-2030 ($ million)
Data Table on Argentina - Market size and forecast 2025-2030 ($ million)
Chart on Argentina - Year-over-year growth 2025-2030 (%)
Data Table on Argentina - Year-over-year growth 2025-2030 (%)

12.6.3 Chile - Market size and forecast 2025-2030

Chart on Chile - Market size and forecast 2025-2030 ($ million)
Data Table on Chile - Market size and forecast 2025-2030 ($ million)
Chart on Chile - Year-over-year growth 2025-2030 (%)
Data Table on Chile - Year-over-year growth 2025-2030 (%)

12.7 Middle East and Africa - Market size and forecast 2025-2030

Chart on Middle East and Africa - Market size and forecast 2025-2030 ($ million)
Data Table on Middle East and Africa - Market size and forecast 2025-2030 ($ million)
Chart on Middle East and Africa - Year-over-year growth 2025-2030 (%)
Data Table on Middle East and Africa - Year-over-year growth 2025-2030 (%)
Chart on Regional Comparison - Middle East and Africa
Data Table on Regional Comparison - Middle East and Africa

12.7.1 UAE - Market size and forecast 2025-2030

Chart on UAE - Market size and forecast 2025-2030 ($ million)
Data Table on UAE - Market size and forecast 2025-2030 ($ million)
Chart on UAE - Year-over-year growth 2025-2030 (%)
Data Table on UAE - Year-over-year growth 2025-2030 (%)

12.7.2 Saudi Arabia - Market size and forecast 2025-2030

Chart on Saudi Arabia - Market size and forecast 2025-2030 ($ million)
Data Table on Saudi Arabia - Market size and forecast 2025-2030 ($ million)
Chart on Saudi Arabia - Year-over-year growth 2025-2030 (%)
Data Table on Saudi Arabia - Year-over-year growth 2025-2030 (%)

12.7.3 South Africa - Market size and forecast 2025-2030

Chart on South Africa - Market size and forecast 2025-2030 ($ million)
Data Table on South Africa - Market size and forecast 2025-2030 ($ million)
Chart on South Africa - Year-over-year growth 2025-2030 (%)
Data Table on South Africa - Year-over-year growth 2025-2030 (%)

12.7.4 Israel - Market size and forecast 2025-2030

Chart on Israel - Market size and forecast 2025-2030 ($ million)
Data Table on Israel - Market size and forecast 2025-2030 ($ million)
Chart on Israel - Year-over-year growth 2025-2030 (%)
Data Table on Israel - Year-over-year growth 2025-2030 (%)

12.7.5 Qatar - Market size and forecast 2025-2030

Chart on Qatar - Market size and forecast 2025-2030 ($ million)
Data Table on Qatar - Market size and forecast 2025-2030 ($ million)
Chart on Qatar - Year-over-year growth 2025-2030 (%)
Data Table on Qatar - Year-over-year growth 2025-2030 (%)

12.8 Market opportunity by geography

Market opportunity by geography ($ million)
Data Tables on Market opportunity by geography ($ million)

13. Drivers, Challenges, and Opportunity

13.1 Market drivers

Rising processor and rack densities exceeding air-cooling capabilities
Intensifying focus on energy efficiency and sustainability
Demand for high-performance in rugged and edge environments

13.2 Market challenges

High initial capital expenditure and total cost of ownership uncertainty
Lack of standardization and undeveloped ecosystem
Operational complexity and technical skills gap

13.3 Impact of drivers and challenges

Impact of drivers and challenges in 2025 and 2030

13.4 Market opportunities

Development of advanced and sustainable dielectric fluids
Increasing collaboration and availability of immersion-ready IT hardware
Shift toward integrated, turnkey, and modular solutions

14. Competitive Landscape

14.1 Overview

14.2

Overview on criticality of inputs and factors of differentiation

14.3 Landscape disruption

Overview on factors of disruption

14.4 Industry risks

Impact of key risks on business

15. Competitive Analysis

15.1 Companies profiled

Companies covered

15.2 Company ranking index

15.3 Market positioning of companies

Matrix on companies position and classification

15.4 3M Co.

3M Co. - Overview
3M Co. - Business segments
3M Co. - Key news
3M Co. - Key offerings
3M Co. - Segment focus
SWOT

15.5 Cargill Inc.

Cargill Inc. - Overview
Cargill Inc. - Product / Service
Cargill Inc. - Key news
Cargill Inc. - Key offerings
SWOT

15.6 Castrol Ltd.

Castrol Ltd. - Overview
Castrol Ltd. - Product / Service
Castrol Ltd. - Key offerings
SWOT

15.7 Dow Chemical Co.

Dow Chemical Co. - Overview
Dow Chemical Co. - Business segments
Dow Chemical Co. - Key offerings
Dow Chemical Co. - Segment focus
SWOT

15.8 DUG Technology Ltd.

DUG Technology Ltd. - Overview
DUG Technology Ltd. - Product / Service
DUG Technology Ltd. - Key offerings
SWOT

15.9 Exxon Mobil Corp.

Exxon Mobil Corp. - Overview
Exxon Mobil Corp. - Business segments
Exxon Mobil Corp. - Key offerings
Exxon Mobil Corp. - Segment focus
SWOT

15.10 Fujitsu Ltd.

Fujitsu Ltd. - Overview
Fujitsu Ltd. - Business segments
Fujitsu Ltd. - Key offerings
Fujitsu Ltd. - Segment focus
SWOT

15.11 Google LLC

Google LLC - Overview
Google LLC - Product / Service
Google LLC - Key offerings
SWOT

15.12 Hewlett Packard Enterprise Co.

Hewlett Packard Enterprise Co. - Overview
Hewlett Packard Enterprise Co. - Business segments
Hewlett Packard Enterprise Co. - Key news
Hewlett Packard Enterprise Co. - Key offerings
Hewlett Packard Enterprise Co. - Segment focus
SWOT

15.13 Intel Corp.

Intel Corp. - Overview
Intel Corp. - Business segments
Intel Corp. - Key news
Intel Corp. - Key offerings
Intel Corp. - Segment focus
SWOT

15.14 Microsoft Corp.

Microsoft Corp. - Overview
Microsoft Corp. - Business segments
Microsoft Corp. - Key news
Microsoft Corp. - Key offerings
Microsoft Corp. - Segment focus
SWOT

15.15 NVIDIA Corp.

NVIDIA Corp. - Overview
NVIDIA Corp. - Business segments
NVIDIA Corp. - Key news
NVIDIA Corp. - Key offerings
NVIDIA Corp. - Segment focus
SWOT

15.16 Rittal GmbH and Co. KG

Rittal GmbH and Co. KG - Overview
Rittal GmbH and Co. KG - Product / Service
Rittal GmbH and Co. KG - Key offerings
SWOT

15.17 Schneider Electric SE

Schneider Electric SE - Overview
Schneider Electric SE - Business segments
Schneider Electric SE - Key news
Schneider Electric SE - Key offerings
Schneider Electric SE - Segment focus
SWOT

15.18 Shell plc

Shell plc - Overview
Shell plc - Business segments
Shell plc - Key offerings
Shell plc - Segment focus
SWOT

16. Appendix

16.1 Scope of the report

Market definition
Objectives
Notes and caveats

16.2 Inclusions and exclusions checklist

Inclusions checklist
Exclusions checklist

16.3 Currency conversion rates for US$

16.4 Research methodology

16.5 Data procurement

Information sources

16.6 Data validation

16.7 Validation techniques employed for market sizing

16.8 Data synthesis

16.9 360 degree market analysis

16.10 List of abbreviations

Research Methodology

Technavio presents a detailed picture of the market by way of study, synthesis, and summation of data from multiple sources. The analysts have presented the various facets of the market with a particular focus on identifying the key industry influencers. The data thus presented is comprehensive, reliable, and the result of extensive research, both primary and secondary.

INFORMATION SOURCES

Primary sources

  • Manufacturers and suppliers
  • Channel partners
  • Industry experts
  • Strategic decision makers

Secondary sources

  • Industry journals and periodicals
  • Government data
  • Financial reports of key industry players
  • Historical data
  • Press releases

DATA ANALYSIS

Data Synthesis

  • Collation of data
  • Estimation of key figures
  • Analysis of derived insights

Data Validation

  • Triangulation with data models
  • Reference against proprietary databases
  • Corroboration with industry experts

REPORT WRITING

Qualitative

  • Market drivers
  • Market challenges
  • Market trends
  • Five forces analysis

Quantitative

  • Market size and forecast
  • Market segmentation
  • Geographical insights
  • Competitive landscape

Interested in this report?

Get your sample now to see our research methodology and insights!

Download Now

Frequently Asked Questions

Immersion Cooling market growth will increase by USD 1448.7 million during 2026-2030.

The Immersion Cooling market is expected to grow at a CAGR of 27.9% during 2026-2030.

Immersion Cooling market is segmented by Type (Single-phase immersion cooling, Two-phase immersion cooling) Application (High-performance computing, Edge computing, Cryptocurrency mining) Component (Solutions, Services)

3M Co., Asperitas, Cargill Inc., Castrol Ltd., Coolit Systems, Dow Chemical Co., DUG Technology Ltd., Exxon Mobil Corp., Fujitsu Ltd., Google LLC, Green Revolution Cooling Inc., Hewlett Packard Enterprise Co., Intel Corp., Microsoft Corp., NVIDIA Corp., Rittal GmbH and Co. KG, Schneider Electric SE, Shell plc, STULZ GmbH, Super Micro Computer Inc. are a few of the key vendors in the Immersion Cooling market.

North America will register the highest growth rate of 42.3% among the other regions. Therefore, the Immersion Cooling market in North America is expected to garner significant business opportunities for the vendors during the forecast period.

US, Canada, Mexico, Germany, UK, France, The Netherlands, Sweden, Italy, China, Japan, India, South Korea, Singapore, Australia, Brazil, Argentina, Chile, UAE, Saudi Arabia, South Africa, Israel, Qatar

  • Rising processor and rack densities exceeding air-cooling capabilities is the driving factor this market.

The Immersion Cooling market vendors should focus on grabbing business opportunities from the Type segment as it accounted for the largest market share in the base year.
RIA - Research AI Assistant
Ask RIA
