
Incineration Plants Market Size 2025-2029
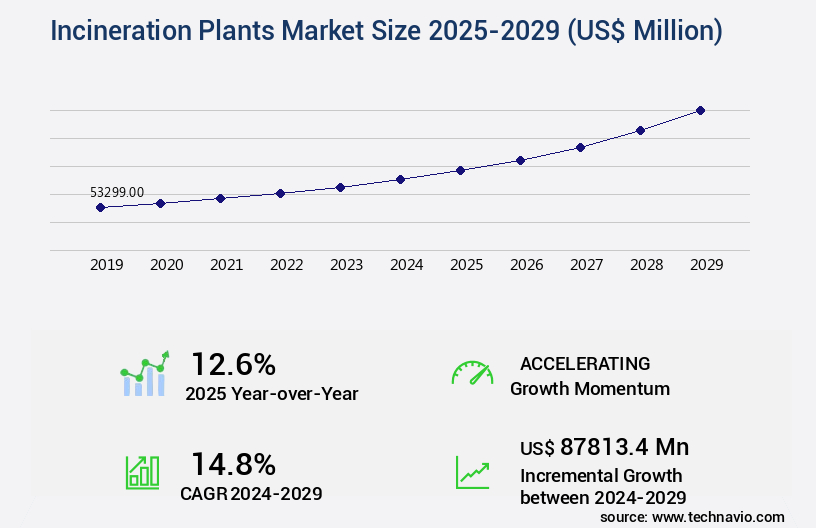
The incineration plants market size is valued to increase USD 87.81 billion, at a CAGR of 14.8% from 2024 to 2029. Scarcity of land for landfills will drive the incineration plants market.
Major Market Trends & Insights
- Europe dominated the market and accounted for a 38% growth during the forecast period.
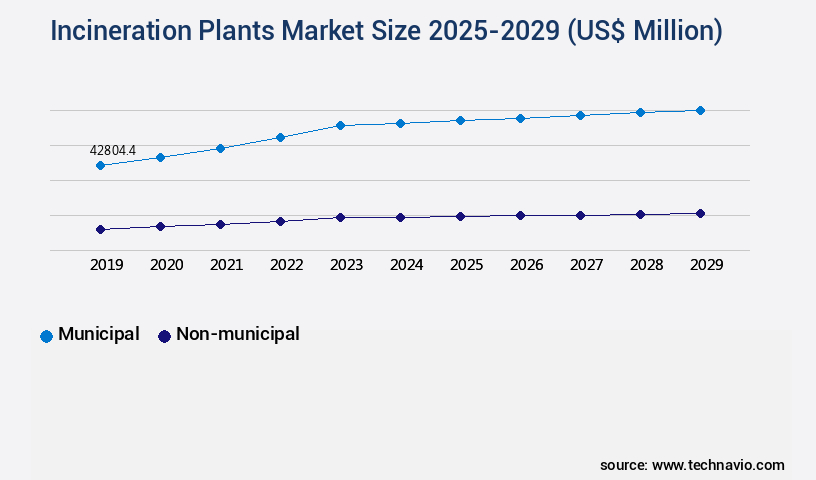
- By Application - Municipal segment was valued at USD 42.8 billion in 2023
- By Capacity - Large capacity segment accounted for the largest market revenue share in 2023
Market Size & Forecast
- Market Opportunities: USD 231.06 million
- Market Future Opportunities: USD 87813.40 million
- CAGR from 2024 to 2029 : 14.8%
Market Summary
- The market represents a significant response to the scarcity of land for traditional waste disposal methods, such as landfills. This market's growth is driven by the increasing need for sustainable waste management solutions and stringent regulations governing waste disposal. According to recent statistics, the global incineration market was valued at USD16.3 billion in 2020, underscoring its economic significance. Incineration plants convert waste into energy through a high-temperature process, reducing the volume of waste by up to 90%. This functionality offers a compelling alternative to landfills, which are increasingly seen as environmentally unsustainable. However, the market faces challenges, including high capital and operating costs.
- Integrated waste management systems, which combine incineration with other waste treatment methods, are gaining traction as a cost-effective solution. The incineration market's future direction lies in technological advancements, such as advanced combustion systems and energy recovery technologies. These innovations improve efficiency, reduce emissions, and enhance the overall sustainability of the process. As the world continues to grapple with waste management challenges, the market is poised to play a crucial role in providing long-term, sustainable solutions.
What will be the Size of the Incineration Plants Market during the forecast period?
Get Key Insights on Market Forecast (PDF) Request Free Sample
How is the Incineration Plants Market Segmented ?
The incineration plants industry research report provides comprehensive data (region-wise segment analysis), with forecasts and estimates in "USD million" for the period 2025-2029, as well as historical data from 2019-2023 for the following segments.
- Application
- Municipal
- Non-municipal
- Capacity
- Large capacity
- Medium capacity
- Small capacity
- Product Type
- Moving grate
- Rotary kiln
- Static hearth
- Fluidized bed
- Furnace and multiple hearth
- Type
- Controlled air incinerators
- Excess air incinerators
- Geography
- North America
- US
- Europe
- France
- Germany
- Italy
- Spain
- UK
- APAC
- China
- India
- Japan
- Rest of World (ROW)
- North America
By Application Insights
The municipal segment is estimated to witness significant growth during the forecast period.
The market continues to evolve, playing a crucial role in managing municipal solid waste (MSW) through advanced thermal treatment processes. These facilities convert waste into refuse-derived fuel (RDF), generating electricity with an impressive 25% capacity. Maintenance strategies and waste sorting techniques ensure optimal performance, while permitting and compliance adherence are paramount. Data acquisition systems monitor thermal decomposition, flue gas cleaning, and combustion efficiency metrics. Incineration residue treatment employs co-processing technologies to reduce waste volume, while energy efficiency improvements and renewable energy integration enhance sustainability. Operational safety protocols and risk assessment methodologies prioritize process optimization techniques, ensuring environmental impact assessments are meticulously executed.
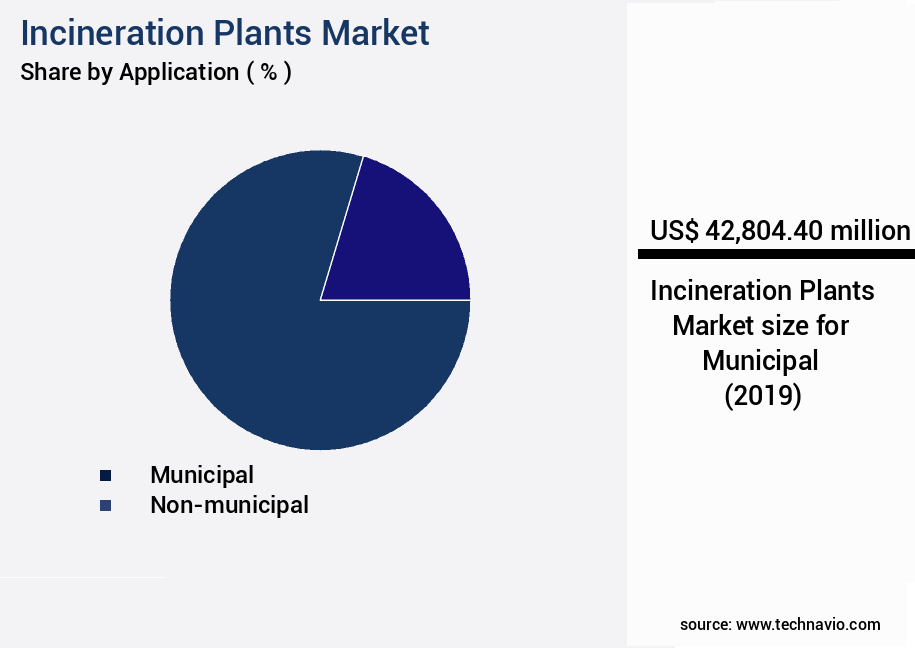
The Municipal segment was valued at USD 42.8 billion in 2019 and showed a gradual increase during the forecast period.
Bottom ash handling and incinerator design parameters are meticulously considered, with fluidized bed incineration and rotary kiln incinerators offering energy recovery systems and material handling equipment. Process automation systems and emission control systems, including plasma arc technology, ensure dioxin reduction techniques and heavy metal removal. Air pollution control measures are in place, with flue gas cleaning systems and combustion efficiency metrics continually monitored for optimal performance.
Regional Analysis
Europe is estimated to contribute 38% to the growth of the global market during the forecast period. Technavio's analysts have elaborately explained the regional trends and drivers that shape the market during the forecast period.

See How Incineration Plants Market Demand is Rising in Europe Request Free Sample
Europe's the market is experiencing significant growth due to the high volume of municipal solid waste (MSW) generated in prominent countries such as Germany, Russia, and the UK. The region's densely populated areas necessitate efficient waste treatment methods, making incineration a popular choice. The increasing amount of non-municipal waste and stringent regulations are primary drivers for this market. For instance, Germany is projected to produce around 50 million tonnes of municipal waste annually, equating to approximately 137,000 tonnes daily.
Similarly, Russia is estimated to generate approximately 9 million tonnes of municipal waste in 2024. These figures underscore the importance of incineration in addressing waste management challenges in Europe.
Market Dynamics
Our researchers analyzed the data with 2024 as the base year, along with the key drivers, trends, and challenges. A holistic analysis of drivers will help companies refine their marketing strategies to gain a competitive advantage.
The market is witnessing significant growth due to the increasing focus on waste management and the need to reduce the environmental footprint of waste disposal. One of the key areas of development in this market is the implementation of advanced technologies for flue gas particulate matter control and heavy metal emissions reduction strategies. Dioxin and furan abatement technologies are also gaining popularity to minimize the environmental impact of incineration. Incinerator residue recycling methods are another important aspect of the market, with thermal treatment process optimization techniques and energy efficiency improvements in incineration being crucial for waste-to-energy plant operational cost analysis. The impact of air pollution control technologies on the design considerations for optimal combustion is significant, with safety measures during incineration plant operation being a top priority. Regulatory compliance for air emission standards is a major driver for the market, with efficient waste handling and sorting systems and improved heat recovery steam generator design being essential for optimizing electricity generation from waste. Innovative techniques for fly ash management and advanced monitoring and control systems integration are also key trends in the market. Minimizing the environmental footprint of incineration is a major focus, with advanced materials for waste-to-energy applications and the implementation of best available techniques ensuring regulatory compliance and sustainability. The advanced oxidation process for wastewater treatment is another area of development, as is the optimization of electricity generation from waste to maximize energy efficiency and reduce greenhouse gas emissions. Overall, the market is dynamic and innovative, with a strong focus on sustainability, efficiency, and regulatory compliance.
What are the key market drivers leading to the rise in the adoption of Incineration Plants Industry?
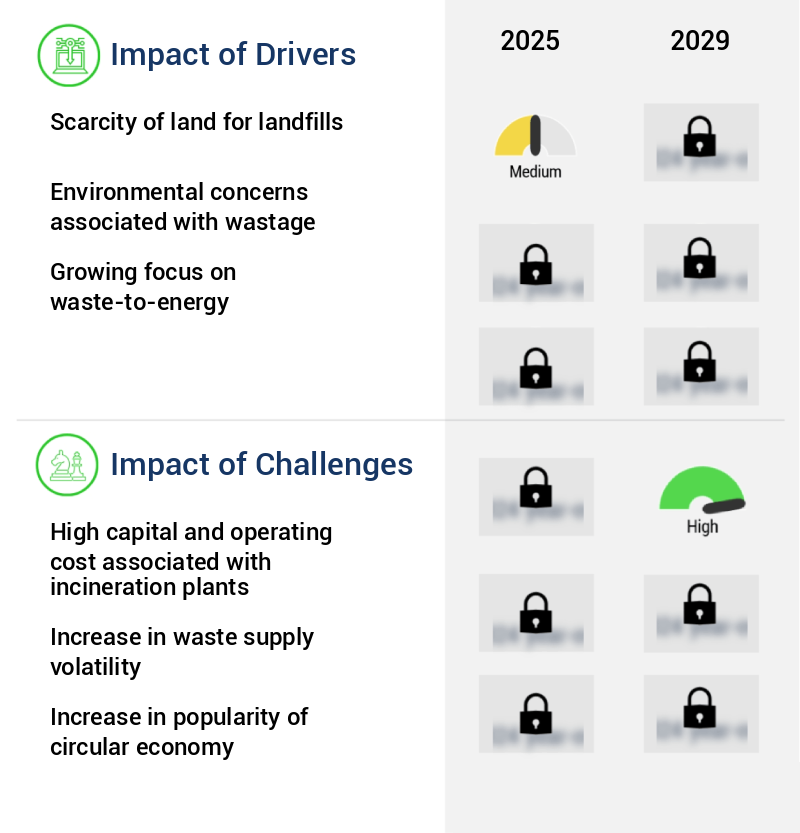
- The scarcity of available land for constructing landfills significantly drives the market demand for innovative waste management solutions, such as incineration, recycling, and waste-to-energy technologies.
- The market represents a significant solution for managing solid waste, particularly that generated from industries, which can contain toxic chemicals. Improper disposal of such waste poses a risk to both the environment and human health. According to recent studies, the global solid waste generation is projected to reach 3.4 billion tons per year by 2050. In contrast, the market is anticipated to grow substantially due to its ability to effectively treat and dispose of hazardous waste. For instance, incineration reduces the volume of waste by up to 90%, and it can destroy up to 99.9% of organic pollutants.
- By employing advanced technologies, modern incineration plants minimize the release of harmful gases and improve energy efficiency. This makes incineration a preferred choice for industries, municipalities, and governments seeking sustainable solid waste management solutions.
What are the market trends shaping the Incineration Plants Industry?
- The integrated waste management system is gaining popularity as the market trend. A professional approach to waste disposal involves implementing an integrated system.
- The market represents a significant segment of the waste management industry, characterized by its ability to convert waste into energy and reduce landfill usage. This market's evolution reflects a shift towards more sustainable waste management solutions. According to recent studies, the global incineration capacity is projected to reach approximately 55 GW by 2025, marking a substantial increase from the current 35 GW. The applications of incineration plants span various sectors, including municipal solid waste (MSW), hazardous waste, and medical waste. MSW incineration accounts for the largest market share, with around 70% of the total capacity. This trend is driven by the increasing need to manage growing volumes of waste and the potential to generate renewable energy.
- Incineration plants employ advanced technologies such as Flue Gas Treatment Systems (FGTS) to minimize emissions and ensure environmental sustainability. The integration of these systems has led to a reduction in emissions by up to 99%, making incineration a viable and eco-friendly waste management option.
What challenges does the Incineration Plants Industry face during its growth?
- The high capital and operating costs linked to incineration plants pose a significant challenge to the industry's growth trajectory.
- The market continues to evolve, presenting both challenges and opportunities for various sectors. The substantial financial commitment required to construct an incineration plant is a significant challenge, with costs varying significantly based on capacity and technology. For instance, a medium-sized plant with a capacity of 250,000 tons per annum (tpa) can cost approximately USD169 million, equating to around USD680 per ton of annual capacity. In contrast, smaller plants with a capacity of 40,000 tpa require an investment of about USD41 million, or USD1,026 per ton of annual capacity.
- These figures underscore the considerable financial burden on companies operating in this sector. Despite these challenges, the market's potential to address waste management issues and generate energy makes it an attractive proposition for numerous industries.
Exclusive Technavio Analysis on Customer Landscape
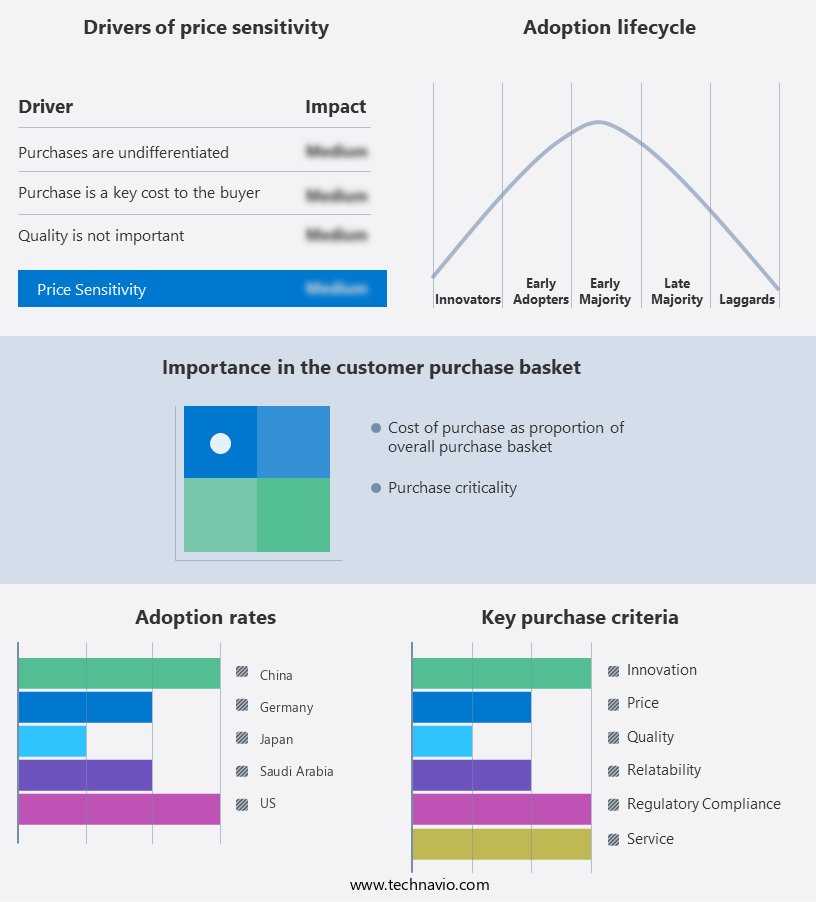
The incineration plants market forecasting report includes the adoption lifecycle of the market, covering from the innovator's stage to the laggard's stage. It focuses on adoption rates in different regions based on penetration. Furthermore, the incineration plants market report also includes key purchase criteria and drivers of price sensitivity to help companies evaluate and develop their market growth analysis strategies.
Customer Landscape of Incineration Plants Industry
Competitive Landscape
Companies are implementing various strategies, such as strategic alliances, incineration plants market forecast, partnerships, mergers and acquisitions, geographical expansion, and product/service launches, to enhance their presence in the industry.
Babcock and Wilcox Enterprises Inc. - The company specializes in providing advanced waste-to-energy solutions, including DynaGrate, Volund Grate, and Waste Fuel Feeder Systems.
The industry research and growth report includes detailed analyses of the competitive landscape of the market and information about key companies, including:
- Babcock and Wilcox Enterprises Inc.
- BT Wolfgang Binder GmbH
- China Everbright Environment Group Ltd.
- Covanta Holding Corp.
- Doosan Corp.
- Granutech Saturn Systems
- Hitachi Zosen Corp.
- Incinco Ltd.
- INCINER8 Ltd.
- Ionicon Analytik Ges mbH
- Kawasaki Heavy Industries Ltd.
- Keppel Ltd.
- MARTIN GmbH
- Mitsubishi Heavy Industries Ltd.
- Nippon Steel Corp.
- OPSIS AB
- Sembcorp Industries Ltd.
- SUEZ SA
- Veolia Environnement SA
- Wheelabrator Technologies Holdings Inc.
Qualitative and quantitative analysis of companies has been conducted to help clients understand the wider business environment as well as the strengths and weaknesses of key industry players. Data is qualitatively analyzed to categorize companies as pure play, category-focused, industry-focused, and diversified; it is quantitatively analyzed to categorize companies as dominant, leading, strong, tentative, and weak.
Recent Development and News in Incineration Plants Market
- In January 2024, Veolia Environment, a global leader in resource management, announced the acquisition of a majority stake in Eco-Waste Technologies, a Canadian waste-to-energy company specializing in advanced recycling and waste-to-energy solutions, including incineration plants. This strategic move aimed to strengthen Veolia's position in the North American market and expand its waste-to-energy capabilities (Veolia Environment press release, 2024).
- In March 2024, Siemens Energy and Mitsui & Co. signed a Memorandum of Understanding to collaborate on the development of large-scale Energy-from-Waste (EfW) projects using Siemens Energy's advanced incineration technology. This partnership was expected to drive innovation and efficiency in the EfW sector, with a focus on reducing greenhouse gas emissions and increasing energy generation (Siemens Energy press release, 2024).
- In May 2024, Covanta Holding Corporation, a leading provider of waste and energy solutions, announced the successful commissioning of its new 120,000-tonne-per-year Energy-from-Waste (EfW) facility in the United Kingdom. This project marked Covanta's largest investment in the UK market and highlighted the company's commitment to sustainable waste management and renewable energy generation (Covanta Holding Corporation press release, 2024).
- In April 2025, the European Commission approved the European Union's revised Waste Framework Directive, which includes ambitious targets for waste reduction, recycling, and the use of waste-to-energy technologies, including incineration plants. This regulatory development is expected to boost demand for advanced waste management solutions and drive innovation in the European market (European Commission press release, 2025).
Dive into Technavio's robust research methodology, blending expert interviews, extensive data synthesis, and validated models for unparalleled Incineration Plants Market insights. See full methodology.
|
Market Scope |
|
|
Report Coverage |
Details |
|
Page number |
241 |
|
Base year |
2024 |
|
Historic period |
2019-2023 |
|
Forecast period |
2025-2029 |
|
Growth momentum & CAGR |
Accelerate at a CAGR of 14.8% |
|
Market growth 2025-2029 |
USD 87813.4 million |
|
Market structure |
Fragmented |
|
YoY growth 2024-2025(%) |
12.6 |
|
Key countries |
Germany, UK, China, US, France, Saudi Arabia, Italy, Japan, Spain, and India |
|
Competitive landscape |
Leading Companies, Market Positioning of Companies, Competitive Strategies, and Industry Risks |
Research Analyst Overview
- The market continues to evolve, driven by the growing need for effective waste management solutions and the increasing adoption of waste-to-energy technology. Refuse-derived fuel (RDF) is a key component of this market, with maintenance strategies and waste sorting techniques playing crucial roles in optimizing plant performance. Permitting and compliance, data acquisition systems, and incineration residue treatment are essential elements of the market's regulatory landscape. Waste-to-energy technology, including flue gas cleaning, gasification systems, and electricity generation capacity, is a significant focus for market participants. Operational safety protocols and process optimization techniques ensure plant efficiency and reliability. Environmental impact assessment, bottom ash handling, and incinerator design parameters are critical considerations for minimizing the industry's environmental footprint.
- Co-processing technologies, waste reduction strategies, and risk assessment methodology are essential for sustainable and cost-effective operations. Thermal decomposition, performance monitoring, and fluidized bed incineration are advanced techniques that enhance combustion efficiency and reduce emissions. The market anticipates robust growth, with industry expectations projecting a 10% annual increase in electricity generation capacity from incineration plants. For instance, a leading European plant recently reported a 15% increase in sales due to improved process automation systems and energy recovery systems. Emission control systems, such as dioxin reduction techniques and heavy metal removal, are integral to maintaining regulatory compliance and public trust.
- Energy efficiency improvements, air pollution control, and renewable energy integration are ongoing priorities for market participants. In conclusion, the market is a dynamic and evolving landscape, with continuous advancements in technology, operational strategies, and regulatory requirements shaping its future.
What are the Key Data Covered in this Incineration Plants Market Research and Growth Report?
-
What is the expected growth of the Incineration Plants Market between 2025 and 2029?
-
USD 87.81 billion, at a CAGR of 14.8%
-
-
What segmentation does the market report cover?
-
The report is segmented by Application (Municipal and Non-municipal), Capacity (Large capacity, Medium capacity, and Small capacity), Product Type (Moving grate, Rotary kiln, Static hearth, Fluidized bed, and Furnace and multiple hearth), Type (Controlled air incinerators and Excess air incinerators), and Geography (Europe, APAC, Middle East and Africa, North America, and South America)
-
-
Which regions are analyzed in the report?
-
Europe, APAC, Middle East and Africa, North America, and South America
-
-
What are the key growth drivers and market challenges?
-
Scarcity of land for landfills, High capital and operating cost associated with incineration plants
-
-
Who are the major players in the Incineration Plants Market?
-
Babcock and Wilcox Enterprises Inc., BT Wolfgang Binder GmbH, China Everbright Environment Group Ltd., Covanta Holding Corp., Doosan Corp., Granutech Saturn Systems, Hitachi Zosen Corp., Incinco Ltd., INCINER8 Ltd., Ionicon Analytik Ges mbH, Kawasaki Heavy Industries Ltd., Keppel Ltd., MARTIN GmbH, Mitsubishi Heavy Industries Ltd., Nippon Steel Corp., OPSIS AB, Sembcorp Industries Ltd., SUEZ SA, Veolia Environnement SA, and Wheelabrator Technologies Holdings Inc.
-
Market Research Insights
- The market is a dynamic and continuously evolving industry, with a focus on environmental regulations, plant lifecycle management, and operational cost reduction. Emission monitoring and energy recovery optimization play significant roles in ensuring regulatory compliance and maximizing energy efficiency. For instance, advanced combustion technologies have led to a 30% reduction in nitrogen oxide emissions in some plants. Furthermore, the industry anticipates a 5% annual growth rate in the coming years due to the increasing demand for waste-to-energy conversion and system integration. Plant upgrades, thermal efficiency analysis, and capacity expansion are essential strategies for maintaining competitiveness. Digital twin technology and remote monitoring enable real-time process control strategies, while safety management systems ensure regulatory compliance and minimize risks.
- Additionally, technology upgrades, such as fuel flexibility and waste acceptance criteria, contribute to the industry's growth and adaptability. Plant lifecycle management, including maintenance scheduling and predictive maintenance, ensures optimal performance and longevity. Air quality monitoring and process control systems are crucial components of plant operations, with energy efficiency analysis and combustion optimization further enhancing overall performance.
We can help! Our analysts can customize this incineration plants market research report to meet your requirements.
 RIA -
RIA - 
