
India Contract Research And Manufacturing Service Market Size 2025-2029
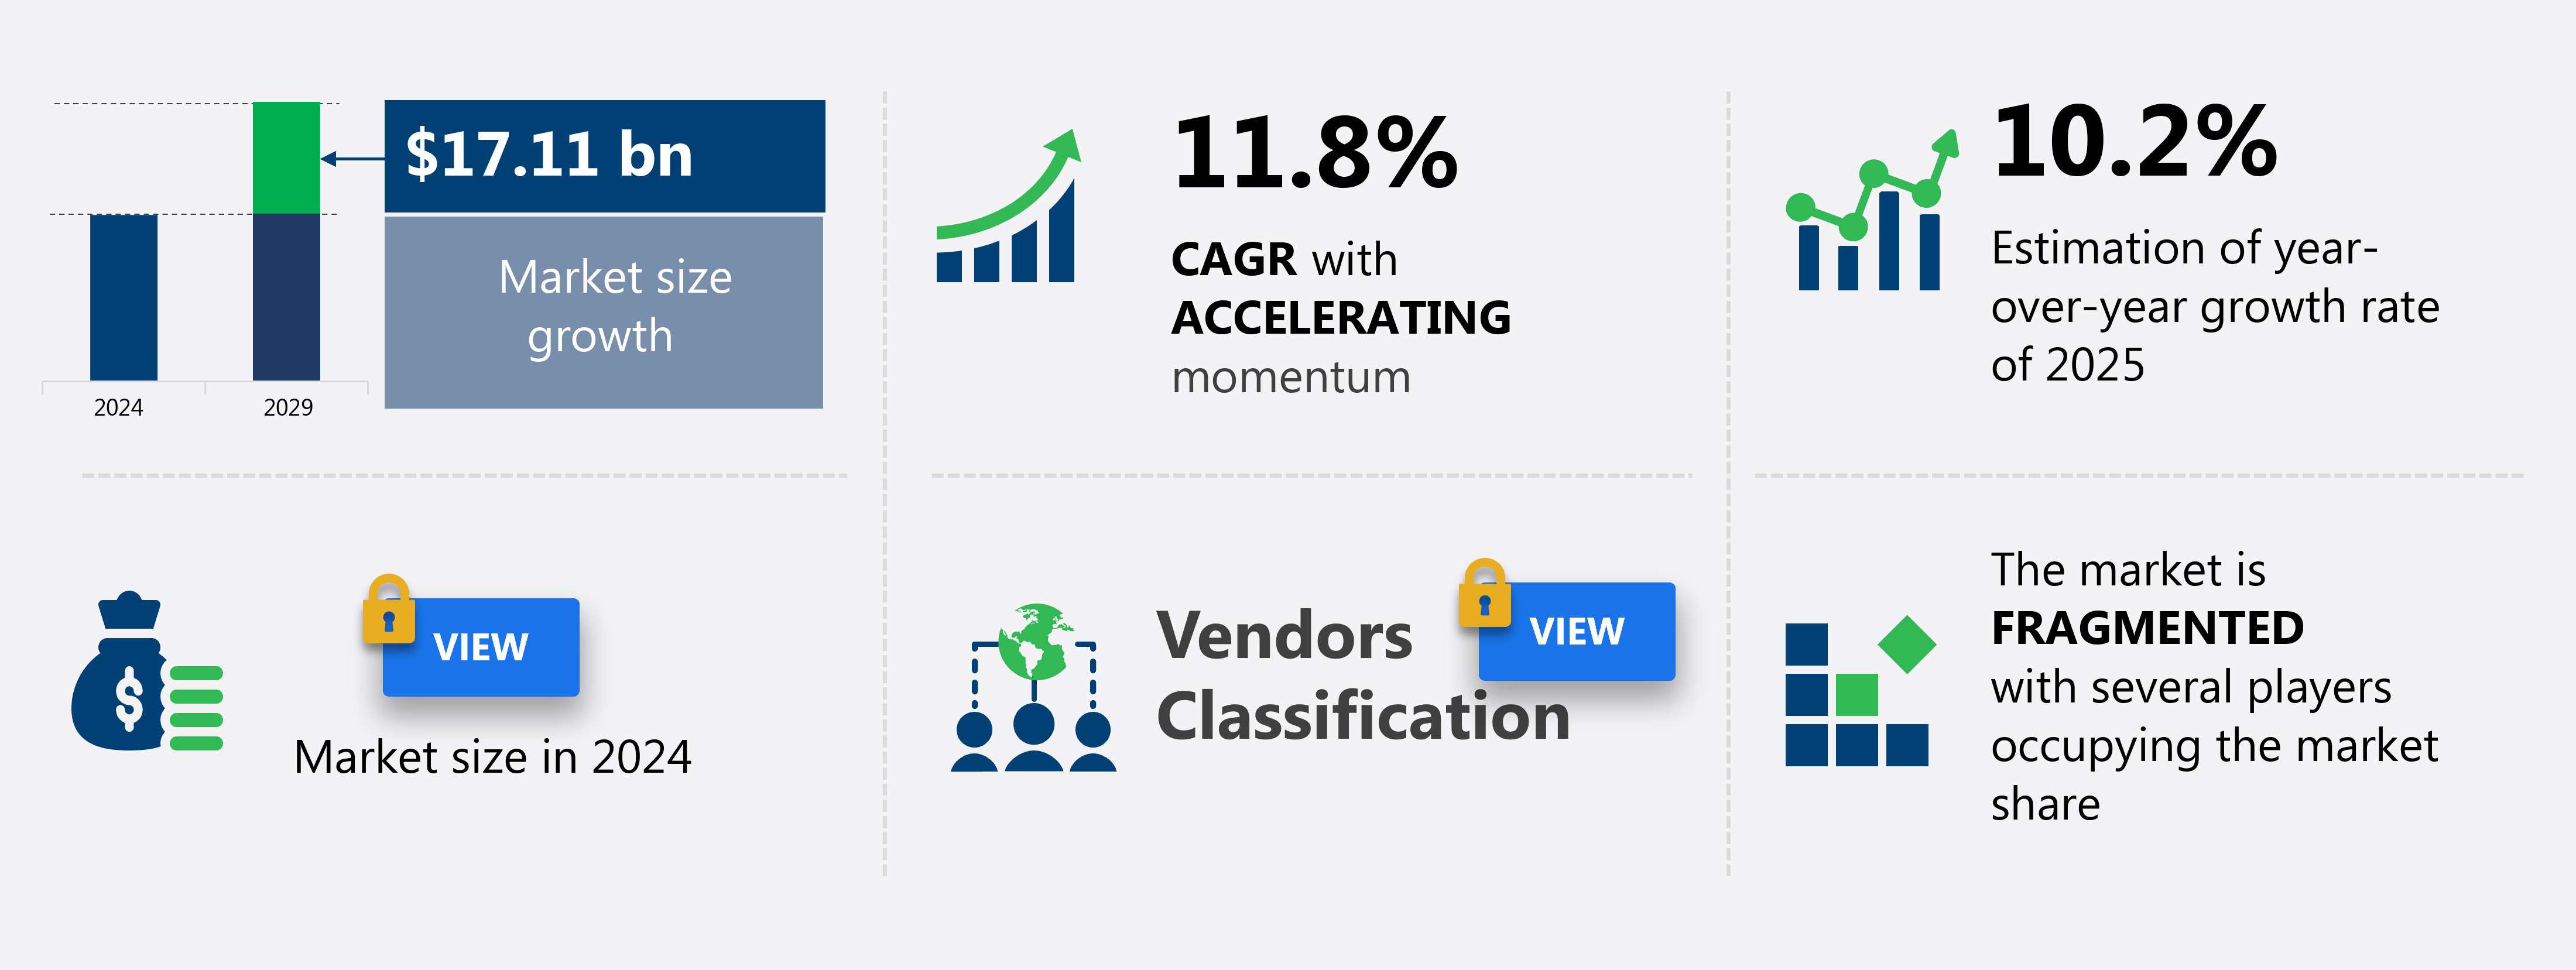
The contract research and manufacturing service (CRAMS) market size in India is forecast to increase by USD 17.11 billion at a CAGR of 11.8% between 2024 and 2029.
- The market is experiencing significant growth due to the diverse range of offerings by providers, catering to the unique requirements of the pharmaceutical, biotechnology, and biotech industries. Technological advancements, particularly AI-driven solutions, are playing a pivotal role in enhancing CRAMS capabilities, enabling efficient, cost-effective, and data-driven solutions for clients. AI integration streamlines drug development processes and improves precision in manufacturing. Stringent regulatory compliance requirements continue to challenge CRAMS providers, necessitating investments in state-of-the-art technologies and adherence to international standards. Incorporating these trends into business strategies will be crucial for CRAMS market participants to maintain a competitive edge and cater to the evolving needs of their clients.
What will be the size of the market During the Forecast Period?
- The Contract Research and Manufacturing Services (CRAMS) market encompasses a range of offerings, including manufacturing services for drug products and research services for pharmaceutical and biotechnology companies. This sector plays a crucial role In the R&D pipeline, enabling sponsors to outsource various stages of drug development, from preclinical research to clinical trials and physical characterization services. Academic institutes and Contract Research Organizations (CROs) are significant contributors to this market, providing expertise in project management, patient recruitment, and clinical trial execution. The CRAMS market is experiencing significant growth due to the increasing trend towards outsourcing and the rising demand for precision/personalized medicine.
- The development pipeline for new drugs and treatments continues to expand, fueling the need for reliable and efficient CRAMS providers. Overall, the CRAMS market is a dynamic and essential component of the pharmaceutical industry, facilitating the advancement of new drug products and contributing to the improvement of patient care.
How is this market segmented and which is the largest segment?
The market research report provides comprehensive data (region-wise segment analysis), with forecasts and estimates in "USD million" for the period 2025-2029, as well as historical data from 2019-2023 for the following segments.
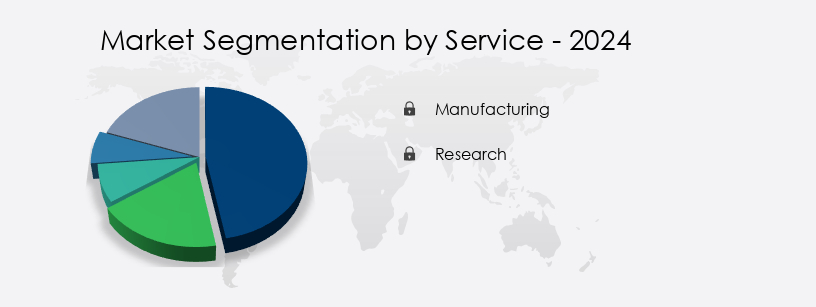
- Service
- Manufacturing
- Research
- Therapeutic Area
- Cardiovascular
- Infectious disease
- Endocrine disease
- Oncology
- Others
- End-user
- Pharmaceutical and biopharmaceutical companies
- Medical device companies
- Academic and research institutes
- Technology
- Bioinformatics
- Combinatorial chemistry
- High-throughput screening
- Spectroscopy
- Others
- Geography
- India
By Service Insights
- The manufacturing segment is estimated to witness significant growth during the forecast period.
The Contract Research and Manufacturing Services (CRAMS) market in India encompasses research services and manufacturing services for pharmaceutical and biotechnology companies. The manufacturing segment dominates this market due to the outsourcing trend In the pharmaceutical industry. Advancements in medical sciences and the increasing adoption of specialty medicines, including those with short half-lives, necessitate more complex manufacturing processes such as closed molding, open molding, and cast polymer molding. CMOs (Contract Manufacturing Organizations) produce drugs, vaccines, and healthcare products on a contract basis, catering to the needs of sponsors in various therapeutic areas, including oncology, infectious diseases, CVS disorders, neurology, vaccines, metabolic disorders/endocrinology, immunological disorders, psychiatry, respiratory disorders, dermatology, ophthalmology, gastrointestinal diseases, hematology, and pharma R&D.
Project management, drug development, clinical research services, laboratory services, consulting services, data management services, preclinical services, pharmacokinetics/pharmacodynamics services, toxicology testing services, analytical testing services, physical characterization services, and stability testing services are essential components of the CRAMS market. The integration of artificial intelligence (AI) and precision/personalized medicine in drug development further enhances the market's growth prospects. The CRAMS market caters to various sectors, including academia, biotechnology, and pharmaceutical companies, and offers a range of services to support the R&D pipeline, patient recruitment, clinical trials, and CVS disorders.
Get a glance at the market report of share of various segments Request Free Sample
Market Dynamics
Our India Contract Research And Manufacturing Service (CRAMS) Market researchers analyzed the data with 2024 as the base year, along with the key drivers, trends, and challenges. A holistic analysis of drivers will help companies refine their marketing strategies to gain a competitive advantage.
What are the key market drivers leading to the rise in adoption of India Contract Research And Manufacturing Service (CRAMS) Market?
Diverse range of service offerings by CRAMS providers is the key driver of the market.
- The CRAMS market in India experiences significant growth due to the extensive range of services provided, encompassing research and manufacturing stages of the drug development lifecycle. Academic institutes and sponsors from various therapeutic areas, such as oncology, infectious diseases, CVS disorders, neurology, vaccines, metabolic disorders/endocrinology, immunological disorders, psychiatry, respiratory disorders, dermatology, ophthalmology, gastrointestinal diseases, and hematology, outsource their projects to Indian CRAMS providers. Indian CRAMS companies offer a complete solution, from preclinical services like pharmacokinetics/pharmacodynamics and toxicology testing to clinical research services, laboratory services, consulting services, data management services, and analytical testing services. Additionally, they provide physical characterization, stability testing, and bioanalytical testing services.
- Biocon Ltd., a leading Indian biopharmaceutical company, exemplifies this comprehensive offering, catering to drug discovery, development, and manufacturing of biologics and biosimilars. Project management, precision/personalized medicine, and drug pipelines are critical components of the CRAMS market. The integration of artificial intelligence (AI) and advanced technologies further enhances the value proposition for sponsors. Patient recruitment and clinical trials are crucial aspects of the R&D pipeline, and CRAMS providers ensure seamless execution. The outsourcing trend in Pharma R&D continues to drive demand for CRAMS services, making India an attractive destination for sponsors worldwide.
What are the market trends shaping the India Contract Research And Manufacturing Service (CRAMS) Market?
Technological advancements in CRAMS is the upcoming trend In the market.
- The market is experiencing significant growth due to technological advancements in various stages of drug development and manufacturing processes. CRAMS providers in India are utilizing innovative technologies to optimize processes and automate operations, resulting in increased efficiency, productivity, and quality. For instance, Jubilant Pharmova Ltd. Has implemented advanced automation systems and process optimization techniques to streamline manufacturing, minimize waste, and boost yield. These technological innovations not only enhance operational efficiency but also reduce production costs, making CRAMS more cost-effective for sponsors. Advancements in analytical technologies are another significant development In the CRAMS market.
- These advancements enable providers to offer more comprehensive and sophisticated analytical testing services, including pharmacokinetics/pharmacodynamics, toxicology testing, and bioanalytical testing. These services are crucial In the drug development pipeline, from preclinical research to clinical trials and regulatory approval. Moreover, the integration of artificial intelligence (AI) and precision/personalized medicines In the CRAMS market is revolutionizing drug development. AI is being used for patient recruitment, data management, and project management, streamlining the R&D pipeline and reducing timelines. Precision/personalized medicines, on the other hand, require more sophisticated testing services, which CRAMS providers are now offering to cater to the therapeutic areas of oncology, infectious diseases, CVS disorders, neurology, vaccines, metabolic disorders/endocrinology, immunological disorders, psychiatry, respiratory disorders, dermatology, ophthalmology, gastrointestinal diseases, hematology, and more.
What challenges doesIndia Contract Research And Manufacturing Service (CRAMS) Market face during the growth?
Need to meet stringent regulatory compliance requirements of pharmaceutical and biotechnology industries is a key challenge affecting the market growth.
- The market encounters regulatory compliance as a significant challenge. India's pharmaceutical sector is governed by stringent regulations from domestic and international authorities, including the Central Drugs Standard Control Organization (CDSCO) and the US FDA, among others. Adherence to these regulations is crucial for ensuring the safety, efficacy, and quality of drug products and research services. One of the regulatory hurdles in India is the intricate and ever-evolving nature of pharmaceutical regulations. The regulatory landscape undergoes continuous updates, necessitating ongoing monitoring and adaptation by CRAMS providers. For instance, pharmaceutical research services must adhere to guidelines related to drug development, project management, patient recruitment, clinical trials, and regulatory submissions.
- Additionally, manufacturing services require compliance with Good Manufacturing Practices (GMP), Good Laboratory Practices (GLP), and Good Clinical Practices (GCP). The therapeutic areas covered In the CRAMS market include chronic diseases, oncology, infectious diseases, CVS disorders, neurology, vaccines, metabolic disorders/endocrinology, immunological disorders, psychiatry, respiratory disorders, dermatology, ophthalmology, gastrointestinal diseases, hematology, and more. To cater to the diverse needs of sponsors, CRAMS providers offer a range of services, including preclinical services, pharmacokinetics/pharmacodynamics services, toxicology testing services, analytical testing services, physical characterization services, stability testing services, and bioanalytical testing services. In the rapidly evolving world of pharmaceutical R&D, outsourcing has become an essential strategy for sponsors to optimize their development pipeline.
Exclusive Customer Landscape
The market forecasting report includes the adoption lifecycle of the market, covering from the innovator’s stage to the laggard’s stage. It focuses on adoption rates in different regions based on penetration. Furthermore, the market report also includes key purchase criteria and drivers of price sensitivity to help companies evaluate and develop their market growth analysis strategies.
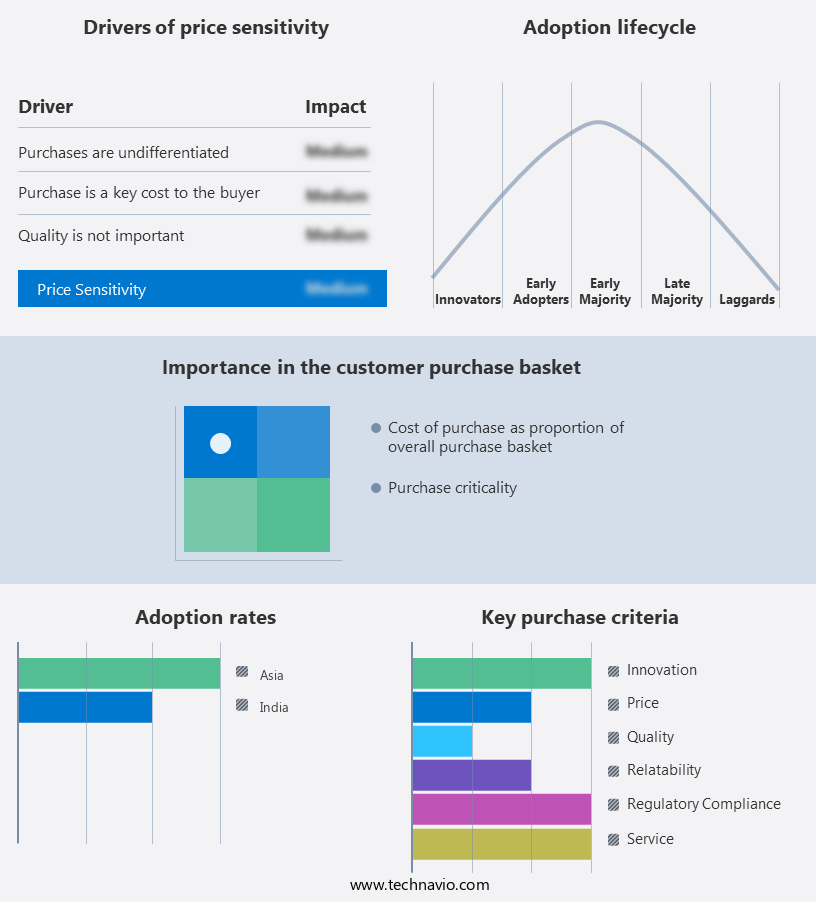
Customer Landscape
Key Companies & Market Insights
Companies are implementing various strategies, such as strategic alliances, market forecast , partnerships, mergers and acquisitions, geographical expansion, and product/service launches, to enhance their presence In the market.
Aragen Life Sciences Pvt. Ltd.: The company offers contract research and manufacturing service (CRAMS) across the drug development continuum to advance small and large-molecule programs.
The market research and growth report includes detailed analyses of the competitive landscape of the market and information about key companies, including:
- Arch Pharmalabs Ltd.
- Aurobindo Pharma Ltd.
- Bhagwati Organics Pvt. Ltd.
- Biocon Ltd.
- Dhanuka Agritech Ltd.
- Dishman Carbogen Amcis Ltd.
- Divis Laboratories Ltd.
- Ind-Swift Laboratories Ltd.
- Jubilant Pharmova Ltd.
- Lupin Ltd.
- Merck and Co. Inc.
- MSN Laboratories
- Murli Krishna Pharma Pvt. Ltd.
- Onyx Scientific Ltd.
- Piramal Enterprises Ltd.
- Sun Pharmaceutical Industries Ltd.
- TCG Lifesciences Pvt. Ltd.
- Wockhardt Ltd.
Qualitative and quantitative analysis of companies has been conducted to help clients understand the wider business environment as well as the strengths and weaknesses of key market players. Data is qualitatively analyzed to categorize companies as pure play, category-focused, industry-focused, and diversified; it is quantitatively analyzed to categorize companies as dominant, leading, strong, tentative, and weak.
Research Analyst Overview
The contract research and manufacturing services (CRAMS) market encompasses a broad range of offerings that enable pharmaceutical and biotechnology companies to outsource various aspects of their research and development (R&D) processes. These services span from research services, such as study design and execution, data management, and statistical analysis, to manufacturing services, including active pharmaceutical ingredient (API) production, formulation development, and finished product manufacturing. Academic institutes often collaborate with CRAMS providers to advance drug development In therapeutic areas such as oncology, infectious diseases, cardiovascular disorders, neurology, vaccines, metabolic disorders/endocrinology, immunological disorders, psychiatry, respiratory disorders, dermatology, ophthalmology, and gastrointestinal diseases, among others.
Project management plays a crucial role in ensuring the successful execution of CRAMS projects. Effective project management facilitates seamless communication between sponsors and CRAMS providers, enabling the timely completion of projects and the delivery of high-quality data and drug products. The R&D pipeline for pharmaceutical and biotechnology companies is characterized by a high degree of complexity and uncertainty. CRO services help mitigate these challenges by providing expertise in various therapeutic areas, enabling sponsors to focus on their core competencies. The integration of artificial intelligence (AI) and other advanced technologies into CRAMS offerings is transforming the industry. AI-driven solutions are being used to accelerate drug discovery, optimize clinical trial design, and improve patient recruitment and retention.
Personalized medicines represent a significant growth area withIn the CRAMS market. Precision/personalized medicine approaches require specialized expertise and technologies, making CROs an essential partner for sponsors in this area. The CRAMS market is dynamic, with ongoing advances in technology and therapeutic areas driving demand for innovative solutions. Sponsors continue to seek out CROs that can provide comprehensive, end-to-end services, from preclinical through clinical development and into commercial manufacturing. The CRAMS market plays a vital role In the pharmaceutical and biotechnology industries, enabling sponsors to effectively manage the complexity and uncertainty of the R&D process. From research services to manufacturing services, CROs offer a range of solutions that help sponsors bring new drugs to market more efficiently and effectively. The integration of advanced technologies, such as AI, and a focus on personalized medicines are key trends driving growth In the CRAMS market.
|
Market Scope |
|
|
Report Coverage |
Details |
|
Page number |
197 |
|
Base year |
2024 |
|
Historic period |
2019-2023 |
|
Forecast period |
2025-2029 |
|
Growth momentum & CAGR |
Accelerate at a CAGR of 11.8% |
|
Market growth 2025-2029 |
USD 17.11 billion |
|
Market structure |
Fragmented |
|
YoY growth 2024-2025(%) |
10.2 |
|
Competitive landscape |
Leading Companies, Market Positioning of Companies, Competitive Strategies, and Industry Risks |
What are the Key Data Covered in this Market Research and Growth Report?
- CAGR of the market during the forecast period
- Detailed information on factors that will drive the market growth and forecasting between 2025 and 2029
- Precise estimation of the size of the market and its contribution of the market in focus to the parent market
- Accurate predictions about upcoming market growth and trends and changes in consumer behaviour
- Growth of the market across India
- Thorough analysis of the market’s competitive landscape and detailed information about companies
- Comprehensive analysis of factors that will challenge the growth of market companies
We can help! Our analysts can customize this market research report to meet your requirements. Get in touch
 RIA -
RIA - 
