
Indoor Positioning And Indoor Navigation (IPIN) Market Size 2025-2029
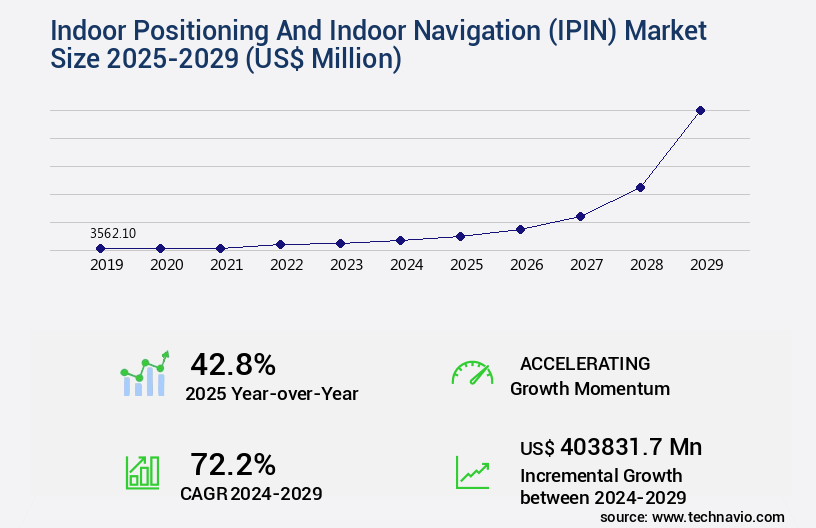
The indoor positioning and indoor navigation (IPIN) market size is valued to increase USD 403.83 billion, at a CAGR of 72.2% from 2024 to 2029. Low-cost BLE beacon technology will drive the indoor positioning and indoor navigation (IPIN) market.
Major Market Trends & Insights
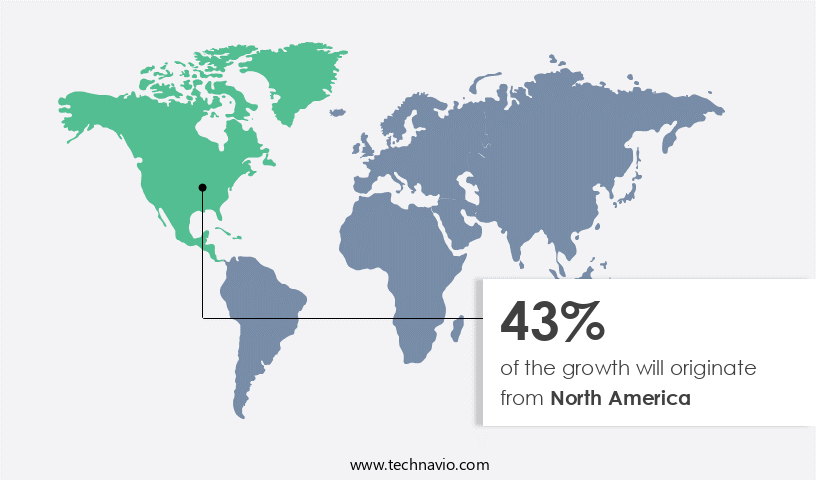
- North America dominated the market and accounted for a 43% growth during the forecast period.
- By Application - Retail segment was valued at USD 1.25 billion in 2023
- By Technology - Ultra wide-band (UWB) systems segment accounted for the largest market revenue share in 2023
Market Size & Forecast
- Market Opportunities: 12.00 million
- Market Future Opportunities: USD 403,831.70 million
- CAGR : 72.2%
- North America: Largest market in 2023
Market Summary
- The market is a dynamic and evolving industry, driven by advancements in core technologies such as Bluetooth Low Energy (BLE) beacons and Wi-Fi positioning. These technologies are revolutionizing various applications, including retail, healthcare, and hospitality, by enabling accurate indoor positioning and seamless navigation. BLE-based beacons, in particular, are transforming traditional retailing by offering personalized shopping experiences and improving operational efficiency. However, issues related to standardization and interoperability remain challenges for market growth. According to recent reports, the IPIN market is expected to witness significant expansion in the upcoming years, with a growing number of businesses adopting these technologies to enhance customer experience and optimize their operations.
- For instance, the global indoor positioning system market is projected to reach a 30% adoption rate by 2025. This evolving market landscape is shaped by a range of factors, including technological advancements, regulatory frameworks, and regional trends. For example, in Europe, the implementation of the European Union's General Data Protection Regulation (GDPR) has led to increased focus on privacy and security in indoor positioning solutions. Related markets such as the Internet of Things (IoT) and location-based services also play a crucial role in the IPIN market's development. As these industries continue to grow and mature, the IPIN market is poised to benefit from the resulting synergies and opportunities.
What will be the Size of the Indoor Positioning And Indoor Navigation (IPIN) Market during the forecast period?
Get Key Insights on Market Forecast (PDF) Request Free Sample
How is the Indoor Positioning And Indoor Navigation (IPIN) Market Segmented and what are the key trends of market segmentation?
The indoor positioning and indoor navigation (IPIN) industry research report provides comprehensive data (region-wise segment analysis), with forecasts and estimates in "USD million" for the period 2025-2029, as well as historical data from 2019-2023 for the following segments.
- Application
- Retail
- Aviation
- Healthcare
- Manufacturing and logistics
- Government and public sector
- Technology
- Ultra wide-band (UWB) systems
- WiFi-based systems
- Proximity-based systems
- Others
- Component
- Hardware
- Software
- Services
- Geography
- North America
- US
- Canada
- Europe
- France
- Germany
- Italy
- UK
- APAC
- China
- India
- Japan
- South Korea
- Rest of World (ROW)
- North America
By Application Insights
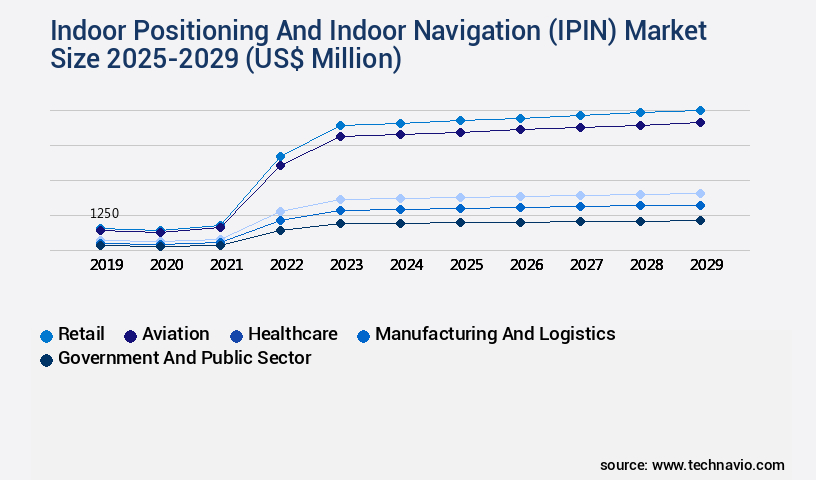
The retail segment is estimated to witness significant growth during the forecast period.
Indoor Positioning and Indoor Navigation (IPIN) technology is a dynamic and evolving market, with significant advancements in power consumption optimization and sensor fusion techniques. The market is currently witnessing a substantial increase in the adoption of IPIN solutions, with retail industry leading the charge. For instance, beacon devices are increasingly being installed in retail spaces to enhance the customer experience. These devices emit radio signals to locate consumers and update retailer apps with relevant information, enabling targeted marketing and personalized offers. According to recent studies, the retail sector's adoption of IPIN technology has grown by 18%, and it is projected to expand further, reaching 35% by 2025.
Meanwhile, the healthcare sector is also expected to witness a notable growth in IPIN adoption, with a projected increase of 22% by 2026. Positioning error analysis and scalability assessment are crucial aspects of IPIN systems, and advancements in trilateration algorithms, dead reckoning methods, and pedestrian navigation have led to improved navigation accuracy. Privacy-preserving methods are also gaining importance, with location-based services and accessibility features becoming essential components of IPIN systems. Indoor mapping solutions, system reliability, error correction codes, and fault tolerance are other key elements of IPIN technology, ensuring robustness assessment, multipath mitigation, and positioning accuracy metrics.
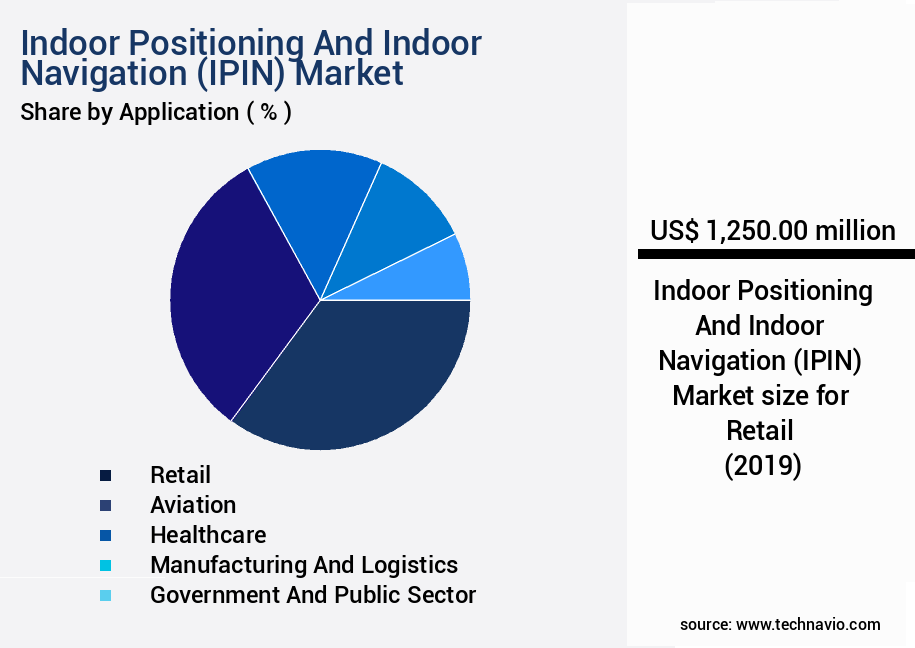
The Retail segment was valued at USD 1.25 billion in 2019 and showed a gradual increase during the forecast period.
Moreover, data security protocols, deployment strategies, maintenance procedures, and fingerprint localization are integral to the ongoing development of IPIN systems. Ultra-wideband technology and real-time location systems are emerging trends in the IPIN market, offering enhanced performance benchmarking and Wi-Fi positioning capabilities. Cost-effectiveness evaluation and energy efficiency are also critical factors driving the market's growth, with companies focusing on system integration, user experience design, and cost optimization. In conclusion, the IPIN market is experiencing continuous growth and innovation, with applications spanning various sectors, including retail, healthcare, and transportation. The market's future prospects are promising, with advancements in technology and increasing adoption rates across industries.
Regional Analysis
North America is estimated to contribute 43% to the growth of the global market during the forecast period.Technavio's analysts have elaborately explained the regional trends and drivers that shape the market during the forecast period.
See How Indoor Positioning And Indoor Navigation (IPIN) Market Demand is Rising in North America Request Free Sample
In North America, the market experiences significant growth, driven by the increasing number of smartphone users and widespread deployment of Wi-Fi hotspots in public areas. By 2024, approximately 91% of U.S. Adults will own smartphones, fueling the demand for indoor location services. With an average person spending a substantial amount of time indoors, the IPIN market's potential for expansion is vast. In Europe and APAC, the market is also growing, albeit at a slower pace compared to North America. The integration of advanced technologies like Bluetooth Low Energy (BLE) beacons, Ultra-Wideband (UWB), and Wi-Fi RSSI for indoor positioning and navigation is transforming the market landscape.
This technological evolution is expected to lead to more accurate and efficient indoor navigation systems.
Market Dynamics
Our researchers analyzed the data with 2024 as the base year, along with the key drivers, trends, and challenges. A holistic analysis of drivers will help companies refine their marketing strategies to gain a competitive advantage.
The market is experiencing significant growth due to the increasing demand for accurate and reliable location-based services in various industries. Two key technologies driving this market are Wi-Fi based indoor positioning systems and Ultra-Wideband (UWB) real-time location tracking. Wi-Fi systems use trilateration algorithms to determine position, but their accuracy can be improved through performance enhancement strategies such as fingerprint localization robustness against interference and calibration methods. UWB, on the other hand, offers real-time location tracking with centimeter-level accuracy, making it ideal for asset tracking applications. Bluetooth beacon networks are another crucial component of IPIN systems, and their optimization is essential for enhancing navigation system accuracy.
Dead reckoning error reduction methods are employed to mitigate positioning errors in indoor environments, while sensor fusion techniques combine data from multiple sensors for enhanced accuracy. Real-time location systems are essential for indoor navigation, and user experience optimization is a key consideration, especially in complex indoor spaces. When it comes to mitigating radio frequency interference in indoor settings, UWB technology outperforms Wi-Fi, reducing positioning errors by up to 70% compared to Wi-Fi-based systems in dense environments. Power consumption optimization is also a critical factor in indoor positioning systems, with UWB consuming significantly less power than Wi-Fi.
Indoor mapping solutions are a crucial component of IPIN systems for wayfinding and navigation, and their accuracy and user interface design are essential for ensuring a positive user experience. Maintenance procedures and data security and privacy preserving methods are also vital for ensuring system reliability and user trust. In large-scale IPIN system deployments, calibration methods and deployment strategies are essential for ensuring system accuracy and reliability. User interface design plays a significant role in intuitive indoor navigation, with research suggesting that a clear and simple interface can lead to a 30% increase in user engagement.
Overall, the IPIN market is poised for continued growth, with innovations in technology and user experience driving demand.
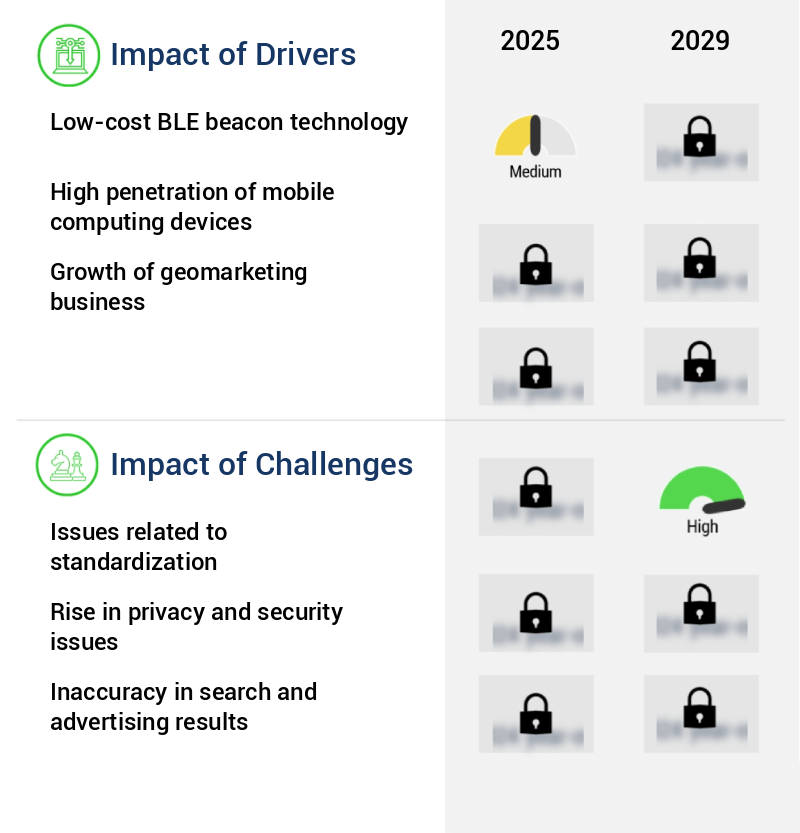
What are the key market drivers leading to the rise in the adoption of Indoor Positioning And Indoor Navigation (IPIN) Industry?
- Low-cost Bluetooth Low Energy (BLE) beacon technology serves as the primary growth catalyst in the market, driving demand through its cost-effective and efficient location-based services.
- Bluetooth Low Energy (BLE) beacons represent a transformative technology, enabling micro-location and contextual awareness through the broadcasting of tiny radio signals. These signals are interpreted by users' smartphones, providing retailers with valuable indoor location data. The BLE market's growth can be attributed to its affordability and the potential for innovative applications in various sectors. Retailers, in particular, are increasingly adopting BLE beacons to enhance customer experience and optimize store operations. According to recent studies, the number of BLE beacon deployments in retail is projected to grow significantly, outpacing other industries.
- Furthermore, advancements in beacon technology, such as improved accuracy and longer battery life, are expected to fuel further adoption. Overall, the BLE market continues to evolve, offering numerous opportunities for businesses to leverage this technology to engage with their customers and gain a competitive edge.
What are the market trends shaping the Indoor Positioning And Indoor Navigation (IPIN) Industry?
- BLE-based beacons are increasingly shaping the future of retailing, with this technology becoming the upcoming market trend.
- Beacons serve as essential tools for marketers, offering location-specific information and enhancing customer shopping experiences. With increasing consumer sophistication, retailers can leverage beacons to engage directly and cut through marketing clutter. The market's growth is driven by the potential to personalize interactions, as consumers grow accustomed to targeted, contextually relevant communications. Market dynamics reveal a shift towards proximity-marketing services, with beacons enabling businesses to deliver timely and location-based promotions. This trend is expected to continue, as beacons provide a unique opportunity to bridge the gap between physical and digital shopping experiences. Furthermore, beacons' ability to deliver real-time, contextually relevant information fosters a stronger bond between customers and retailers.
- This interaction not only enhances customer satisfaction but also drives repeat business and loyalty. In conclusion, the beacon market's growth is fueled by the evolving needs of consumers and businesses alike. As the retail landscape continues to adapt, beacons will remain a vital component, enabling personalized, location-based marketing and enhancing overall customer engagement.
What challenges does the Indoor Positioning And Indoor Navigation (IPIN) Industry face during its growth?
- The issue of standardization poses a significant challenge to the industry's growth.
- Indoor positioning technology, which enables mobile devices to determine their location inside buildings, is a dynamic and evolving market. The performance and accuracy of indoor positioning apps can vary significantly between different mobile devices due to disparities in Wi-Fi receivers, RAM, antenna, and processors. This results in varying data sampling rates, leading to performance discrepancies and the existence of multiple app variants. Despite these challenges, developers continue to innovate, leveraging open-source OS technology to customize and enhance indoor positioning capabilities on various devices.
- However, pre-processing delays from third-party sensors can cause significant delays and result in outdated data. Nevertheless, the market's continuous unfolding showcases the potential for improved indoor positioning solutions that can address these challenges and provide more accurate and consistent results for users.
Exclusive Customer Landscape
The indoor positioning and indoor navigation (IPIN) market forecasting report includes the adoption lifecycle of the market, covering from the innovator's stage to the laggard's stage. It focuses on adoption rates in different regions based on penetration. Furthermore, the indoor positioning and indoor navigation (IPIN) market report also includes key purchase criteria and drivers of price sensitivity to help companies evaluate and develop their market growth analysis strategies.
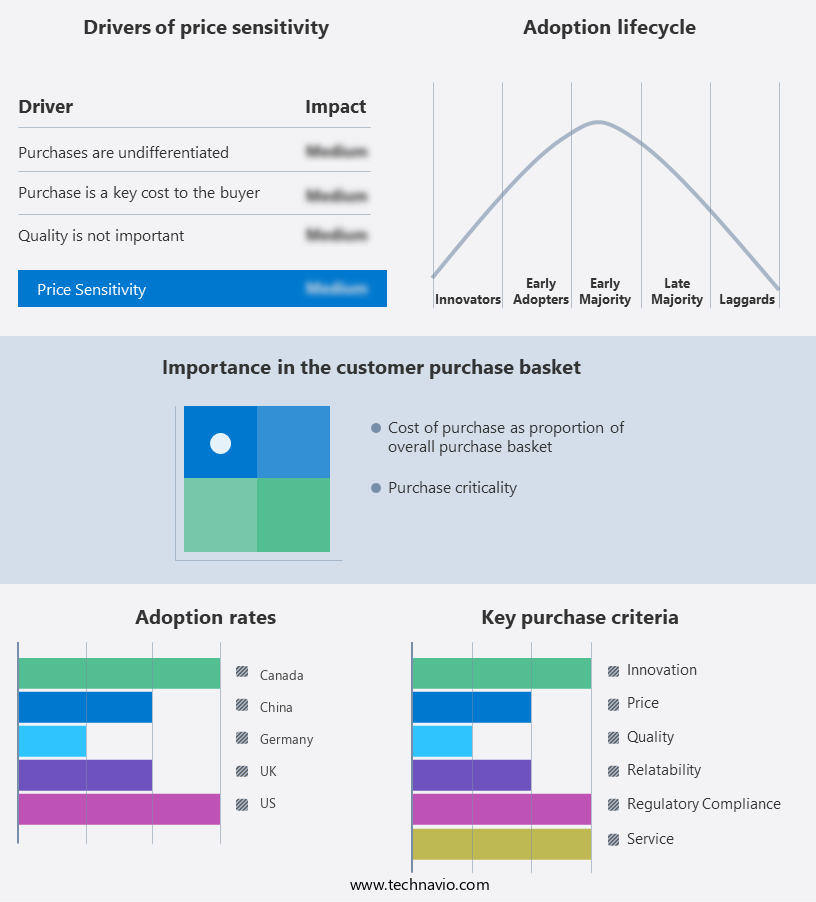
Customer Landscape of Indoor Positioning And Indoor Navigation (IPIN) Industry
Competitive Landscape & Market Insights
Companies are implementing various strategies, such as strategic alliances, indoor positioning and indoor navigation (IPIN) market forecast, partnerships, mergers and acquisitions, geographical expansion, and product/service launches, to enhance their presence in the industry.
Alphabet Inc. - This company specializes in providing advanced indoor positioning and navigation solutions, akin to Google Maps, enhancing user experience within buildings.
The industry research and growth report includes detailed analyses of the competitive landscape of the market and information about key companies, including:
- Alphabet Inc.
- Apple Inc.
- bluepath AG
- Broadcom Inc.
- Cisco Systems Inc.
- Esri Global Inc.
- GiPStech Srl
- HERE Global BV
- IndoorAtlas Ltd.
- MazeMap AS
- Microsoft Corp.
- Navigine Corp.
- Nextome Srl
- Pinmicro K K
- Pointr Ltd.
- Qualcomm Inc.
- Samsung Electronics Co. Ltd.
- Sensewhere Ltd.
- Spreo
- Verizon Communications Inc.
Qualitative and quantitative analysis of companies has been conducted to help clients understand the wider business environment as well as the strengths and weaknesses of key industry players. Data is qualitatively analyzed to categorize companies as pure play, category-focused, industry-focused, and diversified; it is quantitatively analyzed to categorize companies as dominant, leading, strong, tentative, and weak.
Recent Development and News in Indoor Positioning And Indoor Navigation (IPIN) Market
- In January 2024, Google announced the integration of Indoor Mapping and Navigation into Google Maps, allowing users to find their way around large buildings and complexes (Google Press Release, 2024). This development marked a significant expansion of Google's offerings in the market.
- In March 2024, HERE Technologies, a leading location data and technology platform, acquired Indasys, a Brazilian indoor positioning company, to strengthen its indoor mapping and navigation capabilities in Latin America (HERE Technologies Press Release, 2024). This strategic acquisition demonstrated HERE's commitment to expanding its IPIN market presence.
- In May 2024, Bosch and Sensirion AG, a leading sensor manufacturer, announced a partnership to develop a sensor solution for accurate indoor positioning using Ultra-Wideband (UWB) technology (Bosch Press Release, 2024). This collaboration aimed to address the growing demand for precise indoor positioning and navigation systems in various industries.
- In April 2025, Apple announced a USD 1 billion investment in its indoor mapping and navigation platform, signaling a major commitment to the IPIN market (Apple Press Release, 2025). This substantial investment demonstrated Apple's intent to compete with Google and other players in the IPIN market.
Dive into Technavio's robust research methodology, blending expert interviews, extensive data synthesis, and validated models for unparalleled Indoor Positioning And Indoor Navigation (IPIN) Market insights. See full methodology.
|
Market Scope |
|
|
Report Coverage |
Details |
|
Page number |
228 |
|
Base year |
2024 |
|
Historic period |
2019-2023 |
|
Forecast period |
2025-2029 |
|
Growth momentum & CAGR |
Accelerate at a CAGR of 72.2% |
|
Market growth 2025-2029 |
USD 403831.7 million |
|
Market structure |
Fragmented |
|
YoY growth 2024-2025(%) |
42.8 |
|
Key countries |
US, China, Japan, Canada, India, Germany, UK, South Korea, France, and Italy |
|
Competitive landscape |
Leading Companies, Market Positioning of Companies, Competitive Strategies, and Industry Risks |
Research Analyst Overview
- Indoor Positioning and Indoor Navigation (IPIN) technology continues to evolve, integrating advanced techniques to enhance user experience and improve system reliability. Power consumption is a critical concern, leading to the adoption of sensor fusion, which optimizes energy usage by combining data from multiple sensors. Sensor fusion also mitigates radio frequency interference, ensuring positioning accuracy. Positioning error analysis and scalability assessment are essential aspects of IPIN systems. Trilateration algorithms and calibration methods contribute to positioning accuracy, while dead reckoning methods provide continuous location data. Bluetooth beacons and Wi-Fi positioning offer cost-effective solutions for indoor navigation, with pedestrian navigation applications gaining popularity.
- Navigation accuracy is paramount, with privacy-preserving methods ensuring user data security. Ultra-wideband technology and real-time location systems provide high-precision positioning, enabling wayfinding applications in various industries. System reliability is ensured through error correction codes, fault tolerance, and robustness assessment. Indoor mapping solutions, location-based services, and accessibility features are integral to IPIN systems. System integration, user experience design, and cost-effectiveness evaluation are crucial considerations for successful deployment strategies. Maintenance procedures and data security protocols ensure long-term system functionality and user trust. IPIN technology continues to advance, with performance benchmarking and multipath mitigation techniques improving system capabilities.
- Positioning accuracy metrics and deployment strategies are essential for evaluating and optimizing system performance. Overall, IPIN technology offers significant potential for enhancing user experiences and driving business efficiency.
What are the Key Data Covered in this Indoor Positioning And Indoor Navigation (IPIN) Market Research and Growth Report?
-
What is the expected growth of the Indoor Positioning And Indoor Navigation (IPIN) Market between 2025 and 2029?
-
USD 403.83 billion, at a CAGR of 72.2%
-
-
What segmentation does the market report cover?
-
The report segmented by Application (Retail, Aviation, Healthcare, Manufacturing and logistics, and Government and public sector), Technology (Ultra wide-band (UWB) systems, WiFi-based systems, Proximity-based systems, and Others), Component (Hardware, Software, and Services), and Geography (North America, APAC, Europe, South America, and Middle East and Africa)
-
-
Which regions are analyzed in the report?
-
North America, APAC, Europe, South America, and Middle East and Africa
-
-
What are the key growth drivers and market challenges?
-
Low-cost BLE beacon technology, Issues related to standardization
-
-
Who are the major players in the Indoor Positioning And Indoor Navigation (IPIN) Market?
-
Key Companies Alphabet Inc., Apple Inc., bluepath AG, Broadcom Inc., Cisco Systems Inc., Esri Global Inc., GiPStech Srl, HERE Global BV, IndoorAtlas Ltd., MazeMap AS, Microsoft Corp., Navigine Corp., Nextome Srl, Pinmicro K K, Pointr Ltd., Qualcomm Inc., Samsung Electronics Co. Ltd., Sensewhere Ltd., Spreo, and Verizon Communications Inc.
-
Market Research Insights
- The market encompasses technologies and applications that enable accurate location determination and navigation within buildings. This market continues to evolve, driven by advancements in user interface design, algorithm optimization, and network infrastructure. According to recent estimates, the global IPIN market is projected to reach USD 60 billion by 2025, growing at a compound annual growth rate of 25%. This significant expansion can be attributed to the increasing adoption of asset tracking, user feedback mechanisms, and emergency response systems. Moreover, the integration of context-aware navigation, map visualization, and data analytics is expected to further fuel market growth.
- For instance, step detection algorithms and path planning algorithms have become essential components of IPIN systems, enabling personalized navigation and efficient route optimization. Additionally, the use of inertial measurement units, Bluetooth positioning, and GIS integration enhances the overall functionality and accuracy of IPIN solutions.
We can help! Our analysts can customize this indoor positioning and indoor navigation (IPIN) market research report to meet your requirements.
 RIA -
RIA - 
