Industrial And Institutional Cleaning Chemicals Market Size 2024-2028
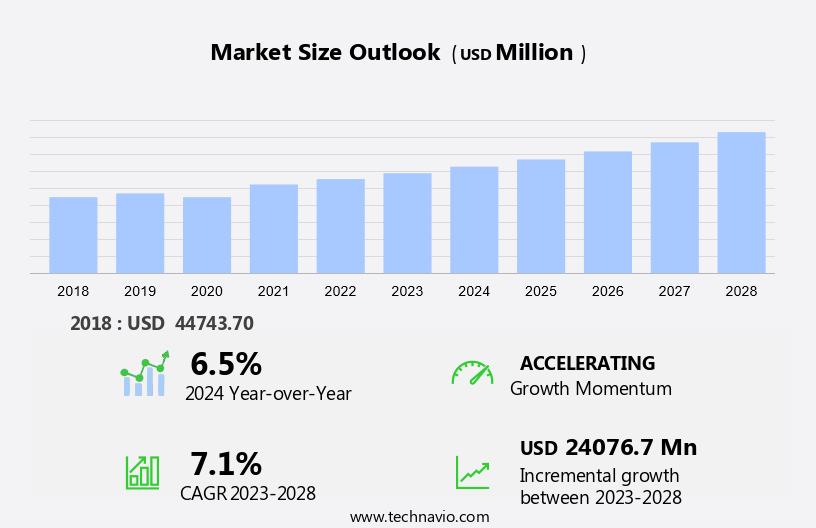
The industrial and institutional cleaning chemicals market size is forecast to increase by USD 24.08 billion at a CAGR of 7.1% between 2023 and 2028.
- The market is witnessing significant growth due to various factors. One of the primary drivers is the increasing focus on workplace hygiene initiatives, which has led to a heightened demand for effective cleaning solutions. Another trend in the market is the preference for eco-friendly and chemical-free cleaning alternatives, such as enzymes and detergent products.
- Furthermore, biocidal products are gaining popularity due to their ability to kill bacteria and viruses, ensuring a healthier environment. However, there are challenges facing the market, including regulations on the VOC content in cleaning chemicals and the ongoing shift towards solvent-free cleaners, such as mineral spirits, due to their environmental impact. Overall, the market is expected to continue its growth trajectory as businesses prioritize cleanliness and sustainability in their operations.
What will be the Size of the Market During the Forecast Period?
- The market is a significant sector within the broader chemicals industry, supplying essential products for maintaining cleanliness and hygiene in various commercial and public settings. This market encompasses a diverse range of chemical products, including surfactants, solvents, and disinfectants, among others. Surfactants, a crucial component of cleaning agents, are employed for their ability to reduce the surface tension between liquids and solids or between liquids and gases. They are extensively used in the production of detergent products, such as powders and liquids, employed in various industries and sectors, including food service, hospitality, and education.
- Similarly, solvents, another essential segment, are employed for their ability to dissolve various substances. In the context of cleaning applications, they are used in solvent cleaners for removing greases, oils, and other contaminants. Mineral spirits, a common type of solvent, is widely used in industrial settings for degreasing applications. Disinfectants and sanitizers represent a vital segment of the market. These products are employed to eliminate or reduce the number of microorganisms, ensuring a clean and hygienic environment. Bio-based chemicals are increasingly gaining traction in this segment due to their eco-friendly nature and reduced environmental impact. The commercial segment is a significant consumer of industrial and institutional cleaning chemicals.
- Additionally, this segment includes various industries, such as healthcare, food processing, and manufacturing, where maintaining cleanliness and hygiene is of utmost importance. Workplace hygiene initiatives have gained significant attention in recent years, leading to increased demand for these chemicals. The hospitality sector, including hotels and restaurants, is another significant consumer of industrial and institutional cleaning chemicals. Ensuring a clean and hygienic environment is essential for maintaining customer satisfaction and adhering to health and safety regulations. The education sector is another key consumer of these chemicals. Schools, colleges, and universities require extensive cleaning services to maintain a healthy and productive learning environment.
- In conclusion, the use of enzymes in cleaning products has gained significant traction in recent years due to their ability to enhance the cleaning performance of detergents and reduce the amount of water and energy required. Biocidal products, which contain biocides to prevent the growth of microorganisms, are also gaining popularity due to their eco-friendly nature and reduced environmental impact. In conclusion, the market is driven by the need for cleanliness and hygiene in various commercial and public settings. The market is segmented into surfactants, Solvents, and disinfectants, with each segment catering to specific applications. The commercial, hospitality, and education sectors are significant consumers of these chemicals, and the use of eco-friendly alternatives, such as bio-based chemicals and enzymes, is gaining increasing attention.
How is this market segmented and which is the largest segment?
The market research report provides comprehensive data (region-wise segment analysis), with forecasts and estimates in "USD billion" for the period 2024-2028, as well as historical data from 2018-2022 for the following segments.
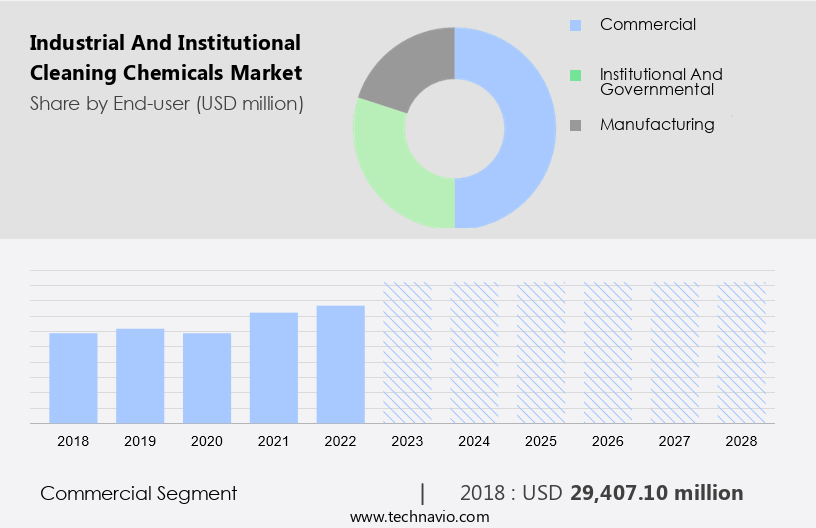
- End-user
- Commercial
- Institutional and governmental
- Manufacturing
- Geography
- North America
- Canada
- US
- Europe
- Germany
- France
- APAC
- China
- India
- Japan
- South America
- Brazil
- Middle East and Africa
- North America
By End-user Insights
- The commercial segment is estimated to witness significant growth during the forecast period.
The market caters to the demand for substances used to eliminate harmful organisms, including bacteria and pests, in various commercial and institutional settings. Active substances, such as disinfectants and sanitizers, are essential in this market. Authorizations from regulatory bodies are necessary for the use of these chemicals. The commercial sector, which includes corporate offices, banks, food service stations, retail stores, healthcare facilities, laundry care facilities, hotels, and resorts, among others, is a significant consumer of industrial and institutional cleaning chemicals. The need for maintaining hygiene in these workplaces is driving the demand for these chemicals. The expansion of commercial offices and economic activities worldwide has led to an increase in the demand for these chemicals.
Additionally, the growing population, particularly the older population, has accelerated the need for efficient healthcare facilities, further boosting the market. The increasing awareness of workplace hygiene and the need for efficient cleaning solutions are key reasons for this growth. Furthermore, the shift towards bio-based chemicals is also expected to influence market trends. In conclusion, the market is essential for maintaining hygiene and eliminating harmful organisms in various commercial and institutional settings. The demand for these chemicals is driven by the expansion of commercial offices, economic activities, and the growing need for efficient healthcare facilities. Market research firms forecast steady growth for this market due to increasing awareness of workplace hygiene and the shift towards bio-based chemicals.
Get a glance at the market report of share of various segments Request Free Sample
The commercial segment was valued at USD 29.41 billion in 2018 and showed a gradual increase during the forecast period.
Regional Analysis
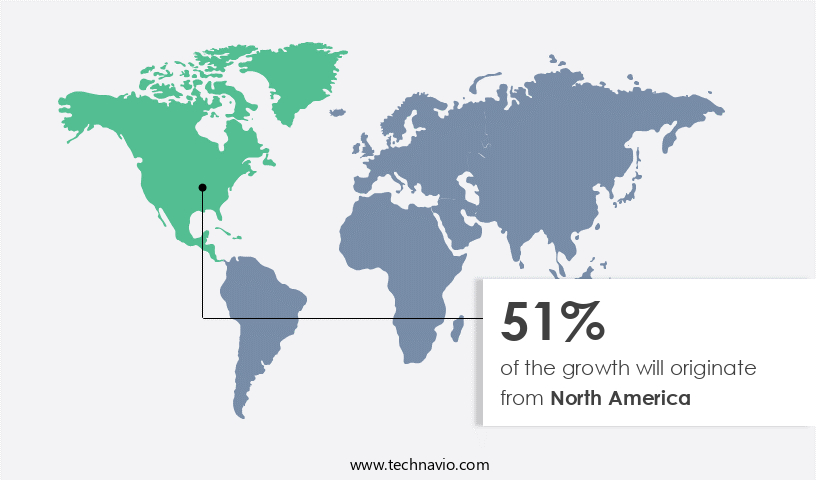
- North America is estimated to contribute 51% to the growth of the global market during the forecast period.
Technavio's analysts have elaborately explained the regional trends and drivers that shape the market during the forecast period.
For more insights on the market share of various regions Request Free Sample
The market in North America held a significant share of the global market in 2023. This dominance can be attributed to the extensive utilization of cleaning chemicals in various industries such as healthcare, education, food service, and hospitality. The region's emphasis on maintaining high cleanliness standards and stringent regulations further fuels market growth.
Moreover, the construction of new hospitals and healthcare facilities, particularly in the United States and Canada, drives demand for these chemicals. The food and beverage processing industry is another significant contributor to the market due to the necessity of maintaining stringent hygiene standards. The North American market is poised for continued expansion, driven by the development of eco-friendly and bio-based cleaning solutions. These innovative products align with the growing trend towards sustainability and environmental consciousness.
Market Dynamics
Our researchers analyzed the data with 2023 as the base year, along with the key drivers, trends, and challenges. A holistic analysis of drivers will help companies refine their marketing strategies to gain a competitive advantage.
What are the key market drivers leading to the rise in adoption of Industrial And Institutional Cleaning Chemicals Market?
Rising awareness about workplace hygiene is the key driver of the market.
- The significance of maintaining a clean and hygienic environment in industrial and institutional settings has gained increasing importance due to growing health concerns among the population. This trend is expected to fuel the expansion of The market in the coming years. A clean workplace not only ensures the well-being of employees but also plays a crucial role in enhancing productivity and promoting a positive work culture. The manufacturing sector, particularly in industries such as healthcare and food processing, places a high priority on cleanliness and hygiene due to the potential health risks involved. For instance, in healthcare facilities, maintaining a clean and sterile environment is essential to prevent the spread of infections and ensure the safety of patients.
- Additionally, the market is segmented into raw materials, surfactants, solvents, and disinfectants. Among these, the surfactants segment is expected to dominate the market due to their wide application in various cleaning solutions. The commercial segment, including office buildings, retail spaces, and educational institutions, is a significant end-user of industrial and institutional cleaning chemicals. The hospitality sector is another major end-user, as maintaining cleanliness and hygiene is crucial in the foodservice industry and guest accommodations.
- In conclusion, the need for cleanliness and hygiene in industrial and institutional settings is becoming increasingly recognized, and The market is poised for growth in the coming years. The market is segmented into raw materials, surfactants, solvents, and disinfectants, with the surfactants segment leading the market due to its wide application in various cleaning solutions. The commercial and hospitality sectors are the major end-users of industrial and institutional cleaning chemicals.
What are the market trends shaping the Industrial And Institutional Cleaning Chemicals Market?
An increase in demand for fragranced cleaning products is the upcoming trend in the market.
- Industrial and institutional cleaning chemicals are witnessing an increasing demand due to workplace hygiene initiatives worldwide. Fragrance is becoming a significant factor in these products, as it enhances user experience and satisfaction. Alpha Aromatics Inc., a leading fragrance manufacturer, caters to this trend by providing customized and standard fragrances for various cleaning applications. Their product portfolio includes Fragrance for industrial cleaning products, laundry solutions, and cleaning maintenance.n
- Additionally, otable offerings from Alpha Aromatics include the Meelium odor neutralizer additive and Metazene molecular odor neutralizer additive. Detergent products and biocidal solutions are other essential categories in the market. Enzymes and solvent cleaners, such as mineral spirits, are also integral components. Manufacturers are focusing on reducing the VOC content in their products to meet environmental regulations and consumer preferences.
What challenges does Industrial And Institutional Cleaning Chemicals Market face during the growth?
The growing adoption of chemical-free cleaning is a key challenge affecting the market growth.
- The use of industrial and institutional cleaning chemicals in various sectors, such as manufacturing facilities, healthcare institutions, educational institutions, hospitality establishments, and commercial spaces, continues to be a topic of interest. As concerns over the potential health and environmental impacts of these chemicals grow, the demand for alternative, eco-friendly cleaning solutions is increasing. Many companies are responding to this trend by offering chemical-free cleaning products, which are typically based on plant extracts, antimicrobial agents, microbial technology, and enzymes. One example of a company providing such solutions is Tennant Company, a US-based manufacturer of cleaning equipment.
- However, their offerings include systems like the Orbio SC 5000, which utilizes a chemical-free and salt-based solution for cleaning and sanitizing surfaces. This approach not only provides a sustainable solution for end-users but also reduces the reliance on traditional cleaning chemicals, which can pose health risks to workers and contribute to environmental pollution. In conclusion, the shift towards chemical-free cleaning solutions is gaining momentum in various industries, driven by the need for sustainable and healthier alternatives. Companies like Tennant Company are leading the way by offering innovative cleaning equipment that utilizes eco-friendly, plant-based solutions for effective and safe cleaning applications.
Exclusive Customer Landscape
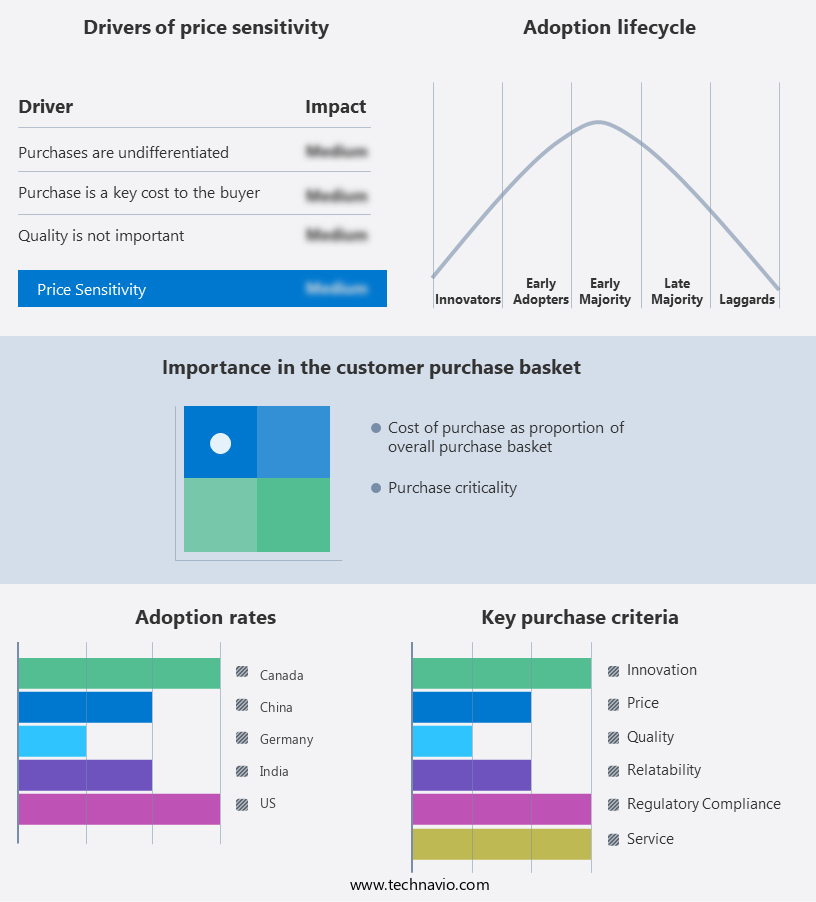
The market forecasting report includes the adoption lifecycle of the market, covering from the innovator's stage to the laggard's stage. It focuses on adoption rates in different regions based on penetration. Furthermore, the market report also includes key purchase criteria and drivers of price sensitivity to help companies evaluate and develop their market growth analysis strategies.
Customer Landscape
Key Companies & Market Insights
Companies are implementing various strategies, such as strategic alliances, market forecast, partnerships, mergers and acquisitions, geographical expansion, and product/service launches, to enhance their presence in the market.
The market research and growth report includes detailed analyses of the competitive landscape of the market and information about key companies, including:
- 3M Co.
- Akzo Nobel NV
- Albemarle Corp.
- BASF SE
- Clariant International Ltd
- Croda International Plc
- Diversey Holdings Ltd.
- Eastman Chemical Co.
- Henkel AG and Co. KGaA
- Huntsman Corp.
- Lanxess AG
- National Chemical Laboratories Inc.
- Nouryon Chemicals Holding B.V.
- Reckitt Benckiser Group Plc
- Solvay SA
- Spartan Chemical Co.
- Stepan Co.
- The Procter and Gamble Co.
- W.M. BARR Co. Inc.
- Westlake Corp.
Qualitative and quantitative analysis of companies has been conducted to help clients understand the wider business environment as well as the strengths and weaknesses of key market players. Data is qualitatively analyzed to categorize companies as pure play, category-focused, industry-focused, and diversified; it is quantitatively analyzed to categorize companies as dominant, leading, strong, tentative, and weak.
Research Analyst Overview
Industrial and institutional cleaning chemicals play a crucial role in maintaining hygiene and cleanliness in various sectors such as hospitality, education, and manufacturing facilities. The market for these chemicals is driven by the growing demand for workplace hygiene initiatives and the increasing awareness of health risks associated with harmful organisms like bacteria and pests. The industrial cleaning chemicals market can be segmented into surfactants, solvents, and disinfectants. Surfactants are essential for creating foam and reducing surface tension, while solvents are used for cleaning oily surfaces. Disinfectants and sanitizers ensure the elimination of germs and bacteria. The commercial segment, including the hospitality sector, educational institutions, and healthcare institutions, is a significant consumer of industrial cleaning chemicals.
In the hospitality sector, hand sanitizers and general-purpose cleaners are extensively used. The education sector requires disinfectants and sanitizers to maintain cleanliness in schools and colleges. Healthcare institutions rely on disinfectants and sanitizers to maintain a hygienic environment. The manufacturing facilities sector also utilizes industrial cleaning chemicals to maintain cleanliness and ensure workplace safety. Biocidal products, including enzymes and detergents, are widely used in this sector.
However, the use of certain chemicals, such as phosphates, triclosan, and tetrachloroethylene, is regulated due to health risks and environmental concerns. The market for industrial cleaning chemicals is expected to grow due to the increasing demand for bio-based chemicals and the replacement of petrochemicals. Catalysts and authorization processes for active substances are essential to ensure the safety and efficacy of these chemicals. VOC content is a critical factor in the selection of industrial cleaning chemicals, with solvent cleaners, such as mineral spirits, being replaced by low-VOC alternatives.
|
Market Scope |
|
|
Report Coverage |
Details |
|
Page number |
168 |
|
Base year |
2023 |
|
Historic period |
2018-2022 |
|
Forecast period |
2024-2028 |
|
Growth momentum & CAGR |
Accelerate at a CAGR of 7.1% |
|
Market growth 2024-2028 |
USD 24.08 billion |
|
Market structure |
Fragmented |
|
YoY growth 2023-2024(%) |
6.5 |
|
Key countries |
US, China, Germany, Canada, India, Russia, Brazil, Japan, France, and Saudi Arabia |
|
Competitive landscape |
Leading Companies, Market Positioning of Companies, Competitive Strategies, and Industry Risks |
What are the Key Data Covered in this Market Research and Growth Report?
- CAGR of the market during the forecast period
- Detailed information on factors that will drive the market growth and forecasting between 2024 and 2028
- Precise estimation of the size of the market and its contribution of the market in focus to the parent market
- Accurate predictions about upcoming market growth and trends and changes in consumer behaviour
- Growth of the market across North America, Europe, APAC, South America, and Middle East and Africa
- Thorough analysis of the market's competitive landscape and detailed information about companies
- Comprehensive analysis of factors that will challenge the growth of market companies
We can help! Our analysts can customize this market research report to meet your requirements. Get in touch
 RIA -
RIA - 
