Biocides Market Analysis, Size, and Forecast 2024-2028: North America (US and Canada), Europe (France, Germany, Italy, and UK), Middle East and Africa (Egypt, KSA, Oman, and UAE), APAC (China, India, and Japan), South America (Argentina and Brazil), and Rest of World (ROW)

Biocides Market Analysis, Size, and Forecast 2024-2028:
North America (US and Canada), Europe (France, Germany, Italy, and UK), Middle East and Africa (Egypt, KSA, Oman, and UAE), APAC (China, India, and Japan), South America (Argentina and Brazil), and Rest of World (ROW)

Published: Nov 2023 176 Pages SKU: IRTNTR76844

Market Overview at a Glance

$5.81 B
Market Opportunity
8.7%
CAGR
7.56
YoY growth 2023-2024(%)

Biocides Market Size 2024-2028

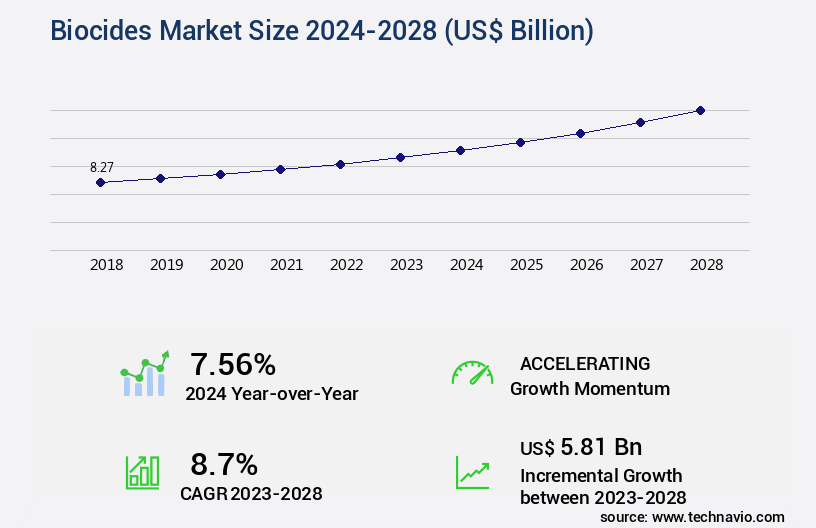
The biocides market size is valued to increase by USD 5.81 billion, at a CAGR of 8.7% from 2023 to 2028. Importance of wastewater recycling and water reuse will drive the biocides market.

Market Insights

  • North America dominated the market and accounted for a 35% growth during the 2024-2028.
  • By Application - Water treatment segment was valued at USD 2.66 billion in 2022
  • By Product - Halogen compounds segment accounted for the largest market revenue share in 2022

Market Size & Forecast

  • Market Opportunities: USD 106.17 billion 
  • Market Future Opportunities 2023: USD 5.81 billion
  • CAGR from 2023 to 2028 : 8.7%

Market Summary

  • The market encompasses a diverse range of chemicals used to control or prevent the growth of harmful microorganisms in various applications. With growing environmental consciousness and increasing focus on sustainable practices, the market is witnessing significant momentum. One of the primary drivers is the importance of wastewater recycling and water reuse, as biocides play a crucial role in ensuring the safety and quality of recycled water. However, the environmental hazards associated with biocides are a cause for concern. These chemicals can pose risks to human health and the environment if not used and disposed of properly.
  • A real-world business scenario illustrating the significance of biocides in operational efficiency and compliance relates to the water treatment industry. A large manufacturing plant relies on a continuous water supply for its production processes. The plant's wastewater is treated on-site before being discharged into the environment. Biocides are used to control microbial growth in the wastewater treatment process, ensuring the water meets regulatory requirements and maintaining the efficiency of the treatment plant. Effective biocide management not only helps the plant avoid costly fines but also ensures the safety of its workforce and the surrounding community.
  • The challenge lies in balancing the need for effective biocide use with minimizing environmental impact and ensuring safe handling and disposal.

What will be the size of the Biocides Market during the forecast period?

Biocides Market Size

Get Key Insights on Market Forecast (PDF) Request Free Sample

  • The market continues to evolve, driven by the growing demand for effective solutions against biofilm formation, paint biocide effectiveness, and the need to address biocide leaching and controlled release formulations. One significant trend is the increasing focus on polymer antimicrobial properties for soil sterilization techniques and industrial cleaning protocols. In-situ generation biocides, such as glutaraldehyde use and chlorine dioxide generation, are gaining popularity due to their ability to provide continuous disinfection. Ozone disinfection systems and silver nanoparticles use are also becoming increasingly relevant, offering advantages like antimicrobial surface coatings and copper alloy efficacy. Iodine-based sanitizers and hydrogen peroxide application are essential in biofouling prevention and water purification methods.
  • Quaternary ammonia compounds (quats) remain effective in healthcare facility disinfection, food processing sanitation, and wastewater treatment methods. Ultraviolet (UV) disinfection technology plays a crucial role in various industries, including water treatment and healthcare, due to its ability to eliminate microorganisms without the use of chemicals. Formaldehyde release, a concern for many, is being addressed through advancements in biocides technology and stricter regulations. These developments require boardroom-level decisions around compliance, budgeting, and product strategy. For instance, a company may need to invest in new technologies to meet evolving regulations or allocate resources to research and development for innovative biocide solutions.
  • According to recent research, the market is projected to reach a significant value by 2027, driven by the increasing demand for effective and eco-friendly biocides. This growth represents a substantial opportunity for businesses to capitalize on the ongoing advancements in biocides technology and meet the evolving needs of various industries.

Unpacking the Biocides Market Landscape

The market encompasses a diverse range of antimicrobial agents employed to combat antimicrobial resistance and ensure material compatibility in various industries. Biocide synergism, a strategic approach to combining multiple active ingredients, enhances preservative efficacy by up to 30% and reduces the need for higher concentrations of individual biocides (Source: Journal of Industrial and Production Engineering). Effective disinfection efficacy testing and environmental risk assessment are crucial in mitigating persistence in the environment and ensuring alignment with regulatory compliance. Formulation optimization and application methods play a significant role in water treatment chemicals, targeting a broad target organism spectrum while minimizing human health exposure. Biocide registration processes involve rigorous toxicity assessment protocols, stability studies, and degradation pathways to ensure safety and efficacy against pathogens. Industrial hygiene practices and surface disinfection techniques employing advanced labeling requirements and microbial inactivation kinetics further bolster infection control procedures. Pest control chemicals and microbial control methods, including biofilm control strategies, contribute to maintaining optimal product formulation technology and hygiene monitoring systems.

Key Market Drivers Fueling Growth

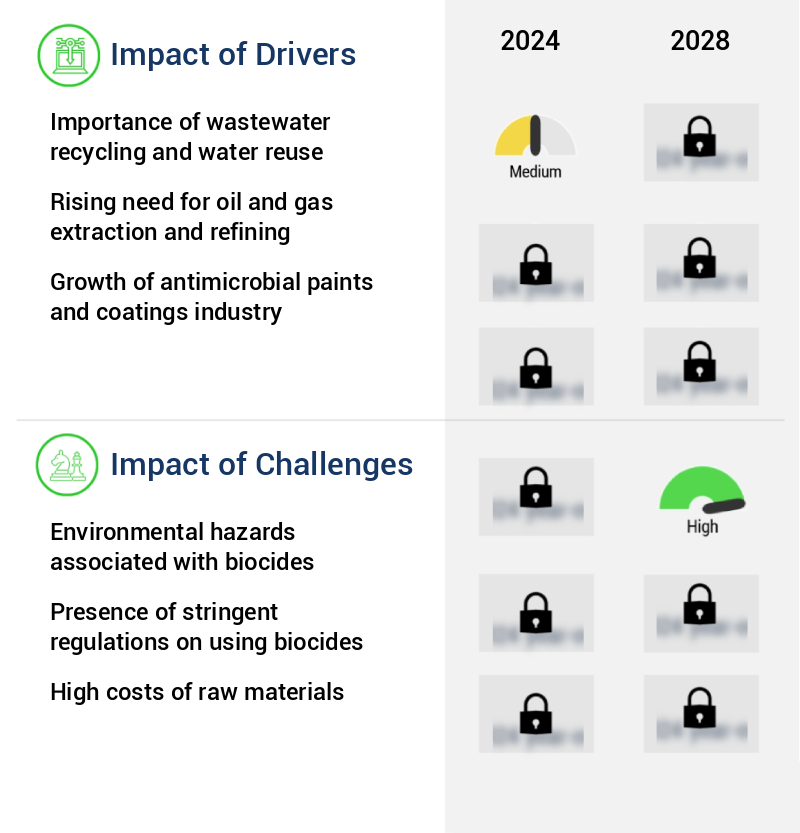
The significance of wastewater recycling and water reuse is a primary driving force in the market, as the need to conserve water resources and reduce strain on freshwater supplies continues to grow.

  • The market is experiencing significant growth due to the evolving water treatment landscape driven by global population growth and urbanization. With an increasing global population, the demand for water and the production of wastewater are surging. According to the US Geological Survey, an individual uses 80-100 gallons of water per day. Inadequate access to safe potable water in some regions necessitates water and wastewater treatment. Biocides play a crucial role in this process, ensuring water safety and wastewater treatment efficiency.
  • For instance, biocides can reduce downtime in water treatment facilities by up to 30%, while enhancing treatment processes' overall efficiency by 15%. These improvements contribute to sustainable water management and support the growing demand for biocides in various sectors, including water treatment, agriculture, and industrial applications.

Prevailing Industry Trends & Opportunities

The healthcare industry's growing demand for biocides represents an emerging market trend. Biocides, a vital class of chemicals used for disinfection and preservation, are increasingly in demand within the healthcare sector. 

  • The market is experiencing significant growth, particularly in the medical and healthcare industry. Specialty biocides are increasingly used in healthcare applications, including medical disposables, diagnostic instruments, and medical devices, due to rising awareness about hospital-acquired infections (HAIs). The market is anticipated to expand at a robust pace during the forecast period, driven by factors such as the increasing use of biocides for coating applications in medical devices like CT scanners, infusion pumps, and X-ray machines. Additionally, environmental concerns, including global climate change, air pollution, and poor sanitization, are fueling the demand for biocides.
  • The market's expansion is further propelled by the outbreaks of fatal diseases, such as HIV, swine flu, Ebola virus disease (EVD), Zika virus (ZIKV), hepatitis, tuberculosis (TB), and rabies. These factors are expected to result in improved product performance and enhanced safety measures in various industries.

Significant Market Challenges

The growth of the industry is significantly impacted by the environmental challenges posed by biocides, as the use of these substances carries potential hazards to the environment. 

  • The market encompasses a diverse range of chemicals used to destroy living organisms, primarily microbes, in various industries. This market's evolving nature is driven by the expanding applications across sectors such as agriculture, water treatment, healthcare, and construction. However, the health and environmental hazards associated with biocides pose a significant challenge. Biocidal products can pose considerable risks to human health and the environment due to their toxic nature. For instance, direct contact with antimicrobial additives may necessitate immediate medical attention. Furthermore, improper disposal of spent biocides can lead to serious environmental consequences. Despite these challenges, the market continues to grow, with innovations focusing on developing less hazardous alternatives.
  • For instance, the use of silver nanoparticles as biocides has shown potential in reducing bacterial growth in water treatment by up to 99.9%. Similarly, the implementation of biocides in construction materials has led to a 40% reduction in mold growth and associated health risks.

Biocides Market Size

In-Depth Market Segmentation: Biocides Market

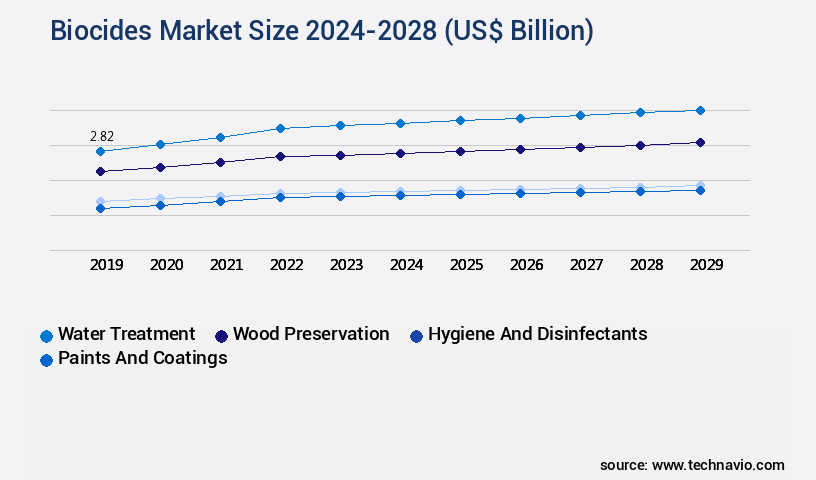
The biocides industry research report provides comprehensive data (region-wise segment analysis), with forecasts and estimates in "USD billion" for the period 2024-2028, as well as historical data from 2018-2022 for the following segments.

  • Application
    • Water treatment
    • Wood preservation
    • Hygiene and disinfectants
    • Paints and coatings
    • Others
  • Product
    • Halogen compounds
    • Nitrogen-based
    • Inorganics
    • Organosulfur
    • Others
  • End-User
    • Industrial
    • Residential
    • Healthcare
    • Food and Beverage
  • Type
    • Oxidizing Biocides
    • Non-oxidizing Biocides
    • Organic Biocides
  • Geography
    • North America
      • US
      • Canada
    • Europe
      • France
      • Germany
      • Italy
      • UK
    • Middle East and Africa
      • Egypt
      • KSA
      • Oman
      • UAE
    • APAC
      • China
      • India
      • Japan
    • South America
      • Argentina
      • Brazil
    • Rest of World (ROW)

    By Application Insights

    The water treatment segment is estimated to witness significant growth during the forecast period.

    The market encompasses a diverse range of antimicrobial agents used to prevent or eliminate microorganisms in various industries and applications. With the rising concerns over antimicrobial resistance, material compatibility testing, and biocide synergism, the market continues to evolve and expand. Preservative efficacy and disinfection efficacy testing, environmental risk assessment, persistence in the environment, and formulation optimization are crucial aspects of biocide development. Water treatment chemicals dominate the market, accounting for a significant share due to the growing need for microbial control in water and wastewater treatment. Biocides are essential in preventing the growth of harmful pathogens, including bacteria, viruses, fungi, and algae, in water sources, distribution networks, and storage tanks.

    Chlorine, bromine, ozone, copper, and silver ions are among the frequently used biocides in water treatment applications. These biocides not only ensure access to clean water but also prevent pollution of rivers and oceans. Industrial hygiene practices and surface disinfection techniques further expand the market's scope. Labeling requirements, release rate kinetics, microbial inactivation kinetics, active ingredient concentration, toxicity assessment protocols, biocide stability studies, and biocide degradation pathways are essential factors influencing market trends. The application methods and product formulation technology continue to advance, enabling more effective and efficient biocide solutions. Hygiene monitoring systems and human health exposure assessments are also critical aspects of the market.

    The market is vast and dynamic, catering to various industries and applications, from infection control procedures and biocide registration processes to pest control chemicals and microbial control methods, including biofilm control strategies.

    Biocides Market Size

    Request Free Sample

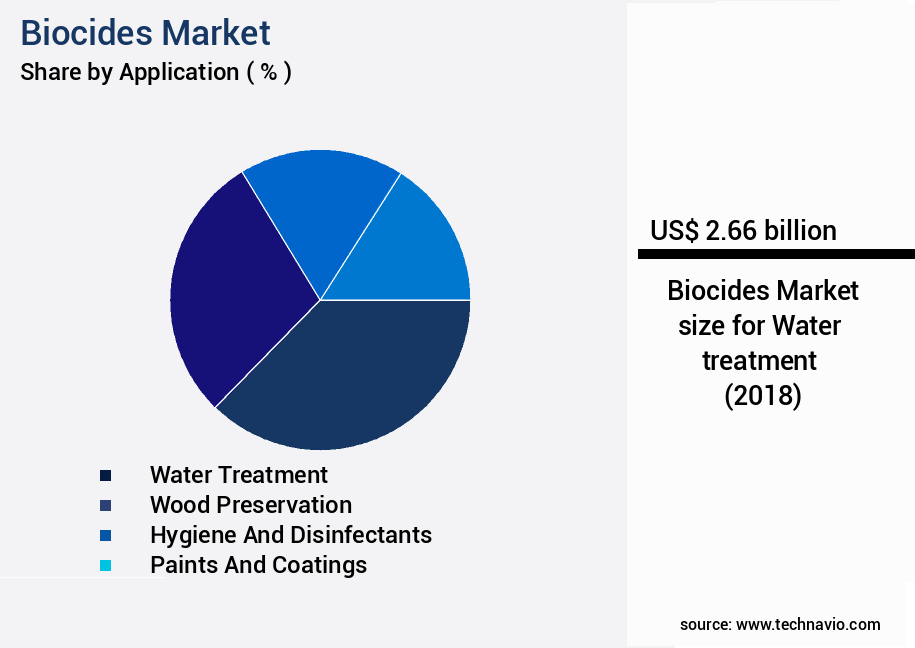
    The Water treatment segment was valued at USD 2.66 billion in 2018 and showed a gradual increase during the forecast period.

    Biocides Market Size

    Request Free Sample

    Regional Analysis

    North America is estimated to contribute 35% to the growth of the global market during the forecast period.Technavio’s analysts have elaborately explained the regional trends and drivers that shape the market during the forecast period.

    Biocides Market Share by Geography

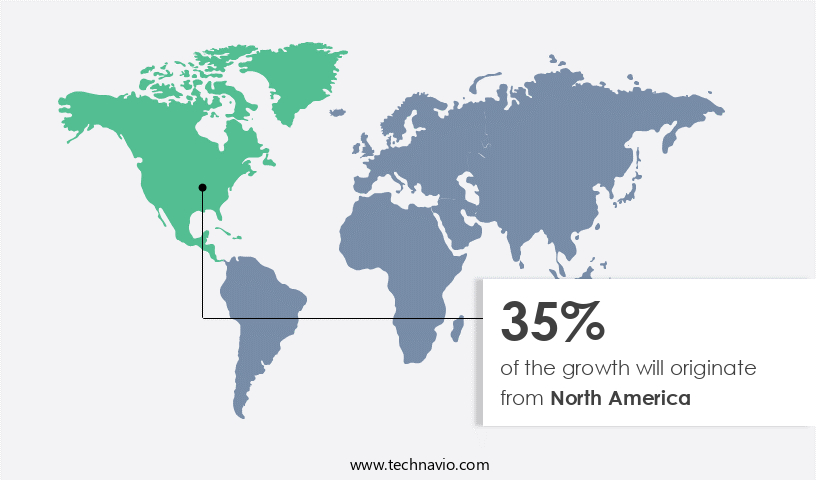
    See How Biocides Market Demand is Rising in North America Request Free Sample

    The market in North America is experiencing significant growth due to the increasing demand for biocides in various applications, including water and wastewater treatment, wood preservatives, paints and coatings, oil and gas, agriculture, and antifouling. Biocides play a crucial role in preventing the spread of contagious diseases in industrial areas and healthcare facilities. Regulatory compliance is another key driver, with regulations such as the Canadian Environmental Protection Act (CEPA), the Federal Instrumented, Fungicide, and Rodenticide Act (FIFRA), and the US Federal Food, Drug, and Cosmetic Act (FFDCA) encouraging their use in industries like oil and gas, paints and coatings, agriculture, and maritime sectors.

    According to industry reports, the North American the market is projected to grow at a robust pace, with the water and wastewater treatment segment accounting for a substantial market share. The use of biocides in these applications leads to operational efficiency gains and cost reductions by preventing contamination and ensuring regulatory compliance.

    Biocides Market Share by Geography

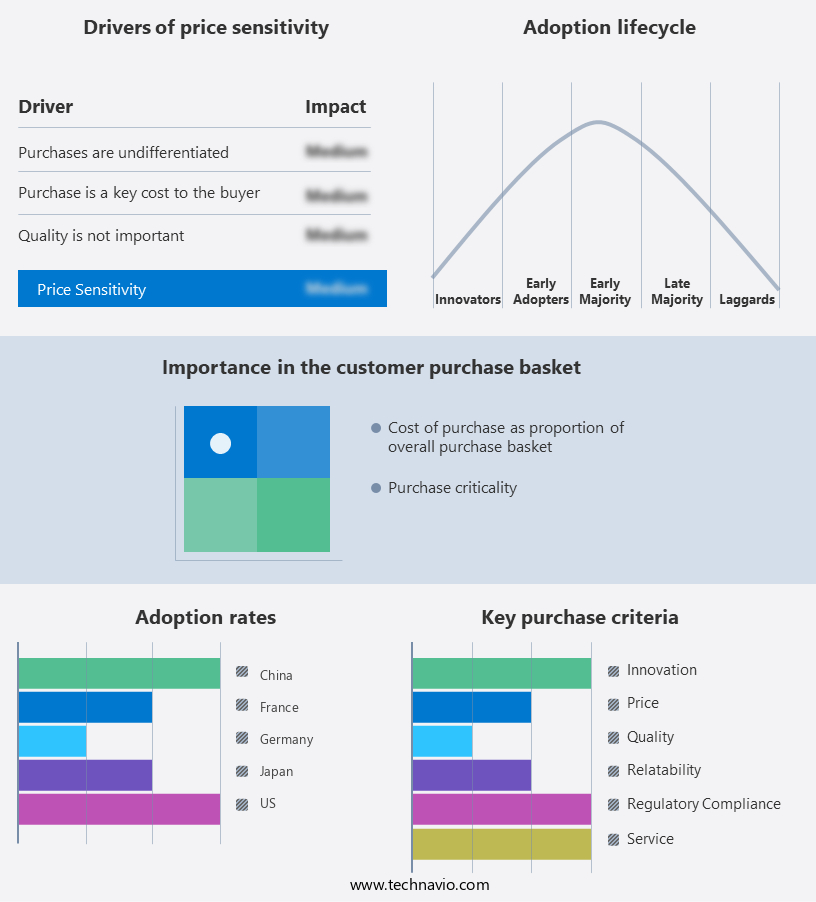
     Customer Landscape of Biocides Industry

    Competitive Intelligence by Technavio Analysis: Leading Players in the Biocides Market

    Companies are implementing various strategies, such as strategic alliances, biocides market forecast, partnerships, mergers and acquisitions, geographical expansion, and product/service launches, to enhance their presence in the industry.

    Arxada - This company specializes in the production and supply of biocides, including Sanibrom 40, which find applications in agriculture as fertilizers and in battery electrolytes. Additionally, these biocides serve as essential components in the manufacturing process for pigments, fillers, and paper processing aids.

    The industry research and growth report includes detailed analyses of the competitive landscape of the market and information about key companies, including:

    • Arxada
    • BASF SE
    • Berkshire Hathaway (Lubrizol)
    • Buckman Laboratories
    • ChemTreat
    • Clariant AG
    • Dow Inc.
    • DuPont
    • Ecolab
    • Evonik Industries
    • Italmatch Chemicals
    • Kemira
    • LANXESS
    • Lonza Group
    • Nouryon
    • Solenis
    • Solvay S.A.
    • Thor Group
    • Troy Corporation
    • Veolia Water Technologies

    Qualitative and quantitative analysis of companies has been conducted to help clients understand the wider business environment as well as the strengths and weaknesses of key industry players. Data is qualitatively analyzed to categorize companies as pure play, category-focused, industry-focused, and diversified; it is quantitatively analyzed to categorize companies as dominant, leading, strong, tentative, and weak.

    Recent Development and News in Biocides Market

    • In August 2024, BASF SE, a leading global chemical producer, announced the launch of its new biocide product, Isocure TP 500, designed for water treatment applications. This innovative product is based on tetrakis (hydroxymethyl) phosphonium sulfate (THPS) technology and offers enhanced performance and sustainability (BASF press release, August 2024).
    • In November 2024, Solvay and Clariant, two major players in the biocides industry, entered into a strategic collaboration to develop and commercialize a new range of biocides for water treatment and coatings applications. This partnership combines Solvay's expertise in specialty chemicals and Clariant's knowledge in biocides, aiming to create innovative and sustainable solutions (Solvay press release, November 2024).
    • In February 2025, Lanxess AG, a specialty chemicals company, acquired Biotecne S.A., a Spanish biotechnology firm specializing in the production of biocides based on natural raw materials. This acquisition strengthens Lanxess' biocides portfolio and enhances its position in the market for eco-friendly biocides (Lanxess press release, February 2025).
    • In May 2025, the European Chemicals Agency (ECHA) approved the renewal of the active substance registration for pentachlorophenol (PCP), a widely used biocide. This approval, following a rigorous evaluation process, ensures the continued availability of PCP in the European market for specific applications (ECHA press release, May 2025).

    Dive into Technavio’s robust research methodology, blending expert interviews, extensive data synthesis, and validated models for unparalleled Biocides Market insights. See full methodology.

    Market Scope

    Report Coverage

    Details

    Page number

    176

    Base year

    2023

    Historic period

    2018-2022

    Forecast period

    2024-2028

    Growth momentum & CAGR

    Accelerate at a CAGR of 8.7%

    Market growth 2024-2028

    USD 5.81 billion

    Market structure

    Fragmented

    YoY growth 2023-2024(%)

    7.56

    Key countries

    US, Canada, Germany, UK, Italy, France, China, India, Japan, Brazil, Egypt, UAE, Oman, Argentina, KSA, UAE, Brazil, and Rest of World (ROW)

    Competitive landscape

    Leading Companies, Market Positioning of Companies, Competitive Strategies, and Industry Risks

    Request Free Sample

    Why Choose Technavio for Biocides Market Insights?

    "Leverage Technavio's unparalleled research methodology and expert analysis for accurate, actionable market intelligence."

    The market encompasses a wide range of chemicals used to control microbial growth in various industries, including agriculture, water treatment, healthcare, and manufacturing. The efficacy of biocides against specific bacteria is a critical factor in their selection for specific applications. Testing methods for determining biocide degradation and assessing their environmental impact are essential for ensuring regulatory compliance and minimizing potential risks. Factors influencing biocide performance in real-world applications are diverse, including formulation composition, microbial resistance mechanisms, and environmental conditions. Regulatory guidelines for biocide registration, such as the European Biocidal Products Regulation (BPR), set stringent requirements for safety and efficacy. Biocide stability in various products is another crucial consideration. Methods for determining biocide stability and evaluating interactions between different biocides in mixtures are essential for optimizing supply chain logistics and operational planning. The influence of formulation composition on biocide effectiveness is a significant research area, with efforts underway to develop new biocides with reduced environmental impact. Strategies for controlling biocide resistance development, such as rotating biocide types and implementing resistance management programs, are essential for maintaining long-term efficacy. Comparative efficacy studies of different biocide types are essential for selecting the most effective biocide for specific applications. Biocide selection criteria include factors such as cost, environmental impact, and resistance potential. Environmental conditions significantly impact biocide efficacy, making monitoring biocide residue levels in different environments essential for ensuring regulatory compliance and minimizing potential risks to human health and the environment. The development of novel antimicrobial surface coatings and improved application techniques for enhanced biocide efficacy is an area of ongoing research and innovation in the market. Sustainable biocide options, such as natural biocides and biodegradable formulations, are gaining popularity due to increasing environmental concerns. In conclusion, the market is a dynamic and complex industry that requires a deep understanding of the efficacy, environmental impact, and regulatory requirements of various biocides. Effective management of biocide selection, application, and monitoring is crucial for maintaining product quality, ensuring regulatory compliance, and minimizing potential risks to human health and the environment.

    What are the Key Data Covered in this Biocides Market Research and Growth Report?

    • What is the expected growth of the Biocides Market between 2024 and 2028?

      • USD 5.81 billion, at a CAGR of 8.7%

    • What segmentation does the market report cover?

      • The report is segmented by Application (Water treatment, Wood preservation, Hygiene and disinfectants, Paints and coatings, and Others), Product (Halogen compounds, Nitrogen-based, Inorganics, Organosulfur, and Others), Geography (North America, APAC, Europe, South America, and Middle East and Africa), End-User (Industrial, Residential, Healthcare, and Food and Beverage), and Type (Oxidizing Biocides, Non-oxidizing Biocides, and Organic Biocides)

    • Which regions are analyzed in the report?

      • North America, APAC, Europe, South America, and Middle East and Africa

    • What are the key growth drivers and market challenges?

      • Importance of wastewater recycling and water reuse, Environmental hazards associated with biocides

    • Who are the major players in the Biocides Market?

      • Arxada, BASF SE, Berkshire Hathaway (Lubrizol), Buckman Laboratories, ChemTreat, Clariant AG, Dow Inc., DuPont, Ecolab, Evonik Industries, Italmatch Chemicals, Kemira, LANXESS, Lonza Group, Nouryon, Solenis, Solvay S.A., Thor Group, Troy Corporation, and Veolia Water Technologies

    We can help! Our analysts can customize this biocides market research report to meet your requirements.

    Get in touch

    1 Executive Summary

    • 1.1 Market overview
      • Exhibit 01: Executive Summary – Chart on Market Overview
      • Exhibit 02: Executive Summary – Data Table on Market Overview
      • Exhibit 03: Executive Summary – Chart on Global Market Characteristics
      • Exhibit 04: Executive Summary – Chart on Market by Geography
      • Exhibit 05: Executive Summary – Chart on Market Segmentation by Application
      • Exhibit 06: Executive Summary – Chart on Market Segmentation by Product
      • Exhibit 07: Executive Summary – Chart on Incremental Growth
      • Exhibit 08: Executive Summary – Data Table on Incremental Growth
      • Exhibit 09: Executive Summary – Chart on Vendor Market Positioning

    2 Market Landscape

    • 2.1 Market ecosystem
      • Exhibit 10: Parent market
      • Exhibit 11: Market Characteristics

    3 Market Sizing

    • 3.1 Market definition
      • Exhibit 12: Offerings of vendors included in the market definition
    • 3.2 Market segment analysis
      • Exhibit 13: Market segments
    • 3.3 Market size 2023
      • 3.4 Market outlook: Forecast for 2023-2028
        • Exhibit 14: Chart on Global - Market size and forecast 2023-2028 ($ million)
        • Exhibit 15: Data Table on Global - Market size and forecast 2023-2028 ($ million)
        • Exhibit 16: Chart on Global Market: Year-over-year growth 2023-2028 (%)
        • Exhibit 17: Data Table on Global Market: Year-over-year growth 2023-2028 (%)

      4 Historic Market Size

      • 4.1 Global biocides market 2018 - 2022
        • Exhibit 18: Historic Market Size – Data Table on global biocides market 2018 - 2022 ($ million)
      • 4.2 Application Segment Analysis 2018 - 2022
        • Exhibit 19: Historic Market Size – Application Segment 2018 - 2022 ($ million)
      • 4.3 Product Segment Analysis 2018 - 2022
        • Exhibit 20: Historic Market Size – Product Segment 2018 - 2022 ($ million)
      • 4.4 Geography Segment Analysis 2018 - 2022
        • Exhibit 21: Historic Market Size – Geography Segment 2018 - 2022 ($ million)
      • 4.5 Country Segment Analysis 2018 - 2022
        • Exhibit 22: Historic Market Size – Country Segment 2018 - 2022 ($ million)

      5 Five Forces Analysis

      • 5.1 Five forces summary
        • Exhibit 23: Five forces analysis - Comparison between 2023 and 2028
      • 5.2 Bargaining power of buyers
        • Exhibit 24: Chart on Bargaining power of buyers – Impact of key factors 2023 and 2028
      • 5.3 Bargaining power of suppliers
        • Exhibit 25: Bargaining power of suppliers – Impact of key factors in 2023 and 2028
      • 5.4 Threat of new entrants
        • Exhibit 26: Threat of new entrants – Impact of key factors in 2023 and 2028
      • 5.5 Threat of substitutes
        • Exhibit 27: Threat of substitutes – Impact of key factors in 2023 and 2028
      • 5.6 Threat of rivalry
        • Exhibit 28: Threat of rivalry – Impact of key factors in 2023 and 2028
      • 5.7 Market condition
        • Exhibit 29: Chart on Market condition - Five forces 2023 and 2028

      6 Market Segmentation by Application

      • 6.1 Market segments
        • Chart on Application - Market share (2023-2028) (%)
        • Data Table on Application - Market share (2023-2028) (%)
      • 6.2 Comparison by Application
        • Chart on Comparison by Application
        • Data Table on Comparison by Application
      • 6.3 Water treatment - Market size and forecast (2023-2028)
        • Chart on Water treatment - Market size and forecast (2023-2028) ($ million)
        • Data Table on Water treatment - Market size and forecast (2023-2028) ($ million)
        • Chart on Water treatment - Year-over-year growth (2023-2028) (%)
        • Data Table on Water treatment - Year-over-year growth (2023-2028) (%)
      • 6.4 Wood preservation - Market size and forecast (2023-2028)
        • Chart on Wood preservation - Market size and forecast (2023-2028) ($ million)
        • Data Table on Wood preservation - Market size and forecast (2023-2028) ($ million)
        • Chart on Wood preservation - Year-over-year growth (2023-2028) (%)
        • Data Table on Wood preservation - Year-over-year growth (2023-2028) (%)
      • 6.5 Hygiene and disinfectants - Market size and forecast (2023-2028)
        • Chart on Hygiene and disinfectants - Market size and forecast (2023-2028) ($ million)
        • Data Table on Hygiene and disinfectants - Market size and forecast (2023-2028) ($ million)
        • Chart on Hygiene and disinfectants - Year-over-year growth (2023-2028) (%)
        • Data Table on Hygiene and disinfectants - Year-over-year growth (2023-2028) (%)
      • 6.6 Paints and coatings - Market size and forecast (2023-2028)
        • Chart on Paints and coatings - Market size and forecast (2023-2028) ($ million)
        • Data Table on Paints and coatings - Market size and forecast (2023-2028) ($ million)
        • Chart on Paints and coatings - Year-over-year growth (2023-2028) (%)
        • Data Table on Paints and coatings - Year-over-year growth (2023-2028) (%)
      • 6.7 Others - Market size and forecast (2023-2028)
        • Chart on Others - Market size and forecast (2023-2028) ($ million)
        • Data Table on Others - Market size and forecast (2023-2028) ($ million)
        • Chart on Others - Year-over-year growth (2023-2028) (%)
        • Data Table on Others - Year-over-year growth (2023-2028) (%)
      • 6.8 Market opportunity by Application
        • Market opportunity by Application ($ million)
        • Data Table on Market opportunity by Application ($ million)

      7 Market Segmentation by Product

      • 7.1 Market segments
        • Chart on Product - Market share (2023-2028) (%)
        • Data Table on Product - Market share (2023-2028) (%)
      • 7.2 Comparison by Product
        • Chart on Comparison by Product
        • Data Table on Comparison by Product
      • 7.3 Halogen compounds - Market size and forecast (2023-2028)
        • Chart on Halogen compounds - Market size and forecast (2023-2028) ($ million)
        • Data Table on Halogen compounds - Market size and forecast (2023-2028) ($ million)
        • Chart on Halogen compounds - Year-over-year growth (2023-2028) (%)
        • Data Table on Halogen compounds - Year-over-year growth (2023-2028) (%)
      • 7.4 Nitrogen-based - Market size and forecast (2023-2028)
        • Chart on Nitrogen-based - Market size and forecast (2023-2028) ($ million)
        • Data Table on Nitrogen-based - Market size and forecast (2023-2028) ($ million)
        • Chart on Nitrogen-based - Year-over-year growth (2023-2028) (%)
        • Data Table on Nitrogen-based - Year-over-year growth (2023-2028) (%)
      • 7.5 Inorganics - Market size and forecast (2023-2028)
        • Chart on Inorganics - Market size and forecast (2023-2028) ($ million)
        • Data Table on Inorganics - Market size and forecast (2023-2028) ($ million)
        • Chart on Inorganics - Year-over-year growth (2023-2028) (%)
        • Data Table on Inorganics - Year-over-year growth (2023-2028) (%)
      • 7.6 Organosulfur - Market size and forecast (2023-2028)
        • Chart on Organosulfur - Market size and forecast (2023-2028) ($ million)
        • Data Table on Organosulfur - Market size and forecast (2023-2028) ($ million)
        • Chart on Organosulfur - Year-over-year growth (2023-2028) (%)
        • Data Table on Organosulfur - Year-over-year growth (2023-2028) (%)
      • 7.7 Others - Market size and forecast (2023-2028)
        • Chart on Others - Market size and forecast (2023-2028) ($ million)
        • Data Table on Others - Market size and forecast (2023-2028) ($ million)
        • Chart on Others - Year-over-year growth (2023-2028) (%)
        • Data Table on Others - Year-over-year growth (2023-2028) (%)
      • 7.8 Market opportunity by Product
        • Market opportunity by Product ($ million)
        • Data Table on Market opportunity by Product ($ million)

      8 Market Segmentation by End-User

      • 8.1 Market segments
        • Chart on End-User - Market share (2023-2028) (%)
        • Data Table on End-User - Market share (2023-2028) (%)
      • 8.2 Comparison by End-User
        • Chart on Comparison by End-User
        • Data Table on Comparison by End-User
      • 8.3 Industrial - Market size and forecast (2023-2028)
        • Chart on Industrial - Market size and forecast (2023-2028) ($ million)
        • Data Table on Industrial - Market size and forecast (2023-2028) ($ million)
        • Chart on Industrial - Year-over-year growth (2023-2028) (%)
        • Data Table on Industrial - Year-over-year growth (2023-2028) (%)
      • 8.4 Residential - Market size and forecast (2023-2028)
        • Chart on Residential - Market size and forecast (2023-2028) ($ million)
        • Data Table on Residential - Market size and forecast (2023-2028) ($ million)
        • Chart on Residential - Year-over-year growth (2023-2028) (%)
        • Data Table on Residential - Year-over-year growth (2023-2028) (%)
      • 8.5 Healthcare - Market size and forecast (2023-2028)
        • Chart on Healthcare - Market size and forecast (2023-2028) ($ million)
        • Data Table on Healthcare - Market size and forecast (2023-2028) ($ million)
        • Chart on Healthcare - Year-over-year growth (2023-2028) (%)
        • Data Table on Healthcare - Year-over-year growth (2023-2028) (%)
      • 8.6 Food and Beverage - Market size and forecast (2023-2028)
        • Chart on Food and Beverage - Market size and forecast (2023-2028) ($ million)
        • Data Table on Food and Beverage - Market size and forecast (2023-2028) ($ million)
        • Chart on Food and Beverage - Year-over-year growth (2023-2028) (%)
        • Data Table on Food and Beverage - Year-over-year growth (2023-2028) (%)
      • 8.7 Market opportunity by End-User
        • Market opportunity by End-User ($ million)
        • Data Table on Market opportunity by End-User ($ million)

      9 Market Segmentation by Type

      • 9.1 Market segments
        • Chart on Type - Market share (2023-2028) (%)
        • Data Table on Type - Market share (2023-2028) (%)
      • 9.2 Comparison by Type
        • Chart on Comparison by Type
        • Data Table on Comparison by Type
      • 9.3 Oxidizing Biocides - Market size and forecast (2023-2028)
        • Chart on Oxidizing Biocides - Market size and forecast (2023-2028) ($ million)
        • Data Table on Oxidizing Biocides - Market size and forecast (2023-2028) ($ million)
        • Chart on Oxidizing Biocides - Year-over-year growth (2023-2028) (%)
        • Data Table on Oxidizing Biocides - Year-over-year growth (2023-2028) (%)
      • 9.4 Non-oxidizing Biocides - Market size and forecast (2023-2028)
        • Chart on Non-oxidizing Biocides - Market size and forecast (2023-2028) ($ million)
        • Data Table on Non-oxidizing Biocides - Market size and forecast (2023-2028) ($ million)
        • Chart on Non-oxidizing Biocides - Year-over-year growth (2023-2028) (%)
        • Data Table on Non-oxidizing Biocides - Year-over-year growth (2023-2028) (%)
      • 9.5 Organic Biocides - Market size and forecast (2023-2028)
        • Chart on Organic Biocides - Market size and forecast (2023-2028) ($ million)
        • Data Table on Organic Biocides - Market size and forecast (2023-2028) ($ million)
        • Chart on Organic Biocides - Year-over-year growth (2023-2028) (%)
        • Data Table on Organic Biocides - Year-over-year growth (2023-2028) (%)
      • 9.6 Market opportunity by Type
        • Market opportunity by Type ($ million)
        • Data Table on Market opportunity by Type ($ million)

      8 Customer Landscape

      • 8.1 Customer landscape overview
        • Exhibit 82: Analysis of price sensitivity, lifecycle, customer purchase basket, adoption rates, and purchase criteria

      9 Geographic Landscape

      • 9.1 Geographic segmentation
        • Exhibit 83: Chart on Market share by geography 2023-2028 (%)
        • Exhibit 84: Data Table on Market share by geography 2023-2028 (%)
      • 9.2 Geographic comparison
        • Exhibit 85: Chart on Geographic comparison
        • Exhibit 86: Data Table on Geographic comparison
      • 9.3 North America - Market size and forecast 2023-2028
        • Exhibit 87: Chart on North America - Market size and forecast 2023-2028 ($ million)
        • Exhibit 88: Data Table on North America - Market size and forecast 2023-2028 ($ million)
        • Exhibit 89: Chart on North America - Year-over-year growth 2023-2028 (%)
        • Exhibit 90: Data Table on North America - Year-over-year growth 2023-2028 (%)
      • 9.4 APAC - Market size and forecast 2023-2028
        • Exhibit 91: Chart on APAC - Market size and forecast 2023-2028 ($ million)
        • Exhibit 92: Data Table on APAC - Market size and forecast 2023-2028 ($ million)
        • Exhibit 93: Chart on APAC - Year-over-year growth 2023-2028 (%)
        • Exhibit 94: Data Table on APAC - Year-over-year growth 2023-2028 (%)
      • 9.5 Europe - Market size and forecast 2023-2028
        • Exhibit 95: Chart on Europe - Market size and forecast 2023-2028 ($ million)
        • Exhibit 96: Data Table on Europe - Market size and forecast 2023-2028 ($ million)
        • Exhibit 97: Chart on Europe - Year-over-year growth 2023-2028 (%)
        • Exhibit 98: Data Table on Europe - Year-over-year growth 2023-2028 (%)
      • 9.6 South America - Market size and forecast 2023-2028
        • Exhibit 99: Chart on South America - Market size and forecast 2023-2028 ($ million)
        • Exhibit 100: Data Table on South America - Market size and forecast 2023-2028 ($ million)
        • Exhibit 101: Chart on South America - Year-over-year growth 2023-2028 (%)
        • Exhibit 102: Data Table on South America - Year-over-year growth 2023-2028 (%)
      • 9.7 Middle East and Africa - Market size and forecast 2023-2028
        • Exhibit 103: Chart on Middle East and Africa - Market size and forecast 2023-2028 ($ million)
        • Exhibit 104: Data Table on Middle East and Africa - Market size and forecast 2023-2028 ($ million)
        • Exhibit 105: Chart on Middle East and Africa - Year-over-year growth 2023-2028 (%)
        • Exhibit 106: Data Table on Middle East and Africa - Year-over-year growth 2023-2028 (%)
      • 9.8 US - Market size and forecast 2023-2028
        • Exhibit 107: Chart on US - Market size and forecast 2023-2028 ($ million)
        • Exhibit 108: Data Table on US - Market size and forecast 2023-2028 ($ million)
        • Exhibit 109: Chart on US - Year-over-year growth 2023-2028 (%)
        • Exhibit 110: Data Table on US - Year-over-year growth 2023-2028 (%)
      • 9.9 China - Market size and forecast 2023-2028
        • Exhibit 111: Chart on China - Market size and forecast 2023-2028 ($ million)
        • Exhibit 112: Data Table on China - Market size and forecast 2023-2028 ($ million)
        • Exhibit 113: Chart on China - Year-over-year growth 2023-2028 (%)
        • Exhibit 114: Data Table on China - Year-over-year growth 2023-2028 (%)
      • 9.10 Germany - Market size and forecast 2023-2028
        • Exhibit 115: Chart on Germany - Market size and forecast 2023-2028 ($ million)
        • Exhibit 116: Data Table on Germany - Market size and forecast 2023-2028 ($ million)
        • Exhibit 117: Chart on Germany - Year-over-year growth 2023-2028 (%)
        • Exhibit 118: Data Table on Germany - Year-over-year growth 2023-2028 (%)
      • 9.11 France - Market size and forecast 2023-2028
        • Exhibit 119: Chart on France - Market size and forecast 2023-2028 ($ million)
        • Exhibit 120: Data Table on France - Market size and forecast 2023-2028 ($ million)
        • Exhibit 121: Chart on France - Year-over-year growth 2023-2028 (%)
        • Exhibit 122: Data Table on France - Year-over-year growth 2023-2028 (%)
      • 9.12 Japan - Market size and forecast 2023-2028
        • Exhibit 123: Chart on Japan - Market size and forecast 2023-2028 ($ million)
        • Exhibit 124: Data Table on Japan - Market size and forecast 2023-2028 ($ million)
        • Exhibit 125: Chart on Japan - Year-over-year growth 2023-2028 (%)
        • Exhibit 126: Data Table on Japan - Year-over-year growth 2023-2028 (%)
      • 9.13 Market opportunity by geography
        • Exhibit 127: Market opportunity by geography ($ million)
        • Exhibit 128: Data Tables on Market opportunity by geography ($ million)
      • 11.14 Canada - Market size and forecast (2023-2028)
        • Chart on Canada - Market size and forecast (2023-2028) ($ million)
        • Data Table on Canada - Market size and forecast (2023-2028) ($ million)
        • Chart on Canada - Year-over-year growth (2023-2028) (%)
        • Data Table on Canada - Year-over-year growth (2023-2028) (%)
      • 11.15 UK - Market size and forecast (2023-2028)
        • Chart on UK - Market size and forecast (2023-2028) ($ million)
        • Data Table on UK - Market size and forecast (2023-2028) ($ million)
        • Chart on UK - Year-over-year growth (2023-2028) (%)
        • Data Table on UK - Year-over-year growth (2023-2028) (%)
      • 11.16 Italy - Market size and forecast (2023-2028)
        • Chart on Italy - Market size and forecast (2023-2028) ($ million)
        • Data Table on Italy - Market size and forecast (2023-2028) ($ million)
        • Chart on Italy - Year-over-year growth (2023-2028) (%)
        • Data Table on Italy - Year-over-year growth (2023-2028) (%)
      • 11.17 India - Market size and forecast (2023-2028)
        • Chart on India - Market size and forecast (2023-2028) ($ million)
        • Data Table on India - Market size and forecast (2023-2028) ($ million)
        • Chart on India - Year-over-year growth (2023-2028) (%)
        • Data Table on India - Year-over-year growth (2023-2028) (%)
      • 11.18 Brazil - Market size and forecast (2023-2028)
        • Chart on Brazil - Market size and forecast (2023-2028) ($ million)
        • Data Table on Brazil - Market size and forecast (2023-2028) ($ million)
        • Chart on Brazil - Year-over-year growth (2023-2028) (%)
        • Data Table on Brazil - Year-over-year growth (2023-2028) (%)
      • 11.19 Egypt - Market size and forecast (2023-2028)
        • Chart on Egypt - Market size and forecast (2023-2028) ($ million)
        • Data Table on Egypt - Market size and forecast (2023-2028) ($ million)
        • Chart on Egypt - Year-over-year growth (2023-2028) (%)
        • Data Table on Egypt - Year-over-year growth (2023-2028) (%)
      • 11.20 UAE - Market size and forecast (2023-2028)
        • Chart on UAE - Market size and forecast (2023-2028) ($ million)
        • Data Table on UAE - Market size and forecast (2023-2028) ($ million)
        • Chart on UAE - Year-over-year growth (2023-2028) (%)
        • Data Table on UAE - Year-over-year growth (2023-2028) (%)
      • 11.21 Oman - Market size and forecast (2023-2028)
        • Chart on Oman - Market size and forecast (2023-2028) ($ million)
        • Data Table on Oman - Market size and forecast (2023-2028) ($ million)
        • Chart on Oman - Year-over-year growth (2023-2028) (%)
        • Data Table on Oman - Year-over-year growth (2023-2028) (%)
      • 11.22 Argentina - Market size and forecast (2023-2028)
        • Chart on Argentina - Market size and forecast (2023-2028) ($ million)
        • Data Table on Argentina - Market size and forecast (2023-2028) ($ million)
        • Chart on Argentina - Year-over-year growth (2023-2028) (%)
        • Data Table on Argentina - Year-over-year growth (2023-2028) (%)
      • 11.23 KSA - Market size and forecast (2023-2028)
        • Chart on KSA - Market size and forecast (2023-2028) ($ million)
        • Data Table on KSA - Market size and forecast (2023-2028) ($ million)
        • Chart on KSA - Year-over-year growth (2023-2028) (%)
        • Data Table on KSA - Year-over-year growth (2023-2028) (%)
      • 11.24 UAE - Market size and forecast (2023-2028)
        • Chart on UAE - Market size and forecast (2023-2028) ($ million)
        • Data Table on UAE - Market size and forecast (2023-2028) ($ million)
        • Chart on UAE - Year-over-year growth (2023-2028) (%)
        • Data Table on UAE - Year-over-year growth (2023-2028) (%)
      • 11.25 Brazil - Market size and forecast (2023-2028)
        • Chart on Brazil - Market size and forecast (2023-2028) ($ million)
        • Data Table on Brazil - Market size and forecast (2023-2028) ($ million)
        • Chart on Brazil - Year-over-year growth (2023-2028) (%)
        • Data Table on Brazil - Year-over-year growth (2023-2028) (%)
      • 11.26 Rest of World (ROW) - Market size and forecast (2023-2028)
        • Chart on Rest of World (ROW) - Market size and forecast (2023-2028) ($ million)
        • Data Table on Rest of World (ROW) - Market size and forecast (2023-2028) ($ million)
        • Chart on Rest of World (ROW) - Year-over-year growth (2023-2028) (%)
        • Data Table on Rest of World (ROW) - Year-over-year growth (2023-2028) (%)

      10 Drivers, Challenges, and Trends

      • 10.1 Market drivers
        • 10.2 Market challenges
          • 10.3 Impact of drivers and challenges
            • Exhibit 129: Impact of drivers and challenges in 2023 and 2028
          • 10.4 Market trends

            11 Vendor Landscape

            • 11.1 Overview
              • 11.2 Vendor landscape
                • Exhibit 130: Overview on Criticality of inputs and Factors of differentiation
              • 11.3 Landscape disruption
                • Exhibit 131: Overview on factors of disruption
              • 11.4 Industry risks
                • Exhibit 132: Impact of key risks on business

              14 Competitive Analysis

              • 14.1 Companies profiled
                • Companies covered
              • 14.2 Market positioning of companies
                • Matrix on companies position and classification
              • 14.3 Arxada
                • Arxada - Overview
                • Arxada - Product / Service
                • Arxada - Key offerings
              • 14.4 BASF SE
                • BASF SE - Overview
                • BASF SE - Product / Service
                • BASF SE - Key offerings
              • 14.5 Berkshire Hathaway (Lubrizol)
                • Berkshire Hathaway (Lubrizol) - Overview
                • Berkshire Hathaway (Lubrizol) - Product / Service
                • Berkshire Hathaway (Lubrizol) - Key offerings
              • 14.6 Buckman Laboratories
                • Buckman Laboratories - Overview
                • Buckman Laboratories - Product / Service
                • Buckman Laboratories - Key offerings
              • 14.7 ChemTreat
                • ChemTreat - Overview
                • ChemTreat - Product / Service
                • ChemTreat - Key offerings
              • 14.8 Clariant AG
                • Clariant AG - Overview
                • Clariant AG - Product / Service
                • Clariant AG - Key offerings
              • 14.9 Dow Inc.
                • Dow Inc. - Overview
                • Dow Inc. - Product / Service
                • Dow Inc. - Key offerings
              • 14.10 DuPont
                • DuPont - Overview
                • DuPont - Product / Service
                • DuPont - Key offerings
              • 14.11 Ecolab
                • Ecolab - Overview
                • Ecolab - Product / Service
                • Ecolab - Key offerings
              • 14.12 Evonik Industries
                • Evonik Industries - Overview
                • Evonik Industries - Product / Service
                • Evonik Industries - Key offerings
              • 14.13 Italmatch Chemicals
                • Italmatch Chemicals - Overview
                • Italmatch Chemicals - Product / Service
                • Italmatch Chemicals - Key offerings
              • 14.14 Kemira
                • Kemira - Overview
                • Kemira - Product / Service
                • Kemira - Key offerings
              • 14.15 LANXESS
                • LANXESS - Overview
                • LANXESS - Product / Service
                • LANXESS - Key offerings
              • 14.16 Lonza Group
                • Lonza Group - Overview
                • Lonza Group - Product / Service
                • Lonza Group - Key offerings
              • 14.17 Nouryon
                • Nouryon - Overview
                • Nouryon - Product / Service
                • Nouryon - Key offerings
              • 14.18 Solenis
                • Solenis - Overview
                • Solenis - Product / Service
                • Solenis - Key offerings
              • 14.19 Solvay S.A.
                • Solvay S.A. - Overview
                • Solvay S.A. - Product / Service
                • Solvay S.A. - Key offerings
              • 14.20 Thor Group
                • Thor Group - Overview
                • Thor Group - Product / Service
                • Thor Group - Key offerings
              • 14.21 Troy Corporation
                • Troy Corporation - Overview
                • Troy Corporation - Product / Service
                • Troy Corporation - Key offerings
              • 14.22 Veolia Water Technologies
                • Veolia Water Technologies - Overview
                • Veolia Water Technologies - Product / Service
                • Veolia Water Technologies - Key offerings
              • 14.23 Albemarle Corp.
                • Albemarle Corp. - Overview
                • Albemarle Corp. - Product / Service
                • Albemarle Corp. - Key offerings
              • 14.24 Baker Hughes Co.
                • Baker Hughes Co. - Overview
                • Baker Hughes Co. - Product / Service
                • Baker Hughes Co. - Key offerings
              • 14.25 BASF SE
                • BASF SE - Overview
                • BASF SE - Product / Service
                • BASF SE - Key offerings
              • 14.26 Berkshire Hathaway Inc.
                • Berkshire Hathaway Inc. - Overview
                • Berkshire Hathaway Inc. - Product / Service
                • Berkshire Hathaway Inc. - Key offerings
              • 14.27 Buckman Laboratories lnternational Inc.
                • Buckman Laboratories lnternational Inc. - Overview
                • Buckman Laboratories lnternational Inc. - Product / Service
                • Buckman Laboratories lnternational Inc. - Key offerings
              • 14.28 Clariant International Ltd.
                • Clariant International Ltd. - Overview
                • Clariant International Ltd. - Product / Service
                • Clariant International Ltd. - Key offerings
              • 14.29 Eckoh 
                • Eckoh  - Overview
                • Eckoh  - Product / Service
                • Eckoh  - Key offerings
              • 14.30 Ecolab Inc.
                • Ecolab Inc. - Overview
                • Ecolab Inc. - Product / Service
                • Ecolab Inc. - Key offerings
              • 14.31 HIKAL Ltd.
                • HIKAL Ltd. - Overview
                • HIKAL Ltd. - Product / Service
                • HIKAL Ltd. - Key offerings
              • 14.32 Lanxess AG
                • Lanxess AG - Overview
                • Lanxess AG - Product / Service
                • Lanxess AG - Key offerings
              • 14.33 Lonza Group Ltd.
                • Lonza Group Ltd. - Overview
                • Lonza Group Ltd. - Product / Service
                • Lonza Group Ltd. - Key offerings
              • 14.34 Merck KGaA
                • Merck KGaA - Overview
                • Merck KGaA - Product / Service
                • Merck KGaA - Key offerings
              • 14.35 Nouryon Chemicals Holding BV
                • Nouryon Chemicals Holding BV - Overview
                • Nouryon Chemicals Holding BV - Product / Service
                • Nouryon Chemicals Holding BV - Key offerings
              • 14.36 Solvay SA
                • Solvay SA - Overview
                • Solvay SA - Product / Service
                • Solvay SA - Key offerings
              • 14.37 Thor Group Ltd.
                • Thor Group Ltd. - Overview
                • Thor Group Ltd. - Product / Service
                • Thor Group Ltd. - Key offerings

              13 Appendix

              • 13.1 Scope of the report
                • 13.2 Inclusions and exclusions checklist
                  • Exhibit 202: Inclusions checklist
                  • Exhibit 203: Exclusions checklist
                • 13.3 Currency conversion rates for US$
                  • Exhibit 204: Currency conversion rates for US$
                • 13.4 Research methodology
                  • Exhibit 205: Research methodology
                  • Exhibit 206: Validation techniques employed for market sizing
                  • Exhibit 207: Information sources
                • 13.5 List of abbreviations
                  • Exhibit 208: List of abbreviations

                Research Methodology

                Technavio presents a detailed picture of the market by way of study, synthesis, and summation of data from multiple sources. The analysts have presented the various facets of the market with a particular focus on identifying the key industry influencers. The data thus presented is comprehensive, reliable, and the result of extensive research, both primary and secondary.

                INFORMATION SOURCES

                Primary sources

                • Manufacturers and suppliers
                • Channel partners
                • Industry experts
                • Strategic decision makers

                Secondary sources

                • Industry journals and periodicals
                • Government data
                • Financial reports of key industry players
                • Historical data
                • Press releases

                DATA ANALYSIS

                Data Synthesis

                • Collation of data
                • Estimation of key figures
                • Analysis of derived insights

                Data Validation

                • Triangulation with data models
                • Reference against proprietary databases
                • Corroboration with industry experts

                REPORT WRITING

                Qualitative

                • Market drivers
                • Market challenges
                • Market trends
                • Five forces analysis

                Quantitative

                • Market size and forecast
                • Market segmentation
                • Geographical insights
                • Competitive landscape

                Interested in this report?

                Get your sample now to see our research methodology and insights!

                Download Now

                Frequently Asked Questions

                Biocides market growth will increase by $ 5.81 bn during 2024-2028 .

                The Biocides market is expected to grow at a CAGR of 8.7% during 2024-2028 .

                Biocides market is segmented by Application( Water treatment, Wood preservation, Hygiene and disinfectants, Paints and coatings, Others) Product( Halogen compounds, Nitrogen-based, Inorganics, Organosulfur, Others)

                Arxada, BASF SE, Berkshire Hathaway (Lubrizol), Buckman Laboratories, ChemTreat, Clariant AG, Dow Inc., DuPont, Ecolab, Evonik Industries, Italmatch Chemicals, Kemira, LANXESS, Lonza Group, Nouryon, Solenis, Solvay S.A., Thor Group, Troy Corporation, Veolia Water Technologies are a few of the key vendors in the Biocides market.

                North America will register the highest growth rate of 35% among the other regions. Therefore, the Biocides market in North America is expected to garner significant business opportunities for the vendors during the forecast period.

                US, Canada, Germany, UK, Italy, France, China, India, Japan, Brazil, Egypt, UAE, Oman, Argentina, KSA, UAE, Brazil, Rest of World (ROW)

                • Importance of wastewater recycling and water reuseGlobal population growth and rapidly developing urbanization have led to an increasing need to recycle and reuse wastewater across the world. Due to improvements in the living standards of people and the increasing per capita consumption of water is the driving factor this market.
                • the demand for water and the production of wastewater are growing rapidly around the world. According to the US Geological Survey (USGS) is the driving factor this market.
                • an individual uses 80-100 gallons of water per day across the world. In addition is the driving factor this market.
                • in some parts of the world is the driving factor this market.
                • access to safe potable water or water for sanitation and waste disposal still remains inadequate. Therefore is the driving factor this market.
                • the need for water and wastewater treatment is significant. The significant increase in the generation of wastewater and the growing need for wastewater treatment are likely to increase the demand for biocides. Water and wastewater recycling is an important area of focus for research and development (R and D) in various industries due to rising environmental concerns and the increasing consumption of water across the world. Biocides are widely utilized in water and wastewater treatment applications in the food and beverage is the driving factor this market.
                • pharmaceutical is the driving factor this market.
                • chemical is the driving factor this market.
                • and petrochemical industries. The highly effective purification properties of biocides make them a preferred choice in such industries is the driving factor this market.
                • especially for the removal of various contaminants and pollutants from wastewater. The reprocessing of wastewater generated by local municipal bodies and industrial sectors may play an important role in addressing the need for water if it is treated properly is the driving factor this market.
                • with the aim of achieving the highest possible quality. Nevertheless is the driving factor this market.
                • in the case of applications that do not require drinking-quality water is the driving factor this market.
                • recycled water is frequently used. Recycled wastewater requires sophisticated and advanced treatment solutions is the driving factor this market.
                • including the use of effective chemicals. Thus is the driving factor this market.
                • the rising need for water and wastewater treatment worldwide is expected to drive the growth of the global biocides market during the forecast period. is the driving factor this market.

                The Biocides market vendors should focus on grabbing business opportunities from the Water treatment segment as it accounted for the largest market share in the base year.