Industrial Lighting Market Size 2025-2029
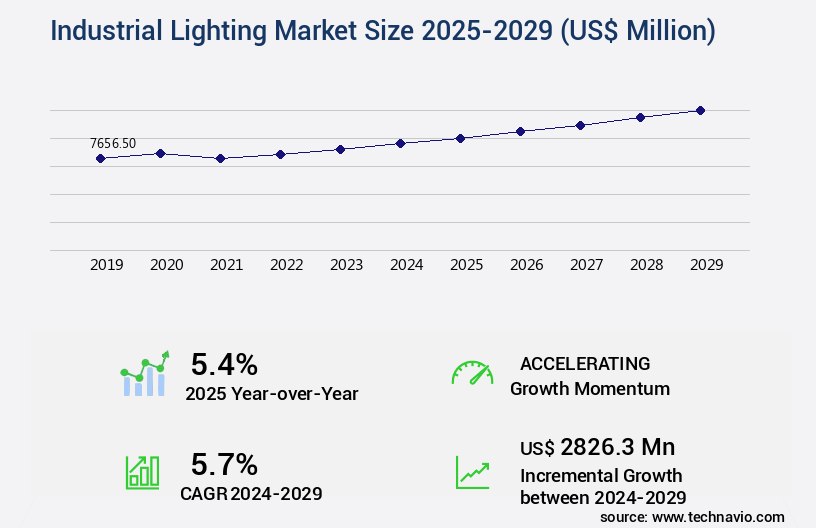
The industrial lighting market size is valued to increase USD 2.83 billion, at a CAGR of 5.7% from 2024 to 2029. Rise in adoption of energy-efficient lighting technologies will drive the industrial lighting market.
Major Market Trends & Insights
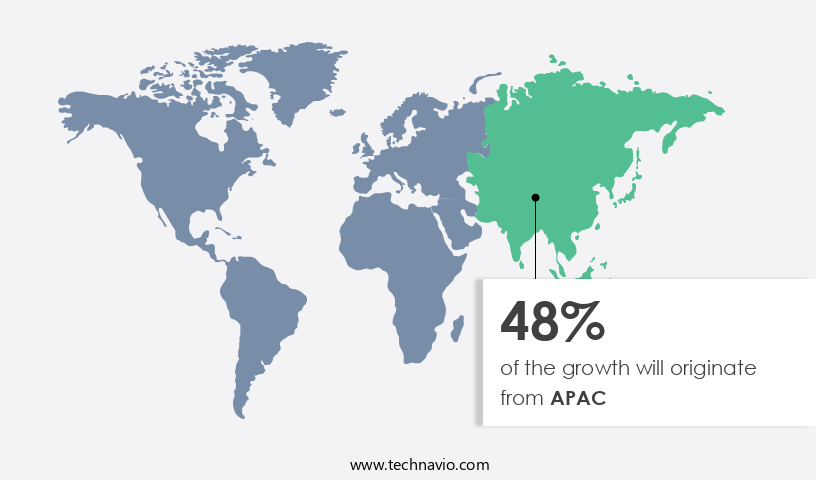
- APAC dominated the market and accounted for a 48% growth during the forecast period.
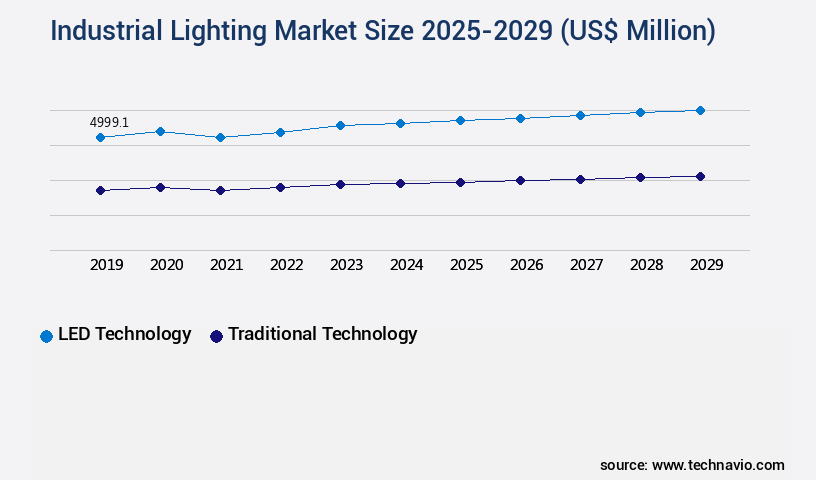
- By Type - LED technology segment was valued at USD 5 billion in 2023
- By Application - Warehouse & Cold Storage segment accounted for the largest market revenue share in 2023
Market Size & Forecast
- Market Opportunities: USD 52.85 million
- Market Future Opportunities: USD 2826.30 million
- CAGR from 2024 to 2029 : 5.7%
Market Summary
- The market encompasses the production, sales, and installation of lighting solutions designed for industrial applications. This market is driven by the ongoing rise in adoption of energy-efficient lighting technologies, with LED lighting leading the charge. According to a recent report, LED lighting is projected to account for over 70% of the market share by 2025. However, the high initial cost of industrial lighting solutions remains a significant challenge for market growth. Core technologies in the market continue to evolve, with advancements in LED technology, smart lighting systems, and wireless connectivity driving innovation. Applications for industrial lighting span various industries, including manufacturing, construction, and oil and gas, among others.
- Regulatory compliance, such as energy efficiency standards and safety regulations, also play a crucial role in shaping the market. Despite these challenges, opportunities abound for market growth, including the increasing demand for automation and the integration of lighting systems with other industrial IoT devices. As the industrial sector continues to digitize, the role of lighting solutions in optimizing energy usage, improving safety, and enhancing productivity will only become more significant.
What will be the Size of the Industrial Lighting Market during the forecast period?
Get Key Insights on Market Forecast (PDF) Request Free Sample
How is the Industrial Lighting Market Segmented ?
The industrial lighting industry research report provides comprehensive data (region-wise segment analysis), with forecasts and estimates in "USD million" for the period 2025-2029, as well as historical data from 2019-2023 for the following segments.
- Type
- LED technology
- Traditional technology
- Application
- Warehouse & Cold Storage
- Factory & Production Lines
- Outer Premises
- Parking Areas
- Hazardous Locations
- Others
- Product
- Industrial linear lighting
- Spot lighting
- Flood lighting/area lighting
- High bay lighting
- Light Source
- LED Lighting
- High Intensity Discharge (HID) Lighting
- Fluorescent Lighting
- Others
- End Use
- Manufacturing
- Oil and Gas
- Mining
- Automotive
- Pharmaceuticals & Chemicals
- Geography
- North America
- US
- Canada
- Europe
- France
- Germany
- Italy
- UK
- APAC
- China
- India
- Japan
- South Korea
- Rest of World (ROW)
- North America
By Type Insights
The led technology segment is estimated to witness significant growth during the forecast period.
The market is experiencing significant growth as businesses adopt LED technology for its energy-saving characteristics and decreasing costs. According to recent reports, LED components and LED-based luminaires account for over 30% of the market share. In Japan, the penetration of LEDs surged due to the Fukushima nuclear disaster and the subsequent energy crisis, leading to a 45% increase in LED adoption. Furthermore, the European Commission's decision to ban low-voltage halogen lamps will accelerate LED penetration during the forecast period. The replacement market is the primary driver of growth in the LED technology segment. The energy efficiency and compatibility with existing lighting fixtures make LEDs an attractive alternative to traditional lighting systems.
In addition, smart lighting systems, such as those with remote monitoring, maintenance scheduling, and data analytics, are gaining popularity. These systems offer energy efficiency, improved illuminance levels, and enhanced electrical safety. Moreover, the integration of sensors and light pollution reduction technologies is a growing trend in the market. Human-centric lighting, which focuses on the impact of light on human health and productivity, is also gaining traction. This includes the use of tunable white lighting, color temperature adjustments, and spectral power distribution optimization. The market also includes various installation methods, such as recessed, surface, and suspended installations, and different lighting applications, including ambient, accent, task, emergency, and street lighting.
The importance of photometric data, color rendering index, and thermal management in the design and implementation of industrial lighting systems cannot be overstated. The market is expected to grow by over 25% in the next five years, driven by the increasing demand for energy-efficient lighting solutions and the growing adoption of smart lighting systems. The market's dynamism is evident in the continuous evolution of lighting technologies, design software, and installation methods. The integration of IoT, AI, and data analytics is set to transform the industry further. The fixture lifespan of LED lighting systems is significantly longer than that of traditional lighting systems, making them a cost-effective long-term investment for businesses.
The ongoing research and development in LED technology, lighting design software, and lighting controls further enhance the market's potential.
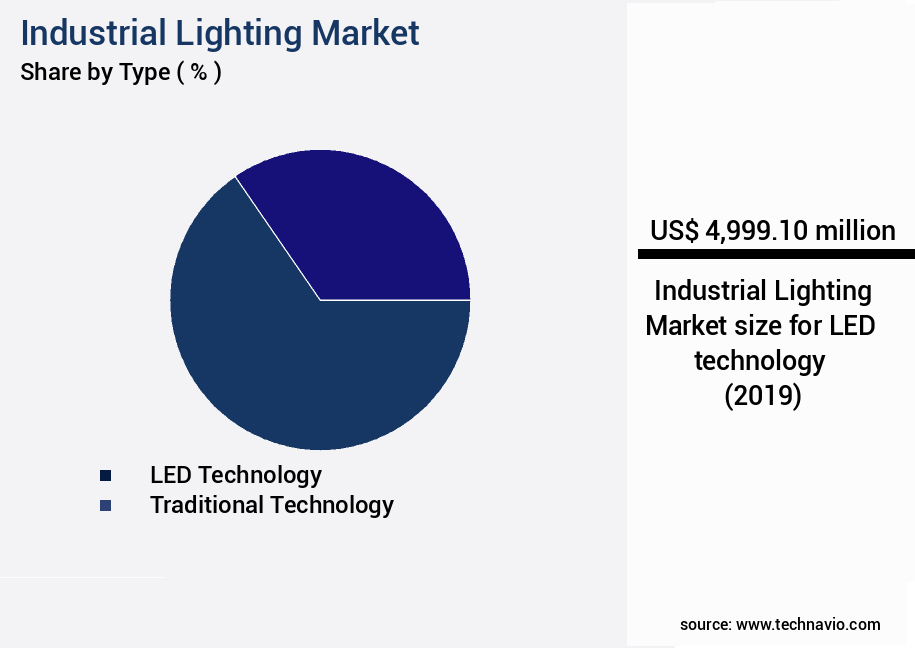
The LED technology segment was valued at USD 5 billion in 2019 and showed a gradual increase during the forecast period.
Regional Analysis
APAC is estimated to contribute 48% to the growth of the global market during the forecast period.Technavio's analysts have elaborately explained the regional trends and drivers that shape the market during the forecast period.
See How Industrial Lighting Market Demand is Rising in APAC Request Free Sample
In the Asia Pacific (APAC) region, China holds a significant share of the market due to the presence of numerous LED manufacturing units and industries. Since 2010, the Chinese government has offered subsidies for Metal-Organic Chemical Vapor Deposition (MOCVD) technology, enabling numerous players to enter the market and invest in MOCVD tools for LED die manufacturing. With over 450 smart city projects under construction, China's upcoming smart cities are poised to fuel the growth of the regional the market substantially during the forecast period. Japan is another major contributor to the market expansion in APAC. The maturity of commercial LED lighting products in Japan has led manufacturers to concentrate on the industrial lighting segment, making it a promising growth area.
Market Dynamics
Our researchers analyzed the data with 2024 as the base year, along with the key drivers, trends, and challenges. A holistic analysis of drivers will help companies refine their marketing strategies to gain a competitive advantage.
The market encompasses a diverse range of applications, from high-bay LED fixtures in manufacturing facilities to street lighting and outdoor installations. A critical factor influencing the market's growth is the emphasis on high-performance thermal management in high-bay LED fixtures, which ensures optimal efficacy and longevity. The efficacy of different LED driver topologies is a significant consideration, as energy efficiency and cost savings are key drivers for industrial lighting upgrades. Lighting design plays a crucial role in visual comfort and productivity, with the color rendering index (CRI) being a key metric in workplace environments. In the realm of street lighting, energy consumption reduction strategies are a primary focus, with optimizing LED luminaire spectral power distribution being a key consideration.
Comparatively, more than 70% of new industrial lighting projects prioritize energy efficiency retrofits in existing facilities. Smart lighting systems and building automation integration are gaining traction, with comparison of wireless lighting control protocols and assessing the impact of different light distribution patterns being essential factors. Design considerations for human-centric lighting are increasingly important, as the impact of lighting on worker productivity is well-documented. When evaluating LED fixture lifespan, accelerated testing plays a vital role in assessing performance and reliability. Luminaire selection criteria for industrial applications include energy efficiency, cost, and application-specific requirements. The implementation of daylight harvesting strategies and evaluation of various smart lighting system features contribute to overall energy savings and operational efficiency.
A minority of players in the market, less than 15%, dominate the high-end instrument market, with a significant focus on innovation and advanced technology. The comparison of different LED light source types, such as COB and modular, offers various benefits and trade-offs, depending on the application. Measuring and managing light pollution levels surrounding industrial areas is a growing concern, with potential solutions including the use of shielding and dimming technologies.
What are the key market drivers leading to the rise in the adoption of Industrial Lighting Industry?
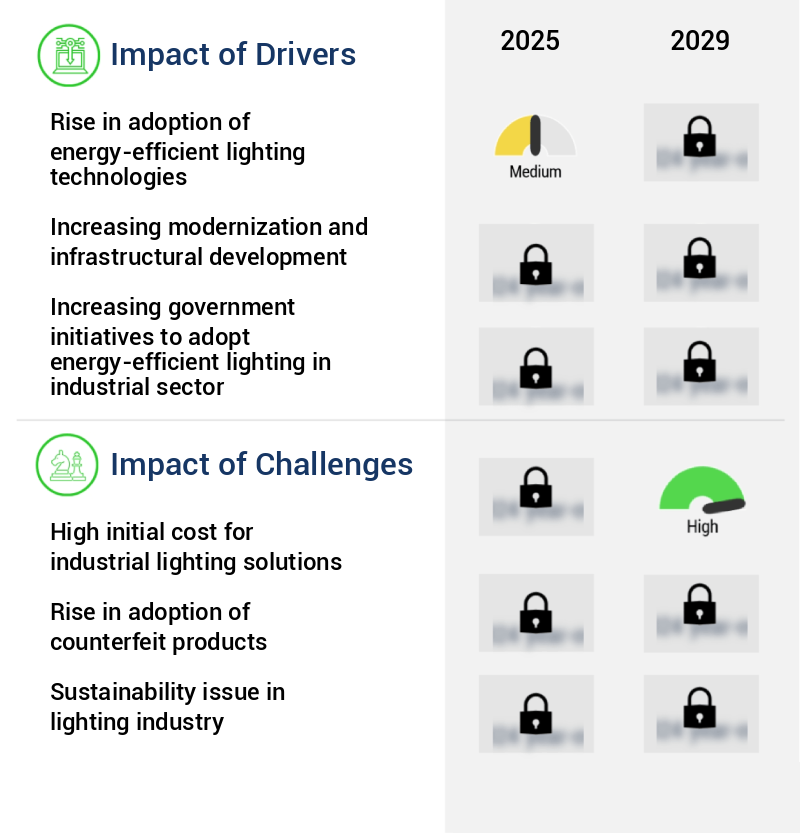
- The significant increase in the adoption of energy-efficient lighting technologies serves as the primary market driver.
- The market is undergoing a transformation, with energy-efficient lighting technologies gaining significant traction. This shift is primarily fueled by the numerous advantages offered by these solutions to industrial facilities. Among the various energy-efficient alternatives, LED technology has emerged as a preferred choice. Its energy efficiency, long lifespan, and exceptional performance across diverse industrial applications have made it a popular replacement for traditional lighting systems. One of the primary reasons for the increasing adoption of LED lighting is the substantial energy cost savings it provides. Industrial facilities, which often rely on extensive lighting systems, are recognizing the potential for substantial reductions in energy consumption and operational expenses by transitioning to LED.
- According to industry data, LED lighting can save up to 80% of the energy consumed by conventional lighting systems. This significant energy savings, coupled with the long lifespan and robust performance of LED lights, makes them an attractive investment for industrial facilities. Furthermore, LED lighting is versatile and can be effectively used in various industrial applications, including warehouses, manufacturing plants, and outdoor lighting. In summary, the market is witnessing a shift towards energy-efficient solutions, with LED technology leading the charge. This trend is driven by the substantial energy savings, long lifespan, and superior performance offered by LED lighting, making it an essential investment for industrial facilities.
What are the market trends shaping the Industrial Lighting Industry?
- In the industrial sector, ongoing advancements in lighting technologies represent the current market trend.
- The market is undergoing significant transformations, driven by the emergence of advanced lighting technologies. Innovations such as smart lighting systems, connected lighting controls, and sensor-enabled applications are redefining industrial lighting, providing enhanced capabilities, operational efficiencies, and adaptive functionalities. Smart lighting systems, in particular, are gaining traction with their integrated intelligent controls and advanced features. These systems leverage sensors, wireless connectivity, and data-driven algorithms to optimize energy usage and performance. For instance, a smart lighting system in a manufacturing facility can adjust illumination levels based on real-time occupancy data, maximizing energy savings while maintaining adequate lighting for production tasks.
- This dynamic response to industrial environments underscores the potential of smart lighting systems to revolutionize industrial lighting and contribute to overall business efficiency.
What challenges does the Industrial Lighting Industry face during its growth?
- The high initial cost of implementing industrial lighting solutions poses a significant challenge and hinders the growth of the industry.
- The high initial investment in industrial lighting solutions, including the purchase and installation of various fixtures, has posed a substantial challenge for The market. Ceiling lights range from USD75 to USD1,200, chandeliers cost between USD400 and USD6,500, fluorescent lights are priced between USD75 and USD425, LED strip costs USD70 to USD400, light bars are priced at USD350 to USD600, pendant lights cost between USD70 and USD4,800, recessed lights range from USD100 to USD500, and track lighting is priced between USD100 and USD800.
- Wall-mounted lights cost between USD180 and USD950. The higher upfront cost of LED lighting, despite its energy efficiency and longevity advantages, has hindered its widespread adoption in comparison to traditional lighting technologies like incandescent and fluorescent lighting.
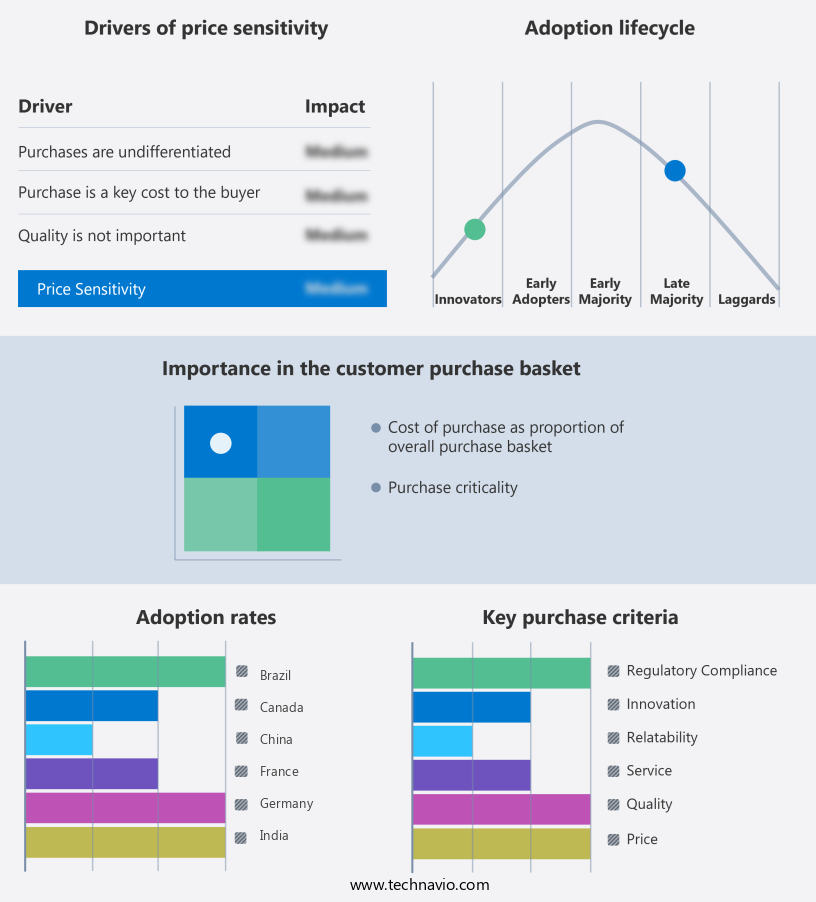
Exclusive Technavio Analysis on Customer Landscape
The industrial lighting market forecasting report includes the adoption lifecycle of the market, covering from the innovator's stage to the laggard's stage. It focuses on adoption rates in different regions based on penetration. Furthermore, the industrial lighting market report also includes key purchase criteria and drivers of price sensitivity to help companies evaluate and develop their market growth analysis strategies.
Customer Landscape of Industrial Lighting Industry
Competitive Landscape
Companies are implementing various strategies, such as strategic alliances, industrial lighting market forecast, partnerships, mergers and acquisitions, geographical expansion, and product/service launches, to enhance their presence in the industry.
Acuity Brands Inc. - This company specializes in industrial lighting, providing innovative solutions for various applications. Their offerings include Linear High Bay, Low Bay, and Modular Wiring systems, designed for energy efficiency and durability. These lighting solutions cater to diverse industries and applications, enhancing operational efficiency and safety.
The industry research and growth report includes detailed analyses of the competitive landscape of the market and information about key companies, including:
- Acuity Brands Inc.
- ams OSRAM AG
- Bajaj Electricals Ltd.
- Dialight PLC
- Eaton Corp plc
- Emerson Electric Co.
- General Electric Co.
- Glamox AS
- Hubbell Inc.
- Iwasaki Electric Co. Ltd.
- Legrand SA
- Mulinsen Co. Ltd.
- Panasonic Holdings Corp.
- RAB Lighting Inc.
- Signify NV
- TRILUX GmbH and Co. KG
- Wipro Ltd.
- Wolfspeed Inc.
- Zumtobel Group AG
Qualitative and quantitative analysis of companies has been conducted to help clients understand the wider business environment as well as the strengths and weaknesses of key industry players. Data is qualitatively analyzed to categorize companies as pure play, category-focused, industry-focused, and diversified; it is quantitatively analyzed to categorize companies as dominant, leading, strong, tentative, and weak.
Recent Development and News in Industrial Lighting Market
- In January 2024, Philips Hue, a leading player in the market, introduced its new line of energy-efficient LED industrial luminaires, the MasterColor Infinity Dimmable, at the Light + Building trade fair in Frankfurt, Germany (Philips Hue Press Release, 2024). This expansion marks a significant strategic move, as Philips Hue aims to cater to the growing demand for energy-efficient and customizable industrial lighting solutions.
- In March 2024, Osram, another key player, announced its partnership with Microsoft to develop connected lighting systems using Azure IoT and AI technologies. This collaboration is expected to enable real-time energy management and optimize lighting systems based on occupancy and ambient light conditions (Osram Press Release, 2024).
- In April 2025, Signify, the parent company of Philips Hue, acquired Interlight, a leading European industrial lighting manufacturer. This acquisition is expected to strengthen Signify's position in the European the market and expand its product portfolio (Signify Press Release, 2025).
- In May 2025, the European Union passed the new Energy Performance of Buildings Directive, which mandates the installation of energy-efficient lighting systems in all new and existing non-residential buildings. This regulatory approval is expected to create significant opportunities for the market players, as they race to meet the new requirements (European Parliament and Council of the European Union, 2025).
Dive into Technavio's robust research methodology, blending expert interviews, extensive data synthesis, and validated models for unparalleled Industrial Lighting Market insights. See full methodology.
|
Market Scope |
|
|
Report Coverage |
Details |
|
Page number |
210 |
|
Base year |
2024 |
|
Historic period |
2019-2023 |
|
Forecast period |
2025-2029 |
|
Growth momentum & CAGR |
Accelerate at a CAGR of 5.7% |
|
Market growth 2025-2029 |
USD 2826.3 million |
|
Market structure |
Fragmented |
|
YoY growth 2024-2025(%) |
5.4 |
|
Key countries |
China, US, Japan, Germany, Canada, UK, India, South Korea, France, and Italy |
|
Competitive landscape |
Leading Companies, Market Positioning of Companies, Competitive Strategies, and Industry Risks |
Research Analyst Overview
- In the dynamic and evolving market, innovations and advancements continue to shape the landscape. IP ratings, a crucial consideration for ensuring electrical safety, have gained significant attention. Sensor integration and remote monitoring have become essential features in modern lighting systems, enabling real-time data analytics and optimized energy efficiency. Illuminance levels, a key performance indicator, have seen a shift towards higher standards to enhance worker productivity and safety. Luminous flux, an essential measure of the total amount of light emitted, has gained importance as manufacturers strive for more efficient and effective lighting solutions. Light pollution, a growing concern, has led to increased focus on photometric data and spectral power distribution to minimize unwanted light emission.
- Human centric lighting, with its emphasis on color rendering index and tunable white lighting, has emerged as a popular choice for creating healthier and more productive work environments. Smart lighting systems, incorporating maintenance scheduling, ambient and accent lighting, and energy efficiency features, have gained widespread adoption. LED technology, with its superior energy efficiency and longevity, has become the go-to choice for low-bay and high-bay lighting applications. Installation methods, such as daylight harvesting and luminaire design, have evolved to minimize power consumption and optimize thermal management. Light distribution and lighting controls have become increasingly sophisticated, enabling precise light placement and energy savings.
- Street lighting, a significant market segment, has seen advancements in fixture lifespan and emergency lighting capabilities. Task lighting, another crucial application, has benefited from improvements in power consumption and color temperature. Overall, the market continues to evolve, driven by advancements in technology, changing regulations, and evolving customer needs.
What are the Key Data Covered in this Industrial Lighting Market Research and Growth Report?
-
What is the expected growth of the Industrial Lighting Market between 2025 and 2029?
-
USD 2.83 billion, at a CAGR of 5.7%
-
-
What segmentation does the market report cover?
-
The report is segmented by Type (LED technology and Traditional technology), Application (Warehouse & Cold Storage, Factory & Production Lines, Outer Premises, Parking Areas, Hazardous Locations, and Others), Geography (APAC, Europe, North America, South America, Middle East and Africa, and Rest of World (ROW)), Product (Industrial linear lighting, Spot lighting, Flood lighting/area lighting, and High bay lighting), Light Source (LED Lighting, High Intensity Discharge (HID) Lighting, Fluorescent Lighting, and Others), and End Use (Manufacturing, Oil and Gas, Mining, Automotive, and Pharmaceuticals & Chemicals)
-
-
Which regions are analyzed in the report?
-
APAC, Europe, North America, South America, and Middle East and Africa
-
-
What are the key growth drivers and market challenges?
-
Rise in adoption of energy-efficient lighting technologies, High initial cost for industrial lighting solutions
-
-
Who are the major players in the Industrial Lighting Market?
-
Acuity Brands Inc., ams OSRAM AG, Bajaj Electricals Ltd., Dialight PLC, Eaton Corp plc, Emerson Electric Co., General Electric Co., Glamox AS, Hubbell Inc., Iwasaki Electric Co. Ltd., Legrand SA, Mulinsen Co. Ltd., Panasonic Holdings Corp., RAB Lighting Inc., Signify NV, TRILUX GmbH and Co. KG, Wipro Ltd., Wolfspeed Inc., and Zumtobel Group AG
-
Market Research Insights
- The market encompasses a diverse range of lighting solutions designed for commercial and industrial applications. With a growing emphasis on energy efficiency and sustainability, the market continues to evolve, integrating advanced technologies and adhering to evolving building codes and zoning regulations. A key factor driving market growth is the increasing adoption of energy-efficient lighting technologies, such as LED, which offer significant energy savings and improved light output ratio. For instance, LED lighting solutions can offer up to 80% energy savings compared to traditional lighting technologies.
- Additionally, the integration of smart city initiatives, wireless communication, and occupancy sensors further enhances energy efficiency and contributes to overall market growth. However, the market's complexities extend beyond energy efficiency. Factors such as testing standards, visual comfort, heat sink design, and material selection play crucial roles in ensuring product quality and compliance with various regulations. For example, manufacturers must adhere to power factor requirements, which can impact energy efficiency and overall system performance. By focusing on these aspects, market participants can deliver high-performing, cost-effective, and sustainable lighting solutions that meet the evolving needs of the industrial sector.
We can help! Our analysts can customize this industrial lighting market research report to meet your requirements.
 RIA -
RIA - 
