Lighting Fixtures Market Analysis APAC, Europe, North America, Middle East and Africa, South America - US, China, India, Germany, UK - Size and Forecast 2024-2028

Lighting Fixtures Market Analysis APAC, Europe, North America, Middle East and Africa, South America - US, China, India, Germany, UK - Size and Forecast 2024-2028

Published: Oct 2023 164 Pages SKU: IRTNTR76580

Market Overview at a Glance

$32.82 B
Market Opportunity
5.63%
CAGR
5.39
YoY growth 2023-2024(%)

Lighting Fixtures Market Size 2024-2028 

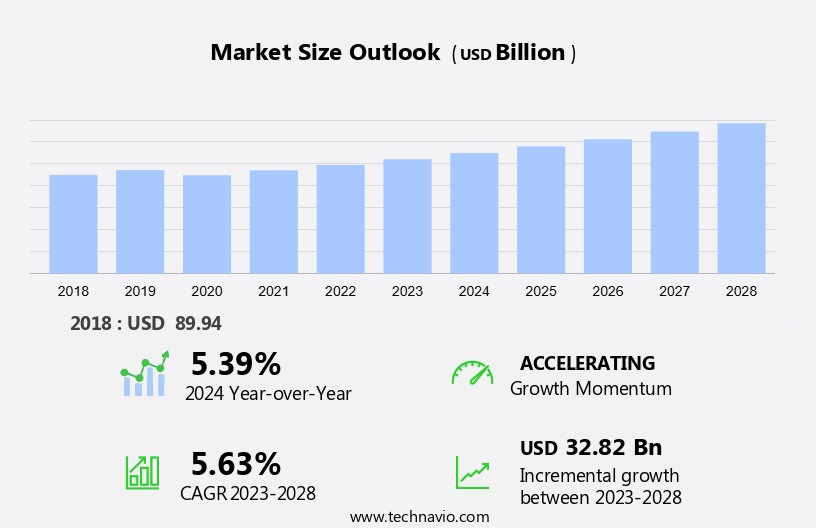
The lighting fixtures market size is forecast to increase by USD 32.82 billion at a CAGR of 5.63% between 2023 and 2028. The market hinges on several key factors driving its growth and evolution. Advances in LED technology, which are also closely linked to innovations in semiconductor materials, play a significant role, offering improved efficiency, durability, and versatility in lighting solutions across various applications. Rising urbanization and infrastructure development further fuel the demand for navigation lighting systems, especially in densely populated areas and expanding urban landscapes. Additionally, the rise of e-commerce and online shopping amplifies the need for efficient transportation and logistics, enhancing the importance of reliable navigation lighting for safe and timely delivery of goods. Furthermore, the integration of navigation lighting systems with modern technologies, such as speakers for enhanced communication and safety, is contributing to the overall market growth. These factors collectively contribute to the growth and innovation within the navigation lighting market, as industries adapt to evolving technological trends and market dynamics to meet the demands of modern navigation challenges.

Market Analysis

Lighting Fixtures Market Size

 Request Free Sample

The global market for Lighting Fixtures encompasses various electrical instruments used for Electric Lighting in diverse applications. The market comprises Fixture Bodies, Lamps, Bulbs, LED Fixtures, LED Lighting Control Switches, and Permanent Lighting Fixtures. Architects, Lighting Designers, and Electrical Engineers play pivotal roles in specifying and designing these fixtures for Consumers and the Real Estate Sector. High-class Communities and outdoor settings, such as Yards, are prime targets for advanced LED Light Modules and LED Lights, replacing Conventional Lights and Fluorescent Bulbs. The market caters to various needs, from Wall Switches and Electrical Devices to Electric Ballasts and Apertures, all contributing to the Outer Shell of the Lighting Fixture. Electrical Instruments manufacturers continually innovate to meet evolving consumer demands and energy efficiency standards. The market's growth is driven by the increasing focus on energy-efficient solutions and the expanding infrastructure in various sectors.

Market Segmentation

The market research report provides comprehensive data (region-wise segment analysis), with forecasts and estimates in "USD billion" for the period 2024-2028, as well as historical data from 2018-2022 for the following segments.

  • Product
    • Ceiling
    • Wall mounted
    • Pendant and chandeliers
    • Portable and others
  • Application
    • Residential
    • Commercial
  • Geography
    • APAC
      • China
      • India
    • Europe
      • Germany
      • UK
    • North America
      • US
    • Middle East and Africa
    • South America

By Product Insights

The ceiling segment is estimated to witness significant growth during the forecast period. The market encompasses a wide range of electrical devices, including portable lamps and fixed installations such as electric lamps with lamp sockets and electric ballasts. These fixtures come in various forms, including aperture-covered outer shells for fluorescent lamps, and high-class designs for chandeliers and pendant lights. Architects, lighting designers, and electrical engineers specify lighting solutions for diverse applications, from home renovations and remodeling of offices to manufacturing plants, warehouses, banks, retail stores, and outdoor spaces. Pendant lighting is a popular choice for workspaces and residential areas, providing focused illumination for specific tasks. High-bay luminaries and mid-bay luminaries are essential for large industrial spaces and warehouses, while landscape lighting and wireless lighting fixtures add aesthetic value to outdoor environments.

Further, floodlights offer powerful illumination for security and outdoor activities. Consumers and businesses in the real estate sector seek energy-efficient and eco-friendly lighting options, such as LED light modules and conventional lights with fluorescent bulbs or incandescent bulbs. Safety and environmental concerns have led to the phasing out of toxic materials in lighting fixtures. Smart home projects and digital systems have revolutionized lighting control, with dimmers and control devices enabling wireless lighting and analog or digital systems for customized lighting experiences.

Lighting Fixtures Market Size

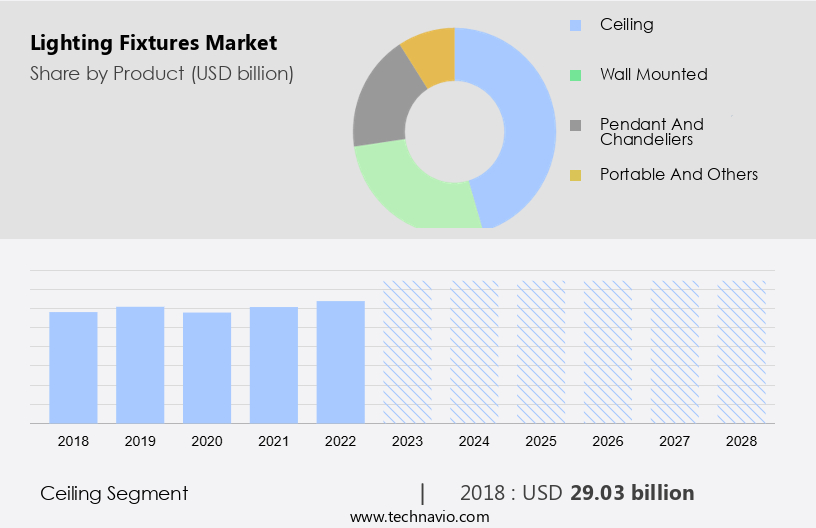
Get a glance at the market share of various segments Request Free Sample

The ceiling segment was valued at USD 29.03 billion in 2018 and showed a gradual increase during the forecast period.

Regional Insights

APAC is estimated to contribute 40% to the growth of the global market during the forecast period. Technavio's analysts have elaborately explained the regional trends and drivers that shape the market during the forecast period.

Lighting Fixtures Market Share by Geography

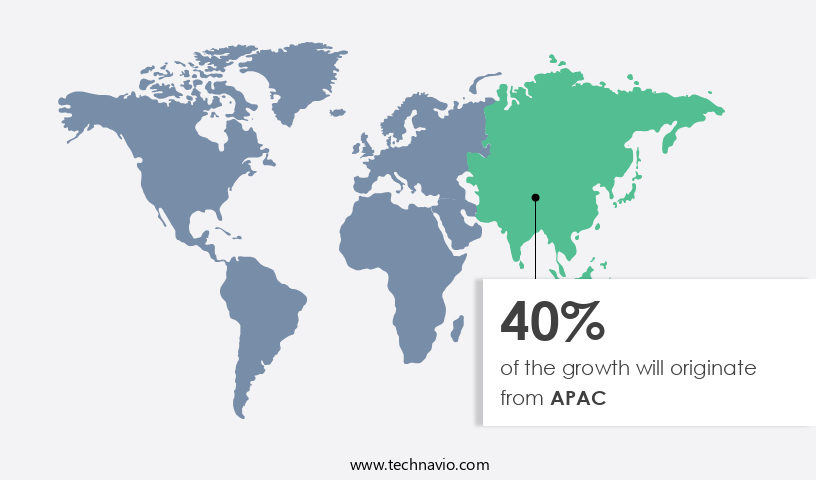
For more insights on the market share of various regions Request Free Sample

The portable electrical device category of lighting fixtures is witnessing substantial growth in the APAC region. These devices, which include electric lamps, are essential components of modern living spaces and commercial establishments. The lamp socket and electric ballast are integral parts of these fixtures, ensuring the proper functioning of the electric lamp. Architects, lighting designers, and electrical engineers are increasingly specifying the use of various types of lighting fixtures in home renovations, remodeling of offices, workspaces, manufacturing plants, warehouses, banks, retail stores, and other infrastructure projects. Pendant lighting, high-bay luminaries, mid-bay luminaries, landscape lighting, wireless lighting fixtures, floodlights, and more are in high demand.

In summary, the market in the APAC region is experiencing significant growth due to urbanization, economic growth, and increasing consumer demand for energy-efficient and eco-friendly lighting solutions. The market encompasses a wide range of portable electrical devices, including electric lamps, pendant lighting, high-bay luminaries, mid-bay luminaries, landscape lighting, wireless lighting fixtures, floodlights, and more. The use of LED light modules and other energy-efficient lighting solutions is on the rise, driven by government regulations and consumer preferences.

Market Dynamics

Our researchers analyzed the data with 2023 as the base year, along with the key drivers, trends, and challenges. A holistic analysis of drivers will help companies refine their marketing strategies to gain a competitive advantage.

Market Driver

Advances in LED technology is the key driver of the market. LED lighting fixtures, characterized by advanced sensors, smart bulbs, and integration with Wi-Fi and IoT technology, have revolutionized the lighting market. These energy-efficient alternatives to incandescent lamps with metallic filament and gas-powered bulbs, significantly reduce power consumption. The longer lifespan of LED bulbs, which is a result of new product development and fine material quality, offers numerous benefits. Businesses and households can save on maintenance costs, while consumers enjoy improved reliability and quality of light. Energy-efficient products, such as LED bulbs, have become increasingly popular in various sectors including hospitals, shopping malls, educational institutes, offices, and shops. Attractive designs and affordable prices have made LED lighting an essential element of home decor.

Additionally, government support for energy-efficient lights, as well as the availability of LED bulbs through both offline and online channels, including e-commerce platforms, have contributed to the market's growth. Additionally, the integration of LED lighting with air purifiers and air conditioning systems further enhances their appeal.

Market Trends

The emergence of smart lighting is the upcoming trend in the market. The market encompasses a range of advanced solutions, including smart bulbs and Wi-Fi-enabled switches, that cater to the growing demand for energy efficiency and convenience. IoT technology plays a pivotal role in enabling remote control and seamless integration with other smart home devices. While traditional incandescent lamps and metallic filament bulbs continue to be used, gas-powered fixtures are gradually being replaced due to their high power consumption and shorter lifespan. Smart lighting solutions offer numerous advantages, such as longer lifespan, energy efficiency, and low cost. Users can customize lighting to their preferences through adjustable brightness levels and scheduling, leading to significant energy savings.

Moreover, new product development in the market is focused on energy-efficient products, such as LED bulbs, that offer attractive designs, fine material quality, and affordable prices. The market caters to various sectors, including households, hospitals, shopping malls, educational institutes, offices, and shops. Government support for energy-efficient lights and the increasing popularity of e-commerce platforms have contributed to the market's growth. In conclusion, the market is witnessing a windfall due to the increasing adoption of energy-efficient products, smart devices, and IoT technology. The market offers a wide range of solutions for interior lighting, home decor, and various commercial applications, making it an essential component of modern living and working spaces.

Market Challenge

The presence of counterfeit lighting fixture products is a key challenge affecting the market growth. The market encompasses a range of advanced technologies, including sensors, smart bulbs, Wi-Fi, and IoT integration. From incandescent lamps with metallic filaments to gas-powered fixtures, energy consumption and longer lifespan are key considerations. Energy efficiency and low cost are essential factors, driving the demand for energy-efficient products such as LED bulbs. Compatibility with smart lighting and smart devices is a priority for interior lighting in households, hospitals, shopping malls, educational institutes, and various commercial spaces. New product development in the market focuses on attractive designs, fine material quality, and affordability. Energy-efficient lights, air purifiers, and air conditioning systems are increasingly popular, with government support and e-commerce platforms facilitating offline and online sales.

However, LED bulbs have become a windfall for manufacturers due to their home decor appeal and energy savings. Despite these advancements, the market faces challenges from counterfeit lighting fixtures. These limitations may not adhere to safety and quality standards, posing risks of electrical hazards, fires, and other safety issues. The reputation of legitimate manufacturers can be damaged when consumers associate subpar quality with reputable brands. Price competition from counterfeiters can impact the profitability of legitimate businesses, leading to price erosion and reduced revenue and profit margins. In conclusion, the market is characterized by advanced technologies, energy efficiency, and affordability. However, the presence of counterfeit products poses risks to consumer safety, market reputation, and business profitability.

Exclusive Customer Landscape

The market forecasting report includes the adoption lifecycle of the market, covering from the innovator's stage to the laggard's stage. It focuses on adoption rates in different regions based on penetration. Furthermore, the report also includes key purchase criteria and drivers of price sensitivity to help companies evaluate and develop their market growth analysis strategies.
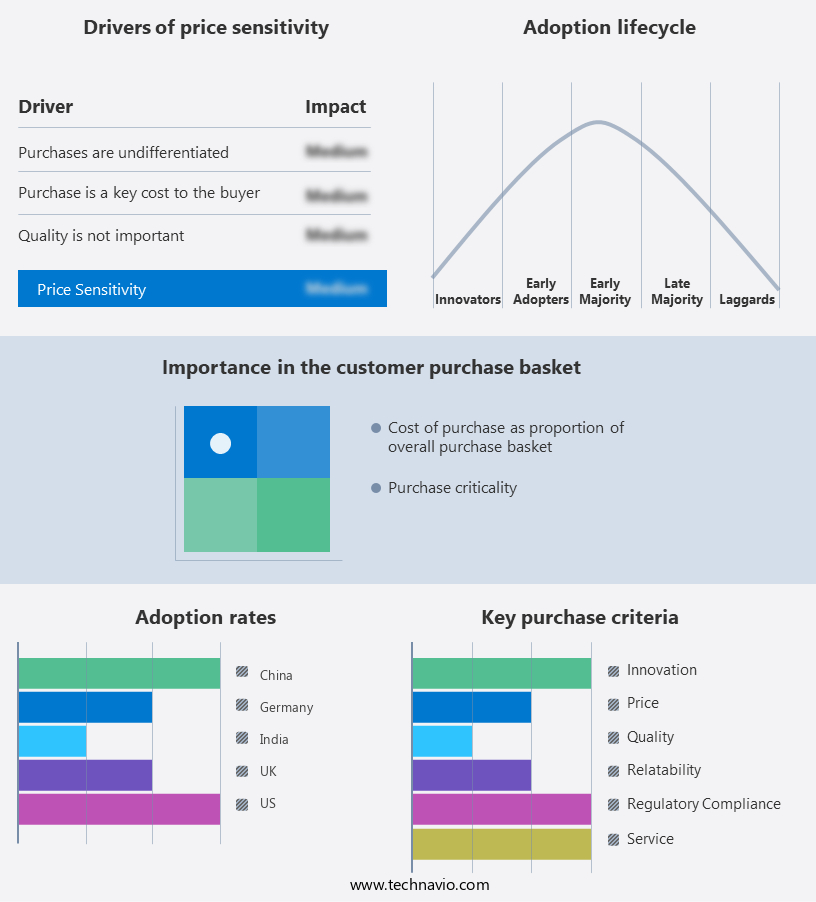
Lighting Fixtures Market Share by Geography

 Customer Landscape

Key Companies & Market Insights

Companies are implementing various strategies, such as strategic alliances, partnerships, mergers and acquisitions, geographical expansion, and product/service launches, to enhance their presence in the market.

Acuity Brands Inc: The company offers lighting fixtures such as track fixtures, linear accents, and LED lighting fixtures for homes.

The market research and growth report includes detailed analyses of the competitive landscape of the market and information about key companies, including:

  • Amerlux LLC
  • ams OSRAM AG
  • Bajaj Electricals Ltd.
  • Eaton Corp. Plc
  • ELK Home
  • Energize CT
  • Everlight Electronics Co. Ltd.
  • Fagerhults Belysning AB
  • General Electric Co.
  • Havells India Ltd.
  • Hubbell Inc.
  • IDEAL INDUSTRIES Inc.
  • Koninklijke Philips N.V.
  • Nichia Corp.
  • Panasonic Holdings Corp.
  • Seoul Semiconductor Co. Ltd.
  • Siemens AG
  • Zumtobel Group AG
  • LSI Industries Inc.

Qualitative and quantitative analysis of companies has been conducted to help clients understand the wider business environment as well as the strengths and weaknesses of key market players. Data is qualitatively analyzed to categorize companies as pure play, category-focused, industry-focused, and diversified; it is quantitatively analyzed to categorize companies as dominant, leading, strong, tentative, and weak.

Research Analyst Overview

The market encompasses a wide range of products designed for illumination in various applications. These fixtures include LED lights, bulbs, lamps, and other types of lighting solutions. The industry is driven by the increasing demand for energy-efficient and cost-effective lighting options. The use of advanced technologies such as smart lighting and wireless connectivity is also gaining popularity. The market is segmented based on product type, application, and geography. LED lighting fixtures hold a significant market share due to their energy efficiency and long lifespan.

In conclusion, the market is expected to grow at a steady pace in the coming years, with increasing urbanization and infrastructure development being key growth drivers. The adoption of lighting fixtures in residential, commercial, and industrial sectors is also contributing to the market growth. The market is competitive, with several players offering a wide range of products to cater to diverse customer needs.

Market Scope

Report Coverage

Details

Page number

164

Base year

2023

Historic period

2018-2022

Forecast period

2024-2028

Growth momentum & CAGR

Accelerate at a CAGR of 5.63%

Market Growth 2024-2028

USD 32.82 billion

Market structure

Fragmented

YoY growth 2023-2024(%)

5.39

Regional analysis

APAC, Europe, North America, Middle East and Africa, and South America

Performing market contribution

APAC at 40%

Key countries

US, China, India, Germany, and UK

Competitive landscape

Leading Companies, Market Positioning of Companies, Competitive Strategies, and Industry Risks

Key companies profiled

Acuity Brands Inc., Amerlux LLC, ams OSRAM AG, Bajaj Electricals Ltd., Eaton Corp. Plc, ELK Home, Energize CT, Everlight Electronics Co. Ltd., Fagerhults Belysning AB, General Electric Co., Havells India Ltd., Hubbell Inc., IDEAL INDUSTRIES Inc., Koninklijke Philips N.V., Nichia Corp., Panasonic Holdings Corp., Seoul Semiconductor Co. Ltd., Siemens AG, Zumtobel Group AG, and LSI Industries Inc.

Market dynamics

Parent market analysis, market growth inducers and obstacles, market forecast, fast-growing and slow-growing segment analysis, COVID-19 impact and recovery analysis and future consumer dynamics, market condition analysis for the forecast period

Customization purview

If our market report has not included the data that you are looking for, you can reach out to our analysts and get segments customized.

Request Free Sample

What are the Key Data Covered in this Market Research and Growth Report?

  • CAGR of the market during the forecast period
  • Detailed information on factors that will drive the market growth and forecasting between 2024 and 2028
  • Precise estimation of the size of the market  and its contribution of the market in focus to the parent market
  • Accurate predictions about upcoming market growth and trends and changes in consumer behaviour
  • Growth of the market across APAC, Europe, North America, Middle East and Africa, and South America
  • Thorough analysis of the market's competitive landscape and detailed information about companies
  • Comprehensive analysis of factors that will challenge the growth of market companies

We can help! Our analysts can customize this market research report to meet your requirements. Get in touch

1 Executive Summary

  • 1.1 Market overview
    • Figure 01: Executive Summary – Chart on Market Overview
    • Figure 02: Executive Summary – Data Table on Market Overview
    • Figure 03: Executive Summary – Chart on Global Market Characteristics
    • Figure 04: Executive Summary – Chart on Market by Geography
    • Figure 05: Executive Summary – Chart on Market Segmentation by Product
    • Figure 06: Executive Summary – Chart on Market Segmentation by Application
    • Figure 07: Executive Summary – Chart on Incremental Growth
    • Figure 08: Executive Summary – Data Table on Incremental Growth
    • Figure 09: Executive Summary – Chart on Vendor Market Positioning

2 Market Landscape

  • 2.1 Market ecosystem
    • Figure 10: Parent market
    • Figure 11: Market Characteristics

3 Market Sizing

  • 3.1 Market definition
    • Figure 12: Offerings of vendors included in the market definition
  • 3.2 Market segment analysis
    • Figure 13: Market segments
  • 3.3 Market size 2023
    • 3.4 Market outlook: Forecast for 2023-2028
      • Figure 14: Chart on Global - Market size and forecast 2023-2028 ($ billion)
      • Figure 15: Data Table on Global - Market size and forecast 2023-2028 ($ billion)
      • Figure 16: Chart on Global Market: Year-over-year growth 2023-2028 (%)
      • Figure 17: Data Table on Global Market: Year-over-year growth 2023-2028 (%)

    4 Historic Market Size

    • 4.1 Global lighting fixtures market 2018 - 2022
      • Figure 18: Historic Market Size – Data Table on global lighting fixtures market 2018 - 2022 ($ billion)
    • 4.2 Product Segment Analysis 2018 - 2022
      • Figure 19: Historic Market Size – Product Segment 2018 - 2022 ($ billion)
    • 4.3 Application Segment Analysis 2018 - 2022
      • Figure 20: Historic Market Size – Application Segment 2018 - 2022 ($ billion)
    • 4.4 Geography Segment Analysis 2018 - 2022
      • Figure 21: Historic Market Size – Geography Segment 2018 - 2022 ($ billion)
    • 4.5 Country Segment Analysis 2018 - 2022
      • Figure 22: Historic Market Size – Country Segment 2018 - 2022 ($ billion)

    5 Five Forces Analysis

    • 5.1 Five forces summary
      • Figure 23: Five forces analysis - Comparison between 2023 and 2028
    • 5.2 Bargaining power of buyers
      • Figure 24: Chart on Bargaining power of buyers – Impact of key factors 2023 and 2028
    • 5.3 Bargaining power of suppliers
      • Figure 25: Bargaining power of suppliers – Impact of key factors in 2023 and 2028
    • 5.4 Threat of new entrants
      • Figure 26: Threat of new entrants – Impact of key factors in 2023 and 2028
    • 5.5 Threat of substitutes
      • Figure 27: Threat of substitutes – Impact of key factors in 2023 and 2028
    • 5.6 Threat of rivalry
      • Figure 28: Threat of rivalry – Impact of key factors in 2023 and 2028
    • 5.7 Market condition
      • Figure 29: Chart on Market condition - Five forces 2023 and 2028

    6 Market Segmentation by Product

    • 6.1 Market segments
      • Figure 30: Chart on Product - Market share 2023-2028 (%)
      • Figure 31: Data Table on Product - Market share 2023-2028 (%)
    • 6.2 Comparison by Product
      • Figure 32: Chart on Comparison by Product
      • Figure 33: Data Table on Comparison by Product
    • 6.3 Ceiling - Market size and forecast 2023-2028
      • Figure 34: Chart on Ceiling - Market size and forecast 2023-2028 ($ billion)
      • Figure 35: Data Table on Ceiling - Market size and forecast 2023-2028 ($ billion)
      • Figure 36: Chart on Ceiling - Year-over-year growth 2023-2028 (%)
      • Figure 37: Data Table on Ceiling - Year-over-year growth 2023-2028 (%)
    • 6.4 Wall mounted - Market size and forecast 2023-2028
      • Figure 38: Chart on Wall mounted - Market size and forecast 2023-2028 ($ billion)
      • Figure 39: Data Table on Wall mounted - Market size and forecast 2023-2028 ($ billion)
      • Figure 40: Chart on Wall mounted - Year-over-year growth 2023-2028 (%)
      • Figure 41: Data Table on Wall mounted - Year-over-year growth 2023-2028 (%)
    • 6.5 Pendant and chandeliers - Market size and forecast 2023-2028
      • Figure 42: Chart on Pendant and chandeliers - Market size and forecast 2023-2028 ($ billion)
      • Figure 43: Data Table on Pendant and chandeliers - Market size and forecast 2023-2028 ($ billion)
      • Figure 44: Chart on Pendant and chandeliers - Year-over-year growth 2023-2028 (%)
      • Figure 45: Data Table on Pendant and chandeliers - Year-over-year growth 2023-2028 (%)
    • 6.6 Portable and others - Market size and forecast 2023-2028
      • Figure 46: Chart on Portable and others - Market size and forecast 2023-2028 ($ billion)
      • Figure 47: Data Table on Portable and others - Market size and forecast 2023-2028 ($ billion)
      • Figure 48: Chart on Portable and others - Year-over-year growth 2023-2028 (%)
      • Figure 49: Data Table on Portable and others - Year-over-year growth 2023-2028 (%)
    • 6.7 Market opportunity by Product
      • Figure 50: Market opportunity by Product ($ billion)
      • Figure 51: Data Table on Market opportunity by Product ($ billion)

    7 Market Segmentation by Application

    • 7.1 Market segments
      • Figure 52: Chart on Application - Market share 2023-2028 (%)
      • Figure 53: Data Table on Application - Market share 2023-2028 (%)
    • 7.2 Comparison by Application
      • Figure 54: Chart on Comparison by Application
      • Figure 55: Data Table on Comparison by Application
    • 7.3 Residential - Market size and forecast 2023-2028
      • Figure 56: Chart on Residential - Market size and forecast 2023-2028 ($ billion)
      • Figure 57: Data Table on Residential - Market size and forecast 2023-2028 ($ billion)
      • Figure 58: Chart on Residential - Year-over-year growth 2023-2028 (%)
      • Figure 59: Data Table on Residential - Year-over-year growth 2023-2028 (%)
    • 7.4 Commercial - Market size and forecast 2023-2028
      • Figure 60: Chart on Commercial - Market size and forecast 2023-2028 ($ billion)
      • Figure 61: Data Table on Commercial - Market size and forecast 2023-2028 ($ billion)
      • Figure 62: Chart on Commercial - Year-over-year growth 2023-2028 (%)
      • Figure 63: Data Table on Commercial - Year-over-year growth 2023-2028 (%)
    • 7.5 Market opportunity by Application
      • Figure 64: Market opportunity by Application ($ billion)
      • Figure 65: Data Table on Market opportunity by Application ($ billion)

    8 Customer Landscape

    • 8.1 Customer landscape overview
      • Figure 66: Analysis of price sensitivity, lifecycle, customer purchase basket, adoption rates, and purchase criteria

    9 Geographic Landscape

    • 9.1 Geographic segmentation
      • Figure 67: Chart on Market share by geography 2023-2028 (%)
      • Figure 68: Data Table on Market share by geography 2023-2028 (%)
    • 9.2 Geographic comparison
      • Figure 69: Chart on Geographic comparison
      • Figure 70: Data Table on Geographic comparison
    • 9.3 APAC - Market size and forecast 2023-2028
      • Figure 71: Chart on APAC - Market size and forecast 2023-2028 ($ billion)
      • Figure 72: Data Table on APAC - Market size and forecast 2023-2028 ($ billion)
      • Figure 73: Chart on APAC - Year-over-year growth 2023-2028 (%)
      • Figure 74: Data Table on APAC - Year-over-year growth 2023-2028 (%)
    • 9.4 Europe - Market size and forecast 2023-2028
      • Figure 75: Chart on Europe - Market size and forecast 2023-2028 ($ billion)
      • Figure 76: Data Table on Europe - Market size and forecast 2023-2028 ($ billion)
      • Figure 77: Chart on Europe - Year-over-year growth 2023-2028 (%)
      • Figure 78: Data Table on Europe - Year-over-year growth 2023-2028 (%)
    • 9.5 North America - Market size and forecast 2023-2028
      • Figure 79: Chart on North America - Market size and forecast 2023-2028 ($ billion)
      • Figure 80: Data Table on North America - Market size and forecast 2023-2028 ($ billion)
      • Figure 81: Chart on North America - Year-over-year growth 2023-2028 (%)
      • Figure 82: Data Table on North America - Year-over-year growth 2023-2028 (%)
    • 9.6 Middle East and Africa - Market size and forecast 2023-2028
      • Figure 83: Chart on Middle East and Africa - Market size and forecast 2023-2028 ($ billion)
      • Figure 84: Data Table on Middle East and Africa - Market size and forecast 2023-2028 ($ billion)
      • Figure 85: Chart on Middle East and Africa - Year-over-year growth 2023-2028 (%)
      • Figure 86: Data Table on Middle East and Africa - Year-over-year growth 2023-2028 (%)
    • 9.7 South America - Market size and forecast 2023-2028
      • Figure 87: Chart on South America - Market size and forecast 2023-2028 ($ billion)
      • Figure 88: Data Table on South America - Market size and forecast 2023-2028 ($ billion)
      • Figure 89: Chart on South America - Year-over-year growth 2023-2028 (%)
      • Figure 90: Data Table on South America - Year-over-year growth 2023-2028 (%)
    • 9.8 China - Market size and forecast 2023-2028
      • Figure 91: Chart on China - Market size and forecast 2023-2028 ($ billion)
      • Figure 92: Data Table on China - Market size and forecast 2023-2028 ($ billion)
      • Figure 93: Chart on China - Year-over-year growth 2023-2028 (%)
      • Figure 94: Data Table on China - Year-over-year growth 2023-2028 (%)
    • 9.9 US - Market size and forecast 2023-2028
      • Figure 95: Chart on US - Market size and forecast 2023-2028 ($ billion)
      • Figure 96: Data Table on US - Market size and forecast 2023-2028 ($ billion)
      • Figure 97: Chart on US - Year-over-year growth 2023-2028 (%)
      • Figure 98: Data Table on US - Year-over-year growth 2023-2028 (%)
    • 9.10 Germany - Market size and forecast 2023-2028
      • Figure 99: Chart on Germany - Market size and forecast 2023-2028 ($ billion)
      • Figure 100: Data Table on Germany - Market size and forecast 2023-2028 ($ billion)
      • Figure 101: Chart on Germany - Year-over-year growth 2023-2028 (%)
      • Figure 102: Data Table on Germany - Year-over-year growth 2023-2028 (%)
    • 9.11 UK - Market size and forecast 2023-2028
      • Figure 103: Chart on UK - Market size and forecast 2023-2028 ($ billion)
      • Figure 104: Data Table on UK - Market size and forecast 2023-2028 ($ billion)
      • Figure 105: Chart on UK - Year-over-year growth 2023-2028 (%)
      • Figure 106: Data Table on UK - Year-over-year growth 2023-2028 (%)
    • 9.12 India - Market size and forecast 2023-2028
      • Figure 107: Chart on India - Market size and forecast 2023-2028 ($ billion)
      • Figure 108: Data Table on India - Market size and forecast 2023-2028 ($ billion)
      • Figure 109: Chart on India - Year-over-year growth 2023-2028 (%)
      • Figure 110: Data Table on India - Year-over-year growth 2023-2028 (%)
    • 9.13 Market opportunity by geography
      • Figure 111: Market opportunity by geography ($ billion)
      • Figure 112: Data Tables on Market opportunity by geography ($ billion)

    10 Drivers, Challenges, and Trends

    • 10.1 Market drivers
      • 10.2 Market challenges
        • 10.3 Impact of drivers and challenges
          • Figure 113: Impact of drivers and challenges in 2023 and 2028
        • 10.4 Market trends

          11 Vendor Landscape

          • 11.1 Overview
            • 11.2 Vendor landscape
              • Figure 114: Overview on Criticality of inputs and Factors of differentiation
            • 11.3 Landscape disruption
              • Figure 115: Overview on factors of disruption
            • 11.4 Industry risks
              • Figure 116: Impact of key risks on business

            12 Vendor Analysis

            • 12.1 Vendors covered
              • Figure 117: Vendors covered
            • 12.2 Market positioning of vendors
              • Figure 118: Matrix on vendor position and classification
            • 12.3 Acuity Brands Inc.
              • Figure 119: Acuity Brands Inc. - Overview
              • Figure 120: Acuity Brands Inc. - Business segments
              • Figure 121: Acuity Brands Inc. - Key news
              • Figure 122: Acuity Brands Inc. - Key offerings
              • Figure 123: Acuity Brands Inc. - Segment focus
            • 12.4 ams OSRAM AG
              • Figure 124: ams OSRAM AG - Overview
              • Figure 125: ams OSRAM AG - Business segments
              • Figure 126: ams OSRAM AG - Key offerings
              • Figure 127: ams OSRAM AG - Segment focus
            • 12.5 Eaton Corp. Plc
              • Figure 128: Eaton Corp. Plc - Overview
              • Figure 129: Eaton Corp. Plc - Business segments
              • Figure 130: Eaton Corp. Plc - Key news
              • Figure 131: Eaton Corp. Plc - Key offerings
              • Figure 132: Eaton Corp. Plc - Segment focus
            • 12.6 Energize CT
              • Figure 133: Energize CT - Overview
              • Figure 134: Energize CT - Product / Service
              • Figure 135: Energize CT - Key offerings
            • 12.7 Everlight Electronics Co. Ltd.
              • Figure 136: Everlight Electronics Co. Ltd. - Overview
              • Figure 137: Everlight Electronics Co. Ltd. - Business segments
              • Figure 138: Everlight Electronics Co. Ltd. - Key offerings
              • Figure 139: Everlight Electronics Co. Ltd. - Segment focus
            • 12.8 General Electric Co.
              • Figure 140: General Electric Co. - Overview
              • Figure 141: General Electric Co. - Business segments
              • Figure 142: General Electric Co. - Key news
              • Figure 143: General Electric Co. - Key offerings
              • Figure 144: General Electric Co. - Segment focus
            • 12.9 Havells India Ltd.
              • Figure 145: Havells India Ltd. - Overview
              • Figure 146: Havells India Ltd. - Business segments
              • Figure 147: Havells India Ltd. - Key news
              • Figure 148: Havells India Ltd. - Key offerings
              • Figure 149: Havells India Ltd. - Segment focus
            • 12.10 Hubbell Inc.
              • Figure 150: Hubbell Inc. - Overview
              • Figure 151: Hubbell Inc. - Business segments
              • Figure 152: Hubbell Inc. - Key offerings
              • Figure 153: Hubbell Inc. - Segment focus
            • 12.11 IDEAL INDUSTRIES Inc.
              • Figure 154: IDEAL INDUSTRIES Inc. - Overview
              • Figure 155: IDEAL INDUSTRIES Inc. - Product / Service
              • Figure 156: IDEAL INDUSTRIES Inc. - Key offerings
            • 12.12 Koninklijke Philips N.V.
              • Figure 157: Koninklijke Philips N.V. - Overview
              • Figure 158: Koninklijke Philips N.V. - Business segments
              • Figure 159: Koninklijke Philips N.V. - Key news
              • Figure 160: Koninklijke Philips N.V. - Key offerings
              • Figure 161: Koninklijke Philips N.V. - Segment focus
            • 12.13 LSI Industries Inc.
              • Figure 162: LSI Industries Inc. - Overview
              • Figure 163: LSI Industries Inc. - Business segments
              • Figure 164: LSI Industries Inc. - Key offerings
              • Figure 165: LSI Industries Inc. - Segment focus
            • 12.14 Nichia Corp.
              • Figure 166: Nichia Corp. - Overview
              • Figure 167: Nichia Corp. - Product / Service
              • Figure 168: Nichia Corp. - Key offerings
            • 12.15 Panasonic Holdings Corp.
              • Figure 169: Panasonic Holdings Corp. - Overview
              • Figure 170: Panasonic Holdings Corp. - Product / Service
              • Figure 171: Panasonic Holdings Corp. - Key news
              • Figure 172: Panasonic Holdings Corp. - Key offerings
            • 12.16 Siemens AG
              • Figure 173: Siemens AG - Overview
              • Figure 174: Siemens AG - Business segments
              • Figure 175: Siemens AG - Key news
              • Figure 176: Siemens AG - Key offerings
              • Figure 177: Siemens AG - Segment focus
            • 12.17 Zumtobel Group AG
              • Figure 178: Zumtobel Group AG - Overview
              • Figure 179: Zumtobel Group AG - Business segments
              • Figure 180: Zumtobel Group AG - Key offerings
              • Figure 181: Zumtobel Group AG - Segment focus

            13 Appendix

            • 13.1 Scope of the report
              • 13.2 Inclusions and exclusions checklist
                • Figure 182: Inclusions checklist
                • Figure 183: Exclusions checklist
              • 13.3 Currency conversion rates for US$
                • Figure 184: Currency conversion rates for US$
              • 13.4 Research methodology
                • Figure 185: Research methodology
                • Figure 186: Validation techniques employed for market sizing
                • Figure 187: Information sources
              • 13.5 List of abbreviations
                • Figure 188: List of abbreviations

              Research Methodology

              Technavio presents a detailed picture of the market by way of study, synthesis, and summation of data from multiple sources. The analysts have presented the various facets of the market with a particular focus on identifying the key industry influencers. The data thus presented is comprehensive, reliable, and the result of extensive research, both primary and secondary.

              INFORMATION SOURCES

              Primary sources

              • Manufacturers and suppliers
              • Channel partners
              • Industry experts
              • Strategic decision makers

              Secondary sources

              • Industry journals and periodicals
              • Government data
              • Financial reports of key industry players
              • Historical data
              • Press releases

              DATA ANALYSIS

              Data Synthesis

              • Collation of data
              • Estimation of key figures
              • Analysis of derived insights

              Data Validation

              • Triangulation with data models
              • Reference against proprietary databases
              • Corroboration with industry experts

              REPORT WRITING

              Qualitative

              • Market drivers
              • Market challenges
              • Market trends
              • Five forces analysis

              Quantitative

              • Market size and forecast
              • Market segmentation
              • Geographical insights
              • Competitive landscape

              Interested in this report?

              Get your sample now to see our research methodology and insights!

              Download Now

              Frequently Asked Questions

              Lighting Fixtures market growth will increase by $ 32.82 bn during 2024-2028 .

              The Lighting Fixtures market is expected to grow at a CAGR of 5.63% during 2024-2028 .

              Lighting Fixtures market is segmented by Product( Ceiling, Wall mounted, Pendant and chandeliers, Portable and others) Application( Residential, Commercial)

              Acuity Brands Inc., Amerlux LLC, ams OSRAM AG, Bajaj Electricals Ltd., Eaton Corp. Plc, ELK Home, Energize CT, Everlight Electronics Co. Ltd., Fagerhults Belysning AB, General Electric Co., Havells India Ltd., Hubbell Inc., IDEAL INDUSTRIES Inc., Koninklijke Philips N.V., Nichia Corp., Panasonic Holdings Corp., Seoul Semiconductor Co. Ltd., Siemens AG, Zumtobel Group AG, LSI Industries Inc. are a few of the key vendors in the Lighting Fixtures market.

              APAC will register the highest growth rate of 40% among the other regions. Therefore, the Lighting Fixtures market in APAC is expected to garner significant business opportunities for the vendors during the forecast period.

              US, China, India, Germany, UK

              • Advances in LED technologyLED lighting fixtures are highly energy-efficient is the driving factor this market.
              • consuming significantly less electricity compared to traditional incandescent and fluorescent lighting. Advances in LED technology have led to even greater energy efficiency is the driving factor this market.
              • making LEDs the preferred choice for both residential and commercial lighting. This has contributed to energy savings for consumers and businesses is the driving factor this market.
              • as well as reduced greenhouse gas emissions. LED lighting fixtures have a longer lifespan compared to traditional lighting technologies. Newer LED components are designed to last even longer is the driving factor this market.
              • reducing the need for frequent replacements and maintenance. This has led to reduced maintenance costs for businesses and improved reliability for consumers. Advances in LED technology have resulted in improved color rendering capabilities. LEDs can now provide a more natural and accurate representation of colors is the driving factor this market.
              • which is crucial for applications such as retail and hospitality lighting. In addition to that is the driving factor this market.
              • LED technology easily integrates with smart lighting systems and controls. As LEDs become more compatible with IoT devices and home automation is the driving factor this market.
              • consumers can control their lighting fixtures remotely is the driving factor this market.
              • create personalized lighting scenes is the driving factor this market.
              • and optimize energy usage. LED lighting is environmentally friendly due to its energy efficiency is the driving factor this market.
              • longer lifespan is the driving factor this market.
              • and the absence of hazardous materials like mercury. This aligns with global efforts to reduce the environmental impact of lighting. Thus is the driving factor this market.
              • advances in LED technology have transformed lighting fixtures by offering energy-efficient is the driving factor this market.
              • long-lasting is the driving factor this market.
              • and versatile lighting solutions is the driving factor this market.
              • which will boost the global lighting fixtures market during the forecast period. is the driving factor this market.

              The Lighting Fixtures market vendors should focus on grabbing business opportunities from the Ceiling segment as it accounted for the largest market share in the base year.