
Industrial Powder Coatings Market Size 2026-2030
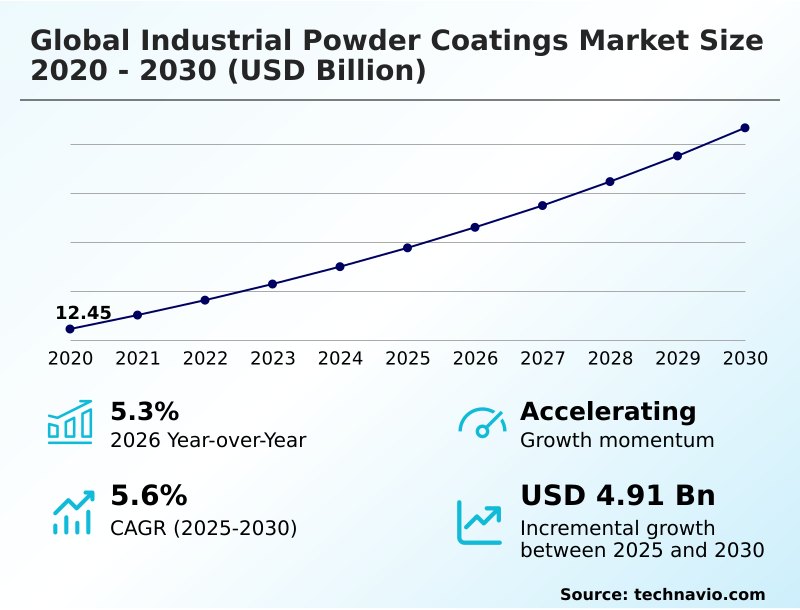
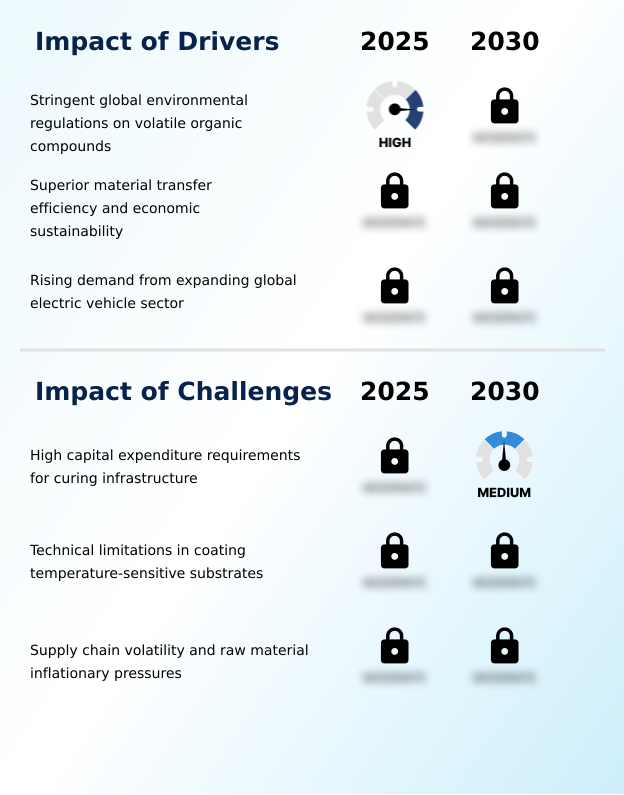
The industrial powder coatings market size is valued to increase by USD 4.91 billion, at a CAGR of 5.6% from 2025 to 2030. Stringent global environmental regulations on volatile organic compounds will drive the industrial powder coatings market.
Major Market Trends & Insights
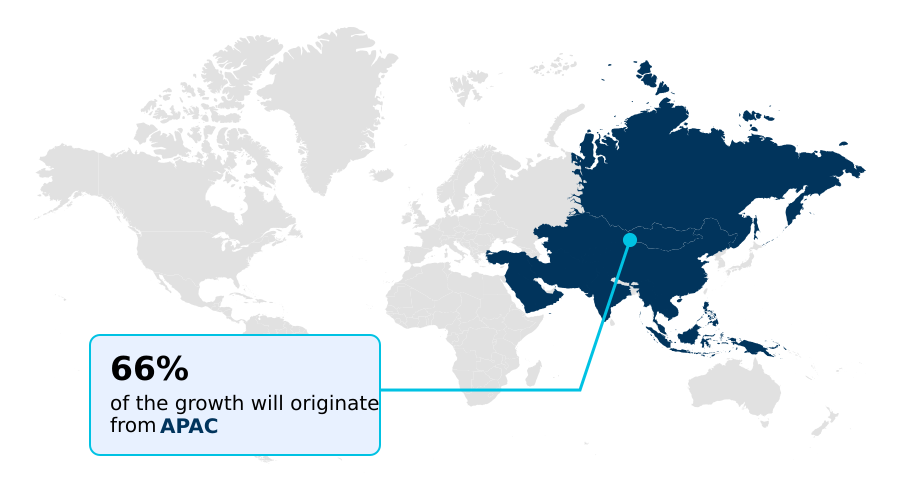
- APAC dominated the market and accounted for a 65.8% growth during the forecast period.
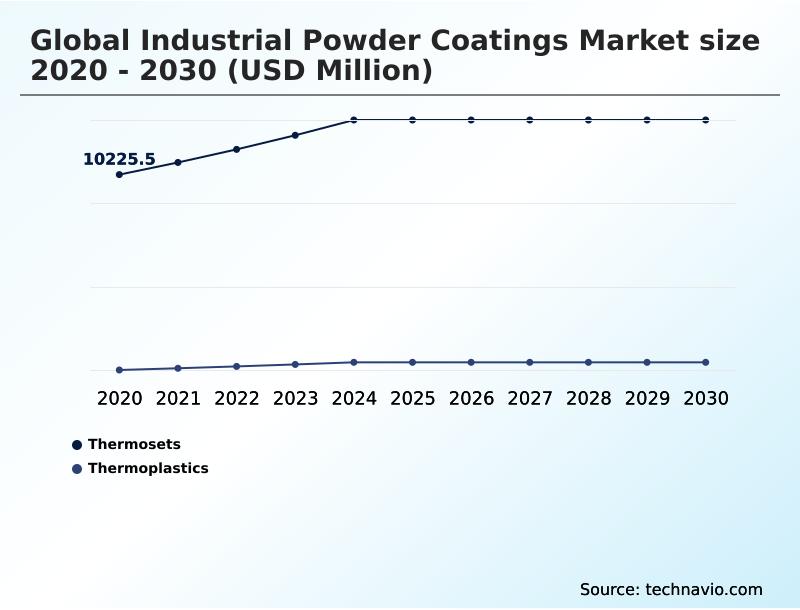
- By Type - Thermosets segment was valued at USD 12.46 billion in 2024
- By End-user - Automotive segment accounted for the largest market revenue share in 2024
Market Size & Forecast
- Market Opportunities: USD 8.23 billion
- Market Future Opportunities: USD 4.91 billion
- CAGR from 2025 to 2030 : 5.6%
Market Summary
- The Industrial Powder Coatings Market undergoes continuous expansion as heavy manufacturing sectors prioritize solvent-free, highly durable surface protection. Driven by rigorous environmental mandates targeting volatile emissions, industrial operators are aggressively replacing traditional liquid paints with dry powder alternatives, effectively lowering hazardous waste disposal costs by up to 35%.
- In a real-world supply chain scenario, automated automotive assembly plants implement specialized electrostatic booths to coat complex chassis components, recovering and reusing oversprayed material to achieve near-perfect utilization rates. This shift toward sustainable manufacturing directly fuels market adoption.
- However, upgrading legacy finishing lines requires substantial capital investments in high-temperature curing ovens, creating a significant financial challenge for small-scale fabricators trying to balance modernization with immediate overhead constraints. Because specialized resins provide exceptional resistance to corrosion, moisture, and chemical degradation, downstream industries continually adapt their production frameworks to accommodate these advanced formulations.
- Consequently, the reliance on high-performance finishes fundamentally reshapes procurement strategies across the automotive, architectural, and appliance manufacturing landscapes.
What will be the Size of the Industrial Powder Coatings Market during the forecast period?
Get Key Insights on Market Forecast (PDF) Get Free Sample
How is the Industrial Powder Coatings Market Segmented?
The industrial powder coatings industry research report provides comprehensive data (region-wise segment analysis), with forecasts and estimates in "USD million" for the period 2026-2030, as well as historical data from 2020-2024 for the following segments.
- Type
- Thermosets
- Thermoplastics
- End-user
- Automotive
- Appliances
- Construction
- Electronics
- Others
- Method
- ESD
- FBC
- Others
- Geography
- APAC
- China
- Japan
- India
- South Korea
- Australia
- Indonesia
- North America
- US
- Canada
- Mexico
- Europe
- Germany
- UK
- France
- Italy
- Spain
- The Netherlands
- South America
- Brazil
- Argentina
- Chile
- Middle East and Africa
- Saudi Arabia
- Turkey
- UAE
- South Africa
- Israel
- APAC
By Type Insights
The thermosets segment is estimated to witness significant growth during the forecast period.
The thermosets segment dominates industrial coating applications because irreversible chemical bonding ensures exceptional structural stability under extreme operational stress.
Formulators utilize thermosetting resin formulations and epoxy polyester hybrids to create permanent molecular bonds, directly yielding heavy machinery protection and advanced metal surface finishing. This cross-linking density prevents melting during elevated temperature exposure, driving adoption across diverse manufacturing lines.
Consequently, appliance scratch resistance improves by over 40% compared to traditional liquid paints, securing longer asset lifespans. Meanwhile, custom color matching capabilities enable precise aesthetic alignment for commercial goods.
The inclusion of thermoplastic powder layers alongside thermosets provides complementary impact absorption layers for plumbing and public infrastructure.
Because manufacturers require robust durability without sacrificing operational speed, they increasingly specify these resilient coatings, ultimately optimizing production workflows and reducing long-term maintenance liabilities across heavy industrial applications.
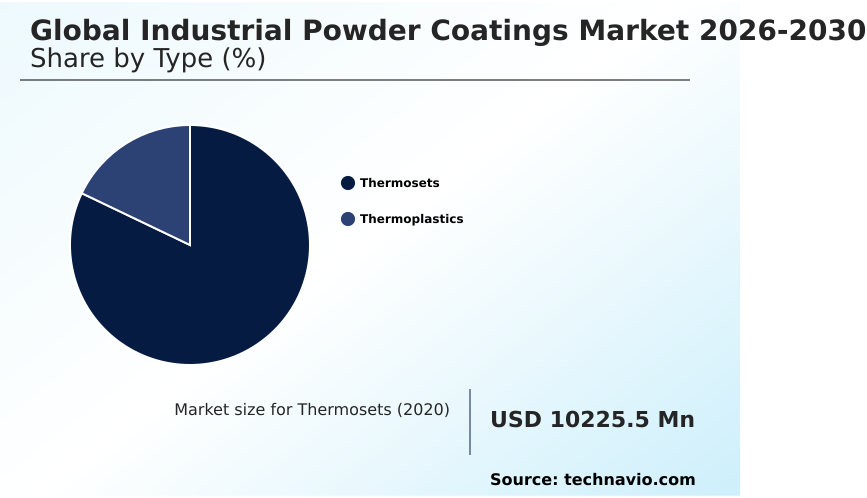
The Thermosets segment was valued at USD 12.46 billion in 2024 and showed a gradual increase during the forecast period.
Regional Analysis
APAC is estimated to contribute 65.8% to the growth of the global market during the forecast period.Technavio’s analysts have elaborately explained the regional trends and drivers that shape the market during the forecast period.
See How Industrial Powder Coatings Market Demand is Rising in APAC Get Free Sample
The geographic distribution of the Industrial Powder Coatings market reveals stark contrasts in adoption drivers between APAC and North America.
APAC dominates industrial consumption because massive infrastructure investments and electronics manufacturing heavily rely on continuous salt spray resistance and high-volume production throughput. This rapid industrialization pushes APAC facility upgrade rates 18% higher than those in Western markets.
Conversely, North America prioritizes strict environmental compliance, leading to a 22% faster transition toward fusion-bonded epoxy for pipeline moisture penetration defense.
While APAC operators scale up fluidized bed coating for affordable structural coverage, North American fabricators increasingly specify super-durable polyesters and fluoropolymer finishes to protect architectural aluminum extrusions and construction structural steel.
Because electromagnetic interference shielding is critical for advanced telecommunications, both regions are adapting their supply chains to secure highly functional powders, optimizing specialized manufacturing outputs globally.
Market Dynamics
Our researchers analyzed the data with 2025 as the base year, along with the key drivers, trends, and challenges. A holistic analysis of drivers will help companies refine their marketing strategies to gain a competitive advantage.
- The operational landscape of the Industrial Powder Coatings market is fundamentally shifting as manufacturers prioritize both extreme durability and strict environmental compliance. To eliminate atmospheric pollutants from high-volume assembly lines, original equipment manufacturers are aggressively transitioning toward zero emission electrostatic spray deposition processes, capturing overspray to achieve utilization rates nearly double those of conventional liquid paint systems.
- Because specialized components like engineered plastics and carbon fiber cannot withstand traditional thermal baking, the commercialization of low temperature curing powder formulations has become a critical operational requirement, drastically expanding the scope of applicable substrates.
- Simultaneously, the rapid electrification of the automotive sector forces supply chains to secure highly specialized finishes; incorporating electric vehicle battery dielectric insulation is now a non-negotiable safety standard for protecting high-voltage energy storage systems against thermal runaway and moisture ingress.
- In the architectural sector, premium commercial developments increasingly mandate ultraviolet curable architectural aluminum coatings to guarantee multidecade weatherability and gloss retention without the massive energy footprint of standard convection ovens. Furthermore, heavy industrial sectors rely heavily on fusion bonded epoxy pipeline protection to shield critical subterranean and subsea infrastructure from aggressive chemical corrosion.
- By adopting these targeted innovations, industrial fabricators successfully align their production capabilities with modern sustainability targets, ultimately reducing long-term material waste and enhancing the lifecycle of coated assets.
What are the key market drivers leading to the rise in the adoption of Industrial Powder Coatings Industry?
- The stringent enforcement of environmental regulations targeting volatile organic compounds serves as a primary catalyst, accelerating the industrial transition toward zero-emission powder technologies.
- The urgent industrial mandate for volatile organic compound elimination acts as a massive demand trigger for advanced dry coating solutions.
- Because manufacturers face severe regulatory penalties for hazardous emissions, the shift toward solvent-free formulations drives a 35% improvement in hazardous waste reduction.
- The automotive sector aggressively fuels this momentum; the critical need for electric vehicle battery insulation requires specialized thermal management coatings and robust dielectric insulation to ensure passenger safety.
- Consequently, applying these protective layers on automotive chassis coating lines increases component lifespan by 40%. Simultaneously, agricultural equipment finishes and consumer electronics enclosures demand sophisticated edge corrosion defense and antimicrobial surface treatments to withstand harsh daily environments.
- Ultimately, the necessity for hyper-durable, compliant finishes directly accelerates widespread industrial adoption.
What are the market trends shaping the Industrial Powder Coatings Industry?
- The commercialization of ultra-low-bake and ultraviolet-curable chemistries represents a defining technological shift within the market. This advancement enables the high-speed coating of temperature-sensitive substrates while substantially reducing energy consumption during the curing process.
- The integration of ultraviolet curable powder and low-temperature curing chemistries fundamentally redefines modern surface finishing capabilities. Because legacy systems damage delicate materials, the deployment of laser curing technology allows manufacturers to safely coat heat-sensitive composites, reducing thermal processing times by up to 50%. This technological pivot directly supports zero-emission applications and circular economy principles by eliminating reliance on volatile solvents.
- Furthermore, smart factory integration utilizes smart automated booths to monitor spray metrics in real time, increasing robotic application efficiency by over 20% compared to manual operations. By adopting bio-attributed raw materials, formulators successfully mitigate the challenges of substrate thermal sensitivity while lowering overall carbon footprints.
- Consequently, these synchronized innovations empower industrial operators to drastically accelerate production workflows and enhance product durability without escalating operational energy demands.
What challenges does the Industrial Powder Coatings Industry face during its growth?
- High capital expenditure requirements for specialized curing infrastructure and electrostatic application booths present a significant barrier to adoption for cost-sensitive manufacturing enterprises.
- Despite clear operational advantages, massive capital requirements for electrostatic spray deposition infrastructure severely restrict rapid modernization among smaller fabricators. Because retrofitting legacy lines requires advanced powder recovery and smart overspray reclamation units, initial equipment expenditures are often 45% higher than traditional liquid spray setups. Furthermore, raw material pricing volatility disrupts supply chain consolidation efforts, squeezing profit margins for regional formulators.
- While sophisticated powder recycling mechanisms enable transfer efficiency optimization, maintaining strict weatherability standards requires consistent, premium chemical inputs. Because thermal curing ovens consume massive amounts of electricity, achieving meaningful energy expenditure reduction remains a persistent engineering bottleneck. Consequently, these structural and economic constraints force cost-sensitive manufacturers to delay facility upgrades, temporarily stalling the universal deployment of high-performance powder finishing systems.
Exclusive Technavio Analysis on Customer Landscape
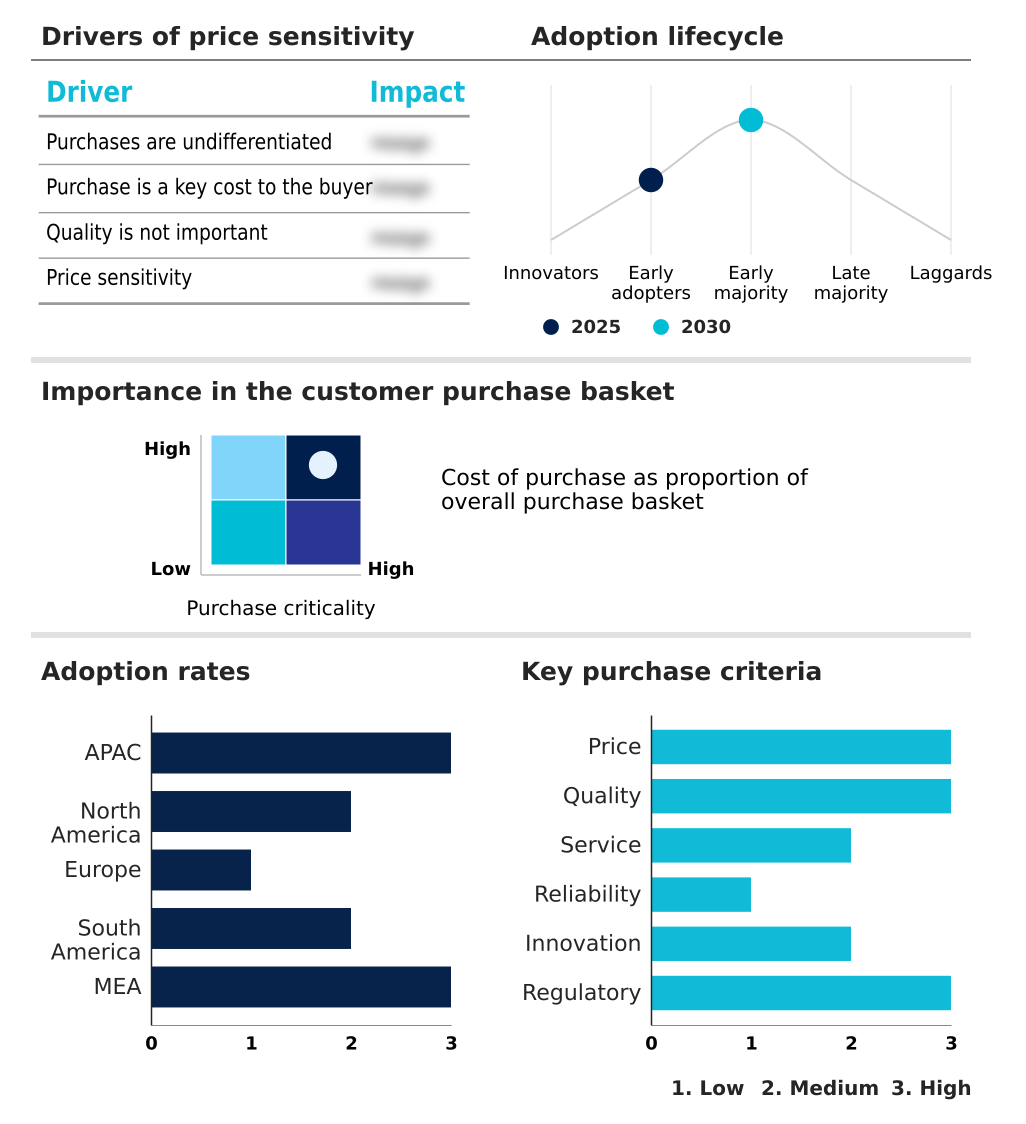
The industrial powder coatings market forecasting report includes the adoption lifecycle of the market, covering from the innovator’s stage to the laggard’s stage. It focuses on adoption rates in different regions based on penetration. Furthermore, the industrial powder coatings market report also includes key purchase criteria and drivers of price sensitivity to help companies evaluate and develop their market growth analysis strategies.
Customer Landscape of Industrial Powder Coatings Industry
Competitive Landscape
Companies are implementing various strategies, such as strategic alliances, industrial powder coatings market forecast, partnerships, mergers and acquisitions, geographical expansion, and product/service launches, to enhance their presence in the industry.
Akzo Nobel NV - Industrial powder coatings deliver advanced epoxy polyester systems, robust protective finishes, and highly durable surface solutions optimized for demanding architectural, automotive, and heavy manufacturing applications.
The industry research and growth report includes detailed analyses of the competitive landscape of the market and information about key companies, including:
- Akzo Nobel NV
- Asian Paints Ltd.
- Axalta Coating Systems Ltd.
- Berger Paints India Ltd.
- Cardinal Paint and Powder Inc.
- Cloverdale Paint Inc.
- Diamond Vogel
- Erie Powder Coatings
- Hentzen Coatings Inc.
- IFS Coatings
- IGP Pulvertechnik AG
- Jotun AS
- Keyland Polymer
- Nippon Paint Holdings Co Ltd.
- PPG Industries Inc.
- Prismatic Powders
- RPM International Inc.
- ST Powder Coatings S.p.A.
- Teknos Group Oy
- The Sherwin Williams Co.
Qualitative and quantitative analysis of companies has been conducted to help clients understand the wider business environment as well as the strengths and weaknesses of key industry players. Data is qualitatively analyzed to categorize companies as pure play, category-focused, industry-focused, and diversified; it is quantitatively analyzed to categorize companies as dominant, leading, strong, tentative, and weak.
Recent Development and News in Industrial powder coatings market
- In the Specialty Chemicals industry, the widespread adoption of circular economy principles and bio-based resin synthesis has reduced carbon outputs, directly impacting Industrial Powder Coatings demand by accelerating the commercialization of sustainable low-emission formulations with a 20% smaller environmental footprint.
- Strict regulatory enforcement targeting hazardous waste reduction and volatile organic compound elimination has phased out traditional solvent-borne paints, forcing automotive and architectural manufacturers to rapidly transition toward powder-based zero-emission applications to ensure compliance.
- The rapid expansion of electric vehicle manufacturing has necessitated advanced thermal management solutions, prompting specialty chemical suppliers to engineer specialized dielectric insulation compounds that increase battery enclosure safety margins by up to 30%.
- Escalating raw material pricing volatility and supply chain consolidation among major petrochemical suppliers have disrupted resin availability, compelling coating formulators to invest heavily in advanced powder recovery systems that maximize transfer efficiency and minimize overall material waste.
Dive into Technavio’s robust research methodology, blending expert interviews, extensive data synthesis, and validated models for unparalleled Industrial Powder Coatings Market insights. See full methodology.
| Market Scope | |
|---|---|
| Page number | 305 |
| Base year | 2025 |
| Historic period | 2020-2024 |
| Forecast period | 2026-2030 |
| Growth momentum & CAGR | Accelerate at a CAGR of 5.6% |
| Market growth 2026-2030 | USD 4905.5 million |
| Market structure | Fragmented |
| YoY growth 2025-2026(%) | 5.3% |
| Key countries | China, Japan, India, South Korea, Australia, Indonesia, US, Canada, Mexico, Germany, UK, France, Italy, Spain, The Netherlands, Brazil, Argentina, Chile, Saudi Arabia, Turkey, UAE, South Africa and Israel |
| Competitive landscape | Leading Companies, Market Positioning of Companies, Competitive Strategies, and Industry Risks |
Research Analyst Overview
- The Industrial Powder Coatings landscape is experiencing a profound technological restructuring driven by the critical intersection of environmental compliance and manufacturing efficiency. Industrial operators are strategically overhauling their surface finishing operations, pivoting away from traditional solvent-borne systems to adopt high-performance dry powder alternatives.
- This transition is heavily influenced by the urgent boardroom-level directive to minimize hazardous emissions while optimizing overall material utilization. By implementing automated powder recovery systems, manufacturers have achieved a 30% reduction in raw material waste during continuous application cycles.
- The integration of advanced curing technologies directly dictates product strategy, allowing fabricators to coat heat-sensitive substrates without compromising structural integrity or aesthetic quality. Consequently, the reliance on specialized functional powders reshapes global procurement frameworks across the automotive and architectural sectors.
- As regulatory pressures intensify, the prioritization of eco-friendly, highly durable surface treatments ensures that long-term operational planning strictly aligns with modern sustainable engineering standards. This fundamental shift solidifies dry coatings as an indispensable component of advanced industrial fabrication.
What are the Key Data Covered in this Industrial Powder Coatings Market Research and Growth Report?
-
What is the expected growth of the Industrial Powder Coatings Market between 2026 and 2030?
-
USD 4.91 billion, at a CAGR of 5.6%
-
-
What segmentation does the market report cover?
-
The report is segmented by Type (Thermosets, and Thermoplastics), End-user (Automotive, Appliances, Construction, Electronics, and Others), Method (ESD, FBC, and Others) and Geography (APAC, North America, Europe, South America, Middle East and Africa)
-
-
Which regions are analyzed in the report?
-
APAC, North America, Europe, South America and Middle East and Africa
-
-
What are the key growth drivers and market challenges?
-
Stringent global environmental regulations on volatile organic compounds, High capital expenditure requirements for curing infrastructure
-
-
Who are the major players in the Industrial Powder Coatings Market?
-
Akzo Nobel NV, Asian Paints Ltd., Axalta Coating Systems Ltd., Berger Paints India Ltd., Cardinal Paint and Powder Inc., Cloverdale Paint Inc., Diamond Vogel, Erie Powder Coatings, Hentzen Coatings Inc., IFS Coatings, IGP Pulvertechnik AG, Jotun AS, Keyland Polymer, Nippon Paint Holdings Co Ltd., PPG Industries Inc., Prismatic Powders, RPM International Inc., ST Powder Coatings S.p.A., Teknos Group Oy and The Sherwin Williams Co.
-
Market Research Insights
- The Industrial Powder Coatings Market represents a critical evolution in industrial surface finishing, shifting rapidly toward zero-emission applications and sustainable compliance. By integrating these advanced systems, manufacturing facilities enhance robotic application efficiency, leading to a 25% increase in high-volume production throughput.
- Furthermore, replacing conventional solvent-based paints with powder formulations drives a 40% reduction in hazardous waste generation, directly lowering environmental liability costs. Supply chain consolidation ensures that premium resins reach end-users reliably, mitigating raw material shortages.
- Because these dry finishes drastically improve transfer utilization, operators achieve superior metal surface finishing while cutting overall energy expenditure, fundamentally transforming industrial coating economics and operational planning.
We can help! Our analysts can customize this industrial powder coatings market research report to meet your requirements.
 RIA -
RIA - 
