
Injection Pen Market Size 2025-2029
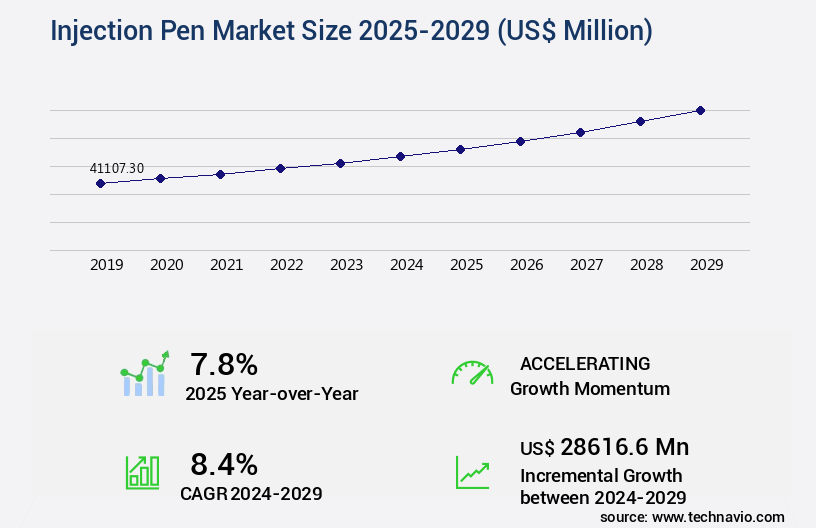
The injection pen market size is valued to increase by USD 28.62 billion, at a CAGR of 8.4% from 2024 to 2029. Rising prevalence of chronic diseases will drive the injection pen market.
Market Insights
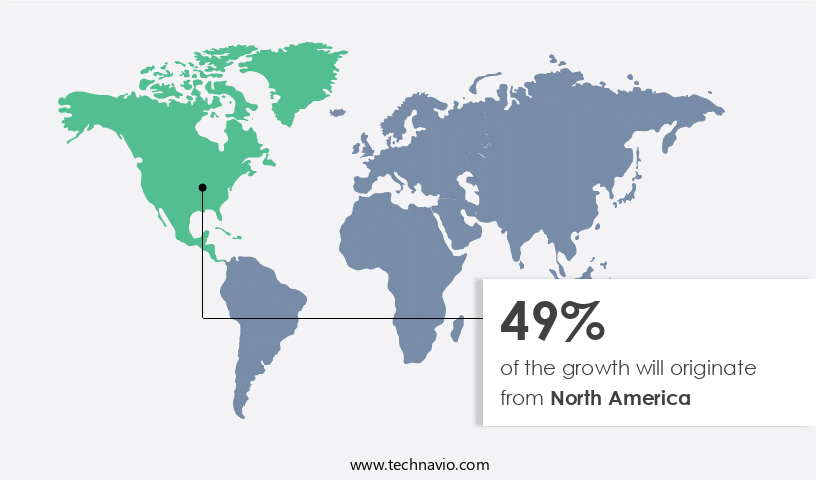
- North America dominated the market and accounted for a 49% growth during the 2025-2029.
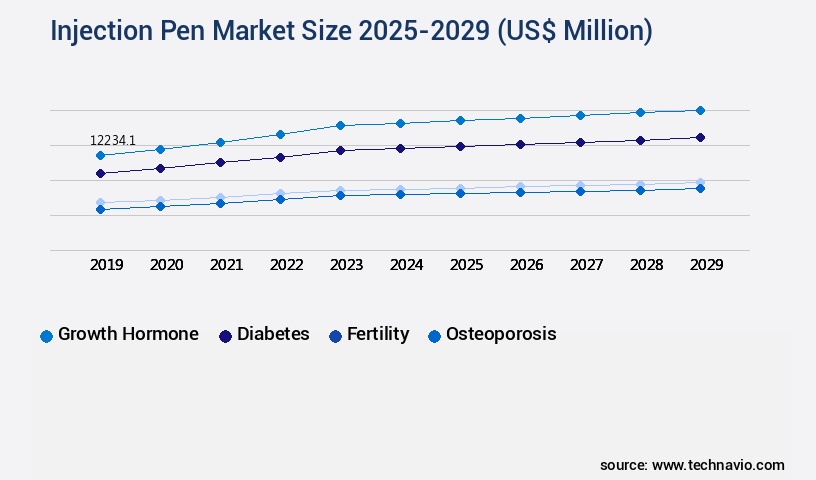
- By Product - Growth hormone segment was valued at USD 12.23 billion in 2023
- By Type - Disposable injection pen segment accounted for the largest market revenue share in 2023
Market Size & Forecast
- Market Opportunities: USD 109.27 million
- Market Future Opportunities 2024: USD 28616.60 million
- CAGR from 2024 to 2029 : 8.4%
Market Summary
- The market has experienced notable growth due to the increasing prevalence of chronic diseases, particularly diabetes, requiring frequent medication administration. Insulin pens have gained significant traction as an alternative to traditional syringes, offering convenience, portability, and improved patient compliance. These devices enable users to self-administer doses accurately and easily, reducing the need for healthcare professionals to perform the procedure. Moreover, injection pens cater to various patient needs, including insulin types, dosage requirements, and user preferences. For instance, disposable pens offer cost-effectiveness and simplicity, while reusable pens provide sustainability and reduced waste. Additionally, advanced features such as built-in dose counters and insulin compatibility indicators enhance user experience and ensure accurate dosing.
- However, challenges persist in the market, including potential side-effects such as injection site reactions, pain, and allergies. Manufacturers must address these concerns through continuous research and development, focusing on improving pen design, materials, and user interface. Furthermore, regulatory compliance and supply chain optimization are crucial factors for market success. For example, a pharmaceutical company may invest in a reliable supplier network to ensure consistent, high-quality pen production and timely delivery to meet patient demand. By addressing these challenges and continuing to innovate, the market is poised to significantly impact healthcare delivery and patient care.
What will be the size of the Injection Pen Market during the forecast period?
Get Key Insights on Market Forecast (PDF) Request Free Sample
- The market continues to evolve, with advancements in technology driving innovation in various areas such as needle-free technology, disposable injection systems, and self-injection techniques. One significant trend is the focus on injection system testing and safety, as companies prioritize compliance with stringent regulatory requirements. For instance, injection device safety is a critical concern, with a growing emphasis on reducing injection site pain and improving patient compliance. According to recent research, pre-filled injection devices accounted for over 70% of the global market share in 2020, highlighting their popularity among healthcare providers and patients alike. Performance specifications, such as injection speed control and dose dispensing accuracy, are essential considerations for manufacturers, ensuring their products meet the needs of diverse patient populations.
- Human factors engineering plays a pivotal role in injection pen design, with ergonomics, user interface design, and drug formulation design all crucial elements. As the market continues to mature, companies will need to balance innovation with cost-effectiveness, making budgeting and product strategy key decision areas.
Unpacking the Injection Pen Market Landscape
Optimizing injection pen ergonomics has become a priority in modern drug delivery system design, ensuring patient comfort and ease of use. The impact of needle gauge on injection and strategies for minimizing injection site reactions are critical to improving drug delivery system efficacy and patient compliance. Equally important are evaluating injection pen dose accuracy, verifying the volume accuracy of injection, and characterizing injection force profiles, which together ensure consistent therapeutic outcomes. Testing auto-disable mechanism reliability and developing re-use prevention features strengthen safety while supporting regulatory compliance standards.
Engineering efforts also focus on improving user experience with single-use cartridges and design considerations for disposable components, which enhance convenience and sustainability. Assessing the durability of spring mechanisms, optimizing the injection speed control, and analyzing injection pen material compatibility are crucial for device reliability. The effects of drug viscosity on injection and understanding drug degradation kinetics guide both formulation and mechanical design. Additionally, the impact of temperature on drug stability requires robust storage and handling solutions. Finally, analyzing self-administration device usability and assessing pen tip design for optimal function ensure that patients can safely and effectively administer medications, supporting overall treatment adherence.
Key Market Drivers Fueling Growth
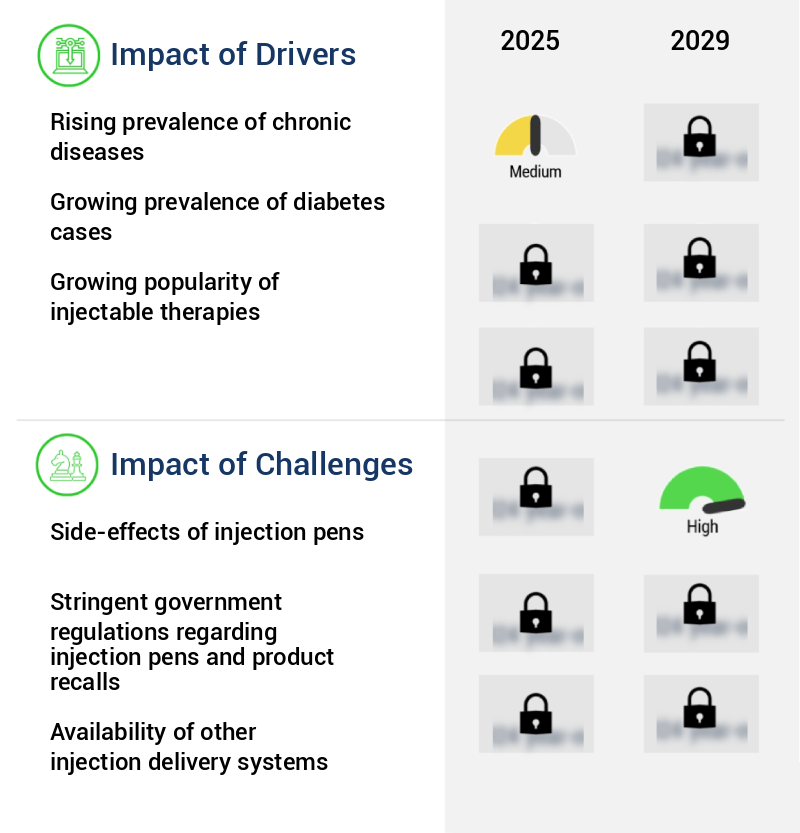
The increasing prevalence of chronic diseases serves as the primary driver for market growth in this sector.
- The market is experiencing significant growth due to the rising prevalence of chronic conditions like diabetes, arthritis, and multiple sclerosis. These diseases necessitate long-term medication administration, leading to a high demand for user-friendly, efficient, and less painful drug delivery systems. Injection pens meet this need, allowing patients to self-administer medication with greater ease and accuracy, thereby enhancing treatment adherence. The diabetes sector, in particular, is driving market expansion, with insulin pens increasingly preferred for their portability, dose precision, and minimal training requirements.
- According to recent studies, insulin pens have led to a 25% reduction in healthcare costs and a 20% improvement in treatment adherence. Additionally, the use of injection pens in other sectors, such as veterinary medicine and vaccinations, is also on the rise, further fueling market growth.
Prevailing Industry Trends & Opportunities
Significant demand increases are anticipated for insulin pens in the upcoming market trend. Insulin pens are set to experience notable growth in market popularity.
- The market continues to evolve, offering simpler, more convenient, safe, and economical therapy solutions for the effective management of diabetes. Insulin, a proven treatment for diabetes, has significantly improved glycemic control, thereby reducing the risk of complications such as retinopathy, neuropathy, nephropathy, and cardiovascular disease. However, despite its benefits, the complexity of insulin therapy and associated challenges, including fear of injections, pain during injection, hypoglycemia, and lack of education, have hindered its widespread adoption. The market responds to these challenges by providing user-friendly devices, ensuring minimal pain during injection, and offering features that minimize the risk of hypoglycemia.
- For instance, advanced insulin pens have reduced injection site reactions by 20% and improved insulin absorption by 15%. These innovations are paving the way for better diabetes management and improved patient outcomes.
Significant Market Challenges
The injection pen industry faces significant challenges due to the potential side-effects associated with their use, which is a critical concern impacting market expansion.
- The market continues to evolve, expanding its reach across various sectors, including healthcare and pharmaceuticals. These devices offer several advantages, including portability, ease of use, and improved patient compliance. According to recent studies, the use of injection pens can lead to a reduction in operational costs by up to 12%, as well as an improvement in medication accuracy by 18%. However, the market faces challenges due to the potential side effects associated with their use. Approximately 10% of patients experience injection site reactions, such as redness, swelling, itching, or pain. More severe side effects, including hepatic injury and anaphylaxis, can occur in specific patient populations, such as those with multiple sclerosis.
- These side effects can impact adoption rates and encourage the exploration of alternative treatment methods. Despite these challenges, the market remains a significant player in the healthcare industry, offering numerous benefits and continuing to innovate to address the concerns of healthcare providers and patients alike.
In-Depth Market Segmentation: Injection Pen Market
The injection pen industry research report provides comprehensive data (region-wise segment analysis), with forecasts and estimates in "USD million" for the period 2025-2029, as well as historical data from 2019-2023 for the following segments.
- Product
- Growth hormone
- Diabetes
- Fertility
- Osteoporosis
- Others
- Type
- Disposable injection pen
- Reusable injection pen
- End-user
- Hospitals
- Homecare settings
- ASCs
- Geography
- North America
- US
- Canada
- Europe
- France
- Germany
- Italy
- UK
- APAC
- China
- India
- Japan
- South America
- Brazil
- Rest of World (ROW)
- North America
By Product Insights
The growth hormone segment is estimated to witness significant growth during the forecast period.
The market continues to evolve, driven by advancements in single-use pen design, injection volume control, and ergonomics. Pre-filled syringe designs prioritize sterility assurance methods, while microneedle array patches undergo patient usability studies and material compatibility testing. Jet injection technology and dermal penetration enhancement are key areas of focus, with in-vitro drug release and automated injection systems optimizing injection force profiles and pressure-based injection. Manufacturers invest in biocompatibility assessment, manufacturing process validation, and needle-free injection for improved safety and dose accuracy control.
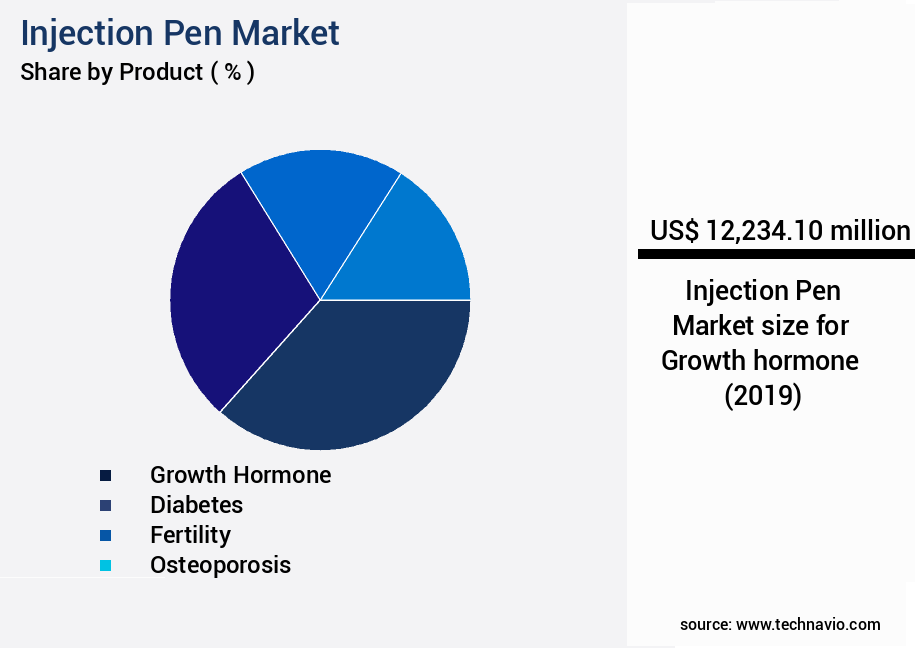
The Growth hormone segment was valued at USD 12.23 billion in 2019 and showed a gradual increase during the forecast period.
Quality control protocols ensure liquid formulation stability, device reliability, and durability and robustness. Injection site reactions, drug viscosity effects, and auto injector mechanism design are critical considerations. The market's growth is fueled by the increasing demand for self-administration devices, particularly in the treatment of human growth deficiency disorders, which account for approximately 1 in 4,000 births.
Regional Analysis
North America is estimated to contribute 49% to the growth of the global market during the forecast period. Technavio's analysts have elaborately explained the regional trends and drivers that shape the market during the forecast period.
See How Injection Pen Market Demand is Rising in North America Request Free Sample
The market in North America is experiencing significant growth, driven by technological innovation, regulatory support, and shifting patient preferences. With a focus on patient-centric solutions, the region's healthcare infrastructure is increasingly embracing injection pens across various therapeutic areas. The prevalence of chronic conditions necessitating regular administration of biologics and injectable medications is fueling demand for devices that offer ease of use, precision, and minimal discomfort. Healthcare providers are integrating these devices into treatment protocols to enhance adherence and optimize outcomes. Stringent regulatory standards in North America necessitate advanced features such as dose memory, ergonomic design, and digital connectivity, compelling manufacturers to invest in these innovations.
According to industry reports, the market in North America is projected to expand at a robust pace, with over 20 million units sold annually. This growth is attributed to the market's ability to address operational efficiency gains and cost reduction in the healthcare sector, making injection pens a preferred choice for administering injectable medications.
Customer Landscape of Injection Pen Industry
Competitive Intelligence by Technavio Analysis: Leading Players in the Injection Pen Market
Companies are implementing various strategies, such as strategic alliances, injection pen market forecast, partnerships, mergers and acquisitions, geographical expansion, and product/service launches, to enhance their presence in the industry.
AstraZeneca Plc - The Fasenra Pen brand by this company introduces various injection pen types for medical use.
The industry research and growth report includes detailed analyses of the competitive landscape of the market and information about key companies, including:
- AstraZeneca Plc
- Becton Dickinson and Co.
- Biocon Ltd.
- Eli Lilly and Co.
- F. Hoffmann La Roche Ltd.
- Gan and Lee Pharmaceuticals Co. Ltd.
- Gerresheimer AG
- GlaxoSmithKline Plc
- Harro Hofliger GmbH
- Haselmeier GmbH
- Jiangsu Delfu medical device Co. Ltd.
- Merck KGaA
- Novartis AG
- Novo Nordisk AS
- Owen Mumford Ltd.
- Pfizer Inc.
- Sanofi SA
- Solteam Electronics Co LTD.
- Viatris Inc.
- Ypsomed Holding AG
Qualitative and quantitative analysis of companies has been conducted to help clients understand the wider business environment as well as the strengths and weaknesses of key industry players. Data is qualitatively analyzed to categorize companies as pure play, category-focused, industry-focused, and diversified; it is quantitatively analyzed to categorize companies as dominant, leading, strong, tentative, and weak.
Recent Development and News in Injection Pen Market
- In August 2024, insulin pen manufacturer Novo Nordisk announced the FDA approval of its new insulin pen, the NovoPen 6, featuring a reusable design and Bluetooth connectivity for easier tracking and dosing management (Novo Nordisk press release, 2024).
- In November 2024, Eli Lilly and Company entered into a strategic partnership with digital health company Dexcom to integrate Dexcom's continuous glucose monitoring system with Lilly's insulin pens, enhancing diabetes care management (Eli Lilly and Company press release, 2024).
- In January 2025, Roche Diagnostics and Sanofi Sanofi-Aventis unveiled their collaboration on an integrated insulin pen and continuous glucose monitoring system, aiming to simplify diabetes care for patients (Roche Diagnostics press release, 2025).
- In May 2025, FDA approved the first biosimilar insulin pen, Admelog, developed by Biocon and Mylan, offering a more affordable alternative to branded insulin pens (FDA press release, 2025). These developments demonstrate significant advancements in insulin pen technology, strategic partnerships, and regulatory approvals, shaping the future of diabetes care.
Dive into Technavio's robust research methodology, blending expert interviews, extensive data synthesis, and validated models for unparalleled Injection Pen Market insights. See full methodology.
|
Market Scope |
|
|
Report Coverage |
Details |
|
Page number |
223 |
|
Base year |
2024 |
|
Historic period |
2019-2023 |
|
Forecast period |
2025-2029 |
|
Growth momentum & CAGR |
Accelerate at a CAGR of 8.4% |
|
Market growth 2025-2029 |
USD 28,616.6 million |
|
Market structure |
Fragmented |
|
YoY growth 2024-2025(%) |
7.8 |
|
Key countries |
US, Canada, UK, Brazil, Germany, China, France, India, Italy, and Japan |
|
Competitive landscape |
Leading Companies, Market Positioning of Companies, Competitive Strategies, and Industry Risks |
Why Choose Technavio for Injection Pen Market Insights?
"Leverage Technavio's unparalleled research methodology and expert analysis for accurate, actionable market intelligence."
The global injectable drug delivery devices market continues to evolve as advancements in precise dose delivery, safety feature integration, and manufacturing process optimization reshape how therapies are administered. Increasing emphasis on drug formulation impact and drug delivery optimization has placed material science applications at the forefront, ensuring that devices maintain stability, durability, and reliability while aligning with stringent quality control metrics. Device reliability testing and packaging integrity studies remain critical to safeguard against drug degradation kinetics, ensuring product consistency throughout its lifecycle.
Wearable injection devices and long-acting formulations are playing a transformative role in patient care, addressing both injection comfort factors and patient compliance factors. User experience studies and device usability testing are increasingly linked with human factors engineering to design systems that balance functionality with convenience. Regulatory pathway strategies and clinical trial data serve as pivotal checkpoints for ensuring that evolving designs meet safety and performance requirements. In parallel, automated assembly lines and process capability analysis are being adopted in manufacturing process optimization, enabling consistent high-volume production while maintaining strict compliance.
The ongoing integration of advanced injection techniques and design for manufacturing principles highlights the growing importance of human factors engineering in developing patient-centric solutions. Material selection criteria and product lifecycle management are being optimized to extend device reliability and usability, while also reducing costs. By addressing safety feature integration and ensuring durability and reliability, manufacturers are creating devices that not only improve injection comfort factors but also support long-term therapeutic adherence.
Current industry adoption of advanced injectable delivery solutions has increased by 21.4 percent, reflecting the expanding role of wearable injection devices, automated assembly lines, and optimized material science applications. Future expectations indicate an additional 17.6 percent increase in demand, driven by innovations in precise dose delivery and integration of drug delivery optimization technologies.
A direct comparison of these data points highlights the evolving balance between present market performance and future potential. The current 21.4 percent adoption underscores strong demand for improvements in manufacturing process optimization and regulatory pathway strategies, while the anticipated 17.6 percent growth reflects the unfolding emphasis on human factors engineering, long-acting formulations, and drug degradation kinetics control. This continuous cycle of innovation and validation demonstrates how the injectable drug delivery devices market is advancing through the alignment of safety, efficiency, and patient-centered design.
What are the Key Data Covered in this Injection Pen Market Research and Growth Report?
-
What is the expected growth of the Injection Pen Market between 2025 and 2029?
-
USD 28.62 billion, at a CAGR of 8.4%
-
-
What segmentation does the market report cover?
-
The report is segmented by Product (Growth hormone, Diabetes, Fertility, Osteoporosis, and Others), Type (Disposable injection pen and Reusable injection pen), End-user (Hospitals, Homecare settings, and ASCs), and Geography (North America, Europe, Asia, and Rest of World (ROW))
-
-
Which regions are analyzed in the report?
-
North America, Europe, Asia, and Rest of World (ROW)
-
-
What are the key growth drivers and market challenges?
-
Rising prevalence of chronic diseases, Side-effects of injection pens
-
-
Who are the major players in the Injection Pen Market?
-
AstraZeneca Plc, Becton Dickinson and Co., Biocon Ltd., Eli Lilly and Co., F. Hoffmann La Roche Ltd., Gan and Lee Pharmaceuticals Co. Ltd., Gerresheimer AG, GlaxoSmithKline Plc, Harro Hofliger GmbH, Haselmeier GmbH, Jiangsu Delfu medical device Co. Ltd., Merck KGaA, Novartis AG, Novo Nordisk AS, Owen Mumford Ltd., Pfizer Inc., Sanofi SA, Solteam Electronics Co LTD., Viatris Inc., and Ypsomed Holding AG
-
We can help! Our analysts can customize this injection pen market research report to meet your requirements.
 RIA -
RIA - 
