
Instrumentation Tubing Market Size and Growth Forecast 2026-2030
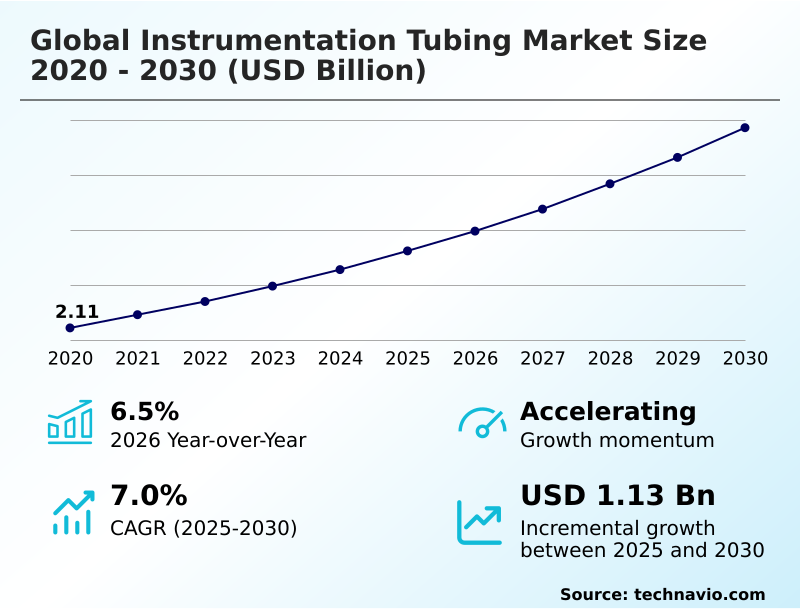
The Instrumentation Tubing Market size was valued at USD 2.81 billion in 2025 growing at a CAGR of 7% during the forecast period 2026-2030.
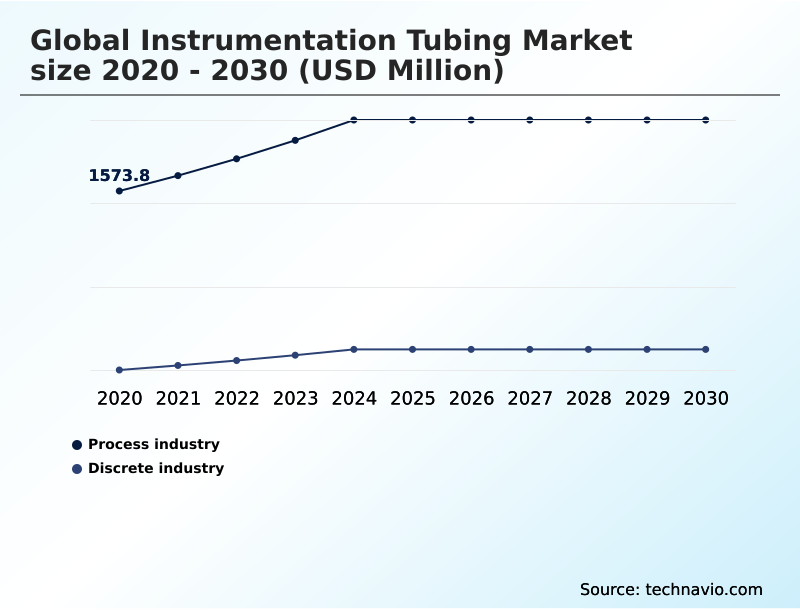
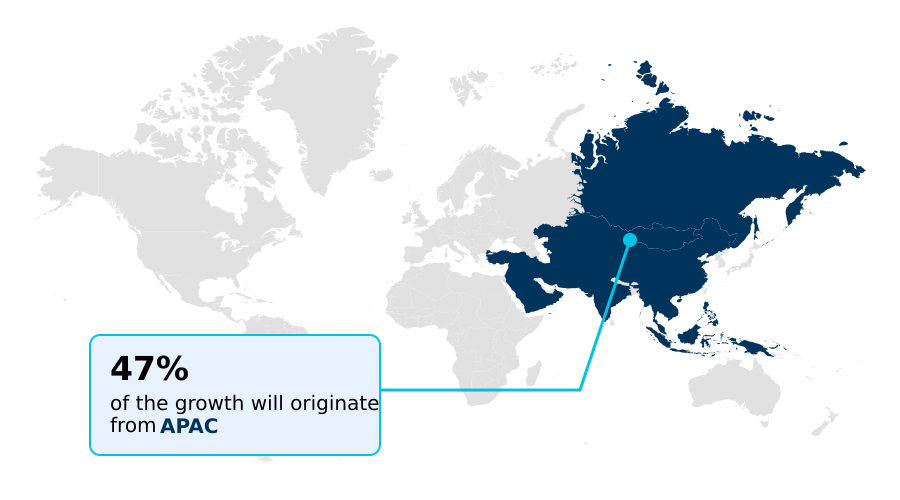
APAC accounts for 46.6% of incremental growth during the forecast period. The Process industry segment by End-user was valued at USD 1.98 billion in 2024, while the Seamless segment holds the largest revenue share by Type.
The market is projected to grow by USD 1.82 billion from 2020 to 2030, with USD 1.13 billion of the growth expected during the forecast period of 2025 to 2030.
Get Key Insights on Market Forecast (PDF) Request Free Sample
Instrumentation Tubing Market Overview
The instrumentation tubing market is fundamentally shaped by the stringent demands of industrial process control. With APAC poised to contribute nearly 47% of the market's incremental growth, the demand for high-integrity fluid system components is accelerating. This is not just about replacing old infrastructure; it's about upgrading to meet higher operational and regulatory standards. For instance, a mid-sized petrochemical plant, in response to tightening EPA regulations, recently undertook a comprehensive upgrade of its process control instrumentation. By replacing aging lines with seamless stainless steel tubing featuring robust high-pressure fittings and full material traceability certification, the facility effectively eliminated persistent fugitive emissions, achieving a documented 15% reduction in valve maintenance cycles and ensuring full compliance with leak detection and repair mandates. This illustrates a market where procurement decisions are increasingly dictated by total cost of ownership and risk mitigation, prioritizing corrosion resistant alloys and proven pressure integrity over upfront cost, a trend that is consistent with the market's overall year-over-year growth of 6.5%.
Drivers, Trends, and Challenges in the Instrumentation Tubing Market
Procurement decisions within the instrumentation tubing market are increasingly complex, balancing upfront cost against long-term performance and regulatory compliance. The debate over seamless vs welded tubing performance continues, but for applications governed by stringent safety protocols, the former is preferred.
For instance, in designing systems for the energy transition, the selection of instrumentation tubing for hydrogen service is now governed by standards like ISO 19887-1, which scrutinizes materials for hydrogen embrittlement. Similarly, the use of advanced alloys for sour gas environments requires strict adherence to NACE MR0175 to prevent catastrophic failure due to stress corrosion cracking.
A critical decision point for project managers involves total cost of ownership; while tubing selection for subsea control lines using premium nickel-based alloys may have an initial cost 40% higher than standard duplex grades, their extended operational life in corrosive deepwater environments can halve long-term maintenance expenditures.
This calculation is vital for applications from high purity tubing for semiconductor fabrication to material requirements for carbon capture, where system integrity is paramount. The choice ultimately reflects a strategic assessment of operational risk versus capital investment.
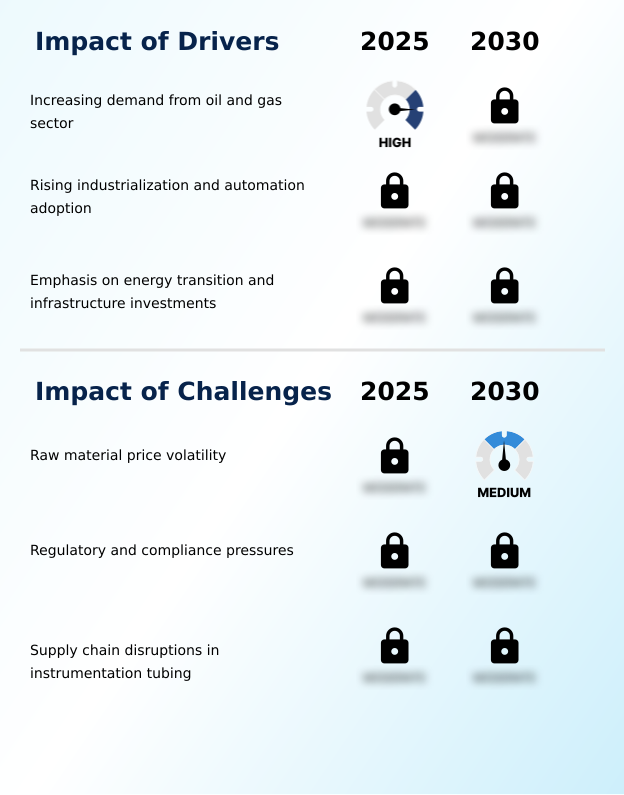
Primary Growth Driver: Sustained demand from the oil and gas sector, where precise fluid and gas transmission is essential for operational safety and efficiency, acts as a primary market driver.
The relentless push for industrial automation across both process and discrete sectors is a primary market driver. As smart factories become the norm, the need for reliable process control instrumentation escalates, directly fueling demand for precision tubing.
These automated systems rely on vast networks of sensors and actuators connected by fluid system components that must provide flawless, leak-tight connections to ensure data accuracy and operational safety.
The Discrete Industry segment, projected to reach nearly USD 987.1 million by 2026, exemplifies this trend's expansion beyond traditional chemical plants into automotive and electronics manufacturing.
Achieving the required dimensional tolerance control for these automated systems necessitates high-quality seamless stainless steel tubing, solidifying the link between Industry 4.0 adoption and market growth.
Emerging Market Trend: A pronounced market trend shows a clear shift in preference toward seamless tubing over welded alternatives, driven by its superior strength and reliability in critical, high-pressure applications.
A significant trend is the focus on advanced alloy development to meet the demands of the global energy transition. As industries pivot to hydrogen and carbon capture, material innovation in tubing becomes critical to handle new operational challenges like hydrogen embrittlement and CO2-induced corrosion. This is driving investment in specialized nickel based alloys and duplex stainless steels with enhanced properties.
The trend is most pronounced in APAC, which registers the highest regional CAGR of 8.8%, as new clean energy infrastructure projects in the region specify these next-generation materials from the outset.
This shift requires suppliers to prove performance through stringent non-destructive testing and provide comprehensive material traceability certification, moving the competitive basis from cost to proven metallurgical expertise and supply chain reliability.
Key Industry Challenge: Significant volatility in the prices of raw materials such as stainless steel and nickel alloys presents a core challenge, directly impacting production costs and profitability.
The primary challenge confronting the market is the dual threat of raw material price volatility and escalating supply chain disruptions. With key materials like nickel and chromium subject to geopolitical and logistical pressures, manufacturers face significant margin compression.
This risk is amplified by geographic concentration; with APAC accounting for over 46% of the market's incremental growth, any disruption in the region's global supply networks can have an outsized impact on global availability and pricing. In response, procurement decision-makers are intensifying their scrutiny of supply chain reliability and demanding more robust material traceability certification.
This environment forces manufacturers to either absorb rising costs, risking profitability, or pass them on, risking market share, making strategic sourcing and hedging against price changes a critical operational imperative.
Explore Full Market Dynamics Analysis Request Free Sample
Instrumentation Tubing Market Segmentation
The instrumentation tubing industry research report provides comprehensive data including region-wise segment analysis, with forecasts and analysis for the period 2026-2030, as well as historical data from 2020-2024 for the following segments.
End-user Segment Analysis
The process industry segment is estimated to witness significant growth during the forecast period.
The process industry segment, encompassing oil and gas, chemical, and power generation, remains the primary end-user. Demand is driven by the necessity for high-performance fluid system components in applications requiring stringent process control instrumentation.
Within this segment, which accounts for over two-thirds of the total market, there is a strong emphasis on corrosion resistant alloys and seamless stainless steel tubing to ensure pressure integrity and operational safety in harsh environments.
For instance, in petrochemical processing facilities, adherence to standards like the Pressure Equipment Directive (PED) mandates the use of materials with complete material traceability certification to mitigate risks associated with high-pressure fittings and prevent fugitive emissions, making tubing selection a critical factor in both capital projects and maintenance budgets.
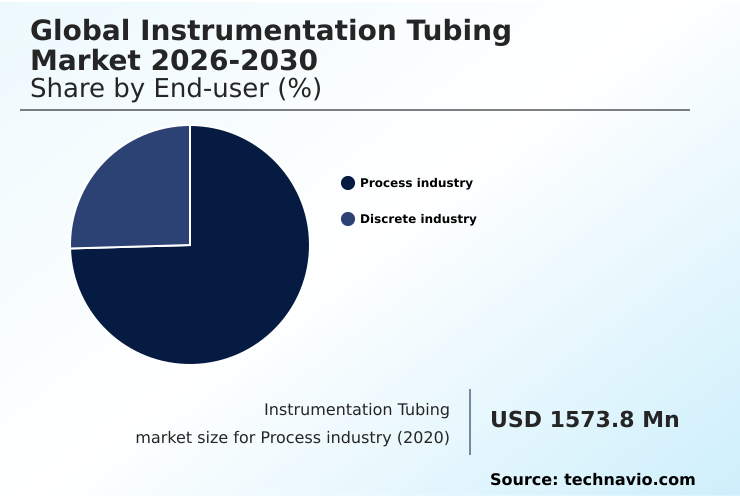
The Process industry segment was valued at USD 1.98 billion in 2024 and showed a gradual increase during the forecast period.
Instrumentation Tubing Market by Region: APAC Leads with 46.6% Growth Share
APAC is estimated to contribute 46.6% to the growth of the global market during the forecast period.
The geographic landscape is characterized by a distinct split between mature, replacement-driven markets and high-growth, industrializing regions.
APAC commands the market's growth trajectory, contributing approximately 46.6% of the forecast period's incremental growth, fueled by massive infrastructure projects in China and India.
These projects demand vast quantities of fluid system components for new chemical, power, and manufacturing facilities, driving volume for both seamless and welded tubing.
In contrast, North America and Europe, with CAGRs of 5.6% and 5.4% respectively, focus on upgrades and retrofits.
In these regions, procurement is driven by the need to enhance industrial automation and comply with stringent environmental standards, prioritizing advanced alloy development and solutions offering superior dimensional tolerance control to ensure leak-tight connections in existing, complex systems.
Customer Landscape Analysis for the Instrumentation Tubing Market
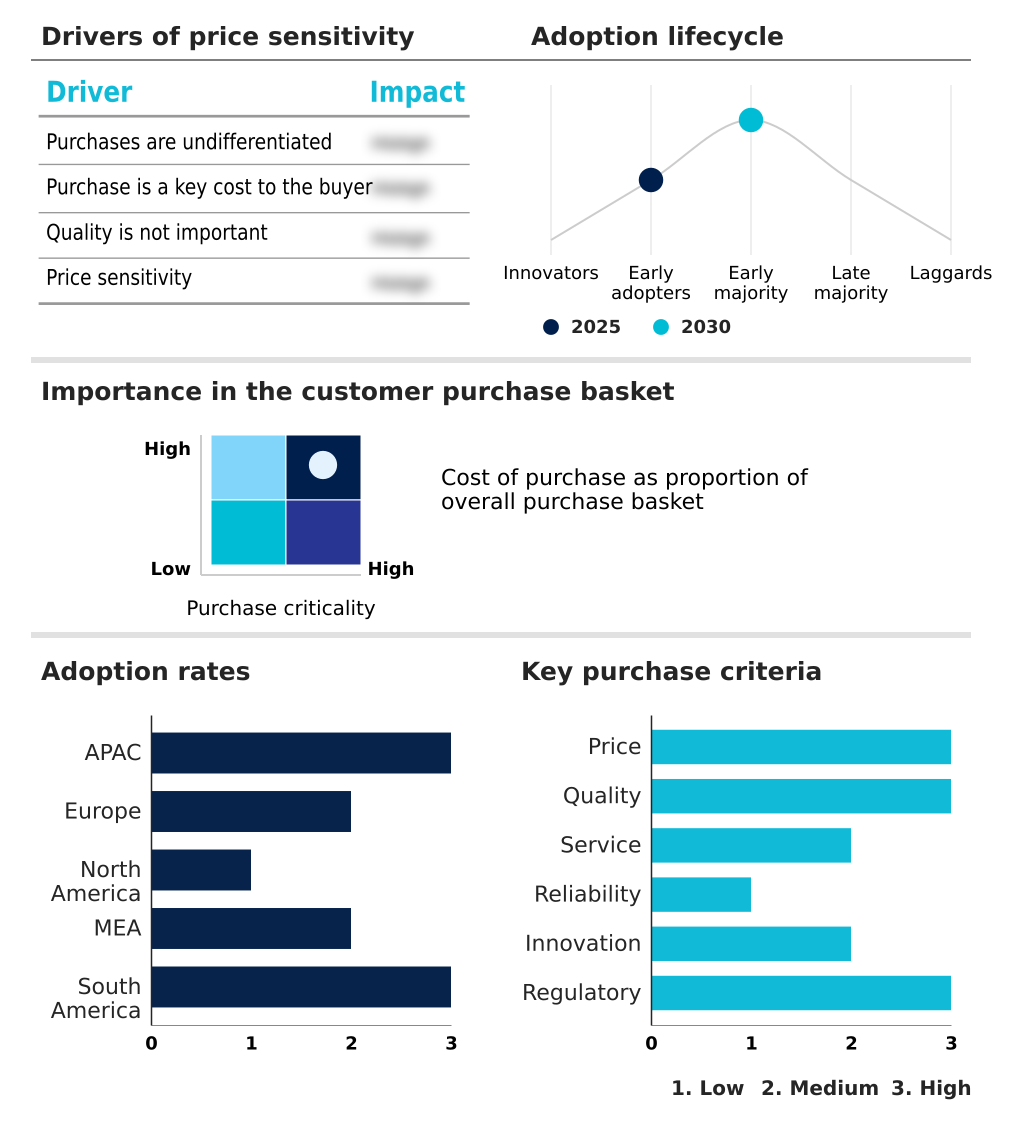
The instrumentation tubing market forecasting report includes the adoption lifecycle of the market, covering from the innovator’s stage to the laggard’s stage. It focuses on adoption rates in different regions based on penetration. Furthermore, the instrumentation tubing market report also includes key purchase criteria and drivers of price sensitivity to help companies evaluate and develop their market growth analysis strategies.
Competitive Landscape of the Instrumentation Tubing Market
Companies are implementing various strategies, such as strategic alliances, partnerships, mergers and acquisitions, geographical expansion, and product/service launches, to enhance their presence in the instrumentation tubing market industry.
Alleima AB - Specializes in high-performance tubing from advanced corrosion-resistant alloys, ensuring leak-tight integrity for critical hydraulic and instrumentation fluid systems.
The industry research and growth report includes detailed analyses of the competitive landscape of the market and information about key companies, including:
- Alleima AB
- AMETEK Inc.
- ASC Engineered Solutions LLC
- Maxim Tubes Co. Pvt. Ltd.
- Nippon Steel Corp.
- Parker Hannifin Corp.
- Pascal Industries Pte. Ltd.
- Sachiya Steel International
- Salzgitter AG
- Sino Alloy
- Steelmor Industries
- SURAJ Ltd.
- Swagelok Co.
- TPS Technitube Rohrenwerke
- Tubacex SA
- Tylok International Inc.
- Vardhman Tube Mill
- Waverley Brownall Ltd.
- Webco Industries Inc.
Qualitative and quantitative analysis of companies has been conducted to help clients understand the wider business environment as well as the strengths and weaknesses of key industry players. Data is qualitatively analyzed to categorize companies as pure play, category-focused, industry-focused, and diversified; it is quantitatively analyzed to categorize companies as dominant, leading, strong, tentative, and weak.
Recent Developments in the Instrumentation Tubing Market
- In September 2024, Alleima AB expanded its production capacity for specialized tubing at its facility in Sandviken, Sweden, to meet growing demand from the European hydrogen energy sector.
- In October 2024, Zekelman Industries announced a USD 120 million investment in new production technology at its Wheatland Tube division to enhance the quality of laser-welded products for industrial fluid management systems.
- In March 2025, Parker Hannifin Corp. introduced a new line of lightweight titanium and alloy tubes designed to improve fuel efficiency and reduce weight in aerospace and defense applications.
- In April 2025, Parker Hannifin Corp. launched its MPI Series compression fittings and tubing, rated to 20,000 PSI, to enhance safety and reliability in high-pressure industrial automation and control systems.
Research Analyst Overview: Instrumentation Tubing Market
The instrumentation tubing market's evolution is driven by material science and its direct impact on operational risk, a key concern in boardroom-level capital expenditure planning. The Process industry's dominance, representing more than double the size of the Discrete industry segment, underscores the critical nature of material selection in sectors where failure is not an option.
For a Chief Operating Officer of a major energy firm, the decision to specify corrosion resistant alloys for sour gas service is not just a technical choice but a strategic one, directly tied to asset integrity and compliance with NACE MR0175 standards.
The upfront investment in cold drawn seamless tubes made from advanced nickel based alloys, verified through rigorous non-destructive testing, is justified by mitigating the immense financial and safety risks of system failure.
This focus on lifecycle performance and risk management is pushing the industry towards greater adoption of advanced materials and precision manufacturing techniques like orbital welding, making material innovation a central pillar of competitive strategy.
Dive into Technavio’s robust research methodology, blending expert interviews, extensive data synthesis, and validated models for unparalleled Instrumentation Tubing Market insights. See full methodology.
| Market Scope | |
|---|---|
| Page number | 295 |
| Base year | 2025 |
| Historic period | 2020-2024 |
| Forecast period | 2026-2030 |
| Growth momentum & CAGR | Accelerate at a CAGR of 7% |
| Market growth 2026-2030 | USD 1126.3 million |
| Market structure | Fragmented |
| YoY growth 2025-2026(%) | 6.5% |
| Key countries | China, Japan, India, South Korea, Australia, Indonesia, Germany, UK, Italy, France, Spain, The Netherlands, US, Canada, Mexico, Saudi Arabia, UAE, South Africa, Israel, Turkey, Brazil, Argentina and Chile |
| Competitive landscape | Leading Companies, Market Positioning of Companies, Competitive Strategies, and Industry Risks |
Instrumentation Tubing Market: Key Questions Answered in This Report
-
What is the expected growth of the Instrumentation Tubing Market between 2026 and 2030?
-
The Instrumentation Tubing Market is expected to grow by USD 1.13 billion during 2026-2030, registering a CAGR of 7%. Year-over-year growth in 2026 is estimated at 6.5%%. This acceleration is shaped by increasing demand from oil and gas sector, which is intensifying demand across multiple end-use verticals covered in the report.
-
-
What segmentation does the market report cover?
-
The report is segmented by End-user (Process industry, and Discrete industry), Type (Seamless, and Welded), Material (Stainless steel, Nickel alloys, Titanium, and Others) and Geography (APAC, Europe, North America, Middle East and Africa, South America). Among these, the Process industry segment is estimated to witness significant growth during the forecast period, driven by rising adoption across key application areas. Each segment includes detailed qualitative and quantitative analysis, along with historical data from 2020-2024 and forecasts through 2030 with year-over-year growth rates.
-
-
Which regions are analyzed in the report?
-
The report covers APAC, Europe, North America, Middle East and Africa and South America. APAC is estimated to contribute 46.6% to market growth during the forecast period. Country-level analysis includes China, Japan, India, South Korea, Australia, Indonesia, Germany, UK, Italy, France, Spain, The Netherlands, US, Canada, Mexico, Saudi Arabia, UAE, South Africa, Israel, Turkey, Brazil, Argentina and Chile, with dedicated market size tables and year-over-year growth for each.
-
-
What are the key growth drivers and market challenges?
-
The primary driver is increasing demand from oil and gas sector, which is accelerating investment and industry demand. The main challenge is raw material price volatility, creating operational barriers for key market participants. The report quantifies the impact of each driver and challenge across 2026 and 2030 with comparative analysis.
-
-
Who are the major players in the Instrumentation Tubing Market?
-
Key vendors include Alleima AB, AMETEK Inc., ASC Engineered Solutions LLC, Maxim Tubes Co. Pvt. Ltd., Nippon Steel Corp., Parker Hannifin Corp., Pascal Industries Pte. Ltd., Sachiya Steel International, Salzgitter AG, Sino Alloy, Steelmor Industries, SURAJ Ltd., Swagelok Co., TPS Technitube Rohrenwerke, Tubacex SA, Tylok International Inc., Vardhman Tube Mill, Waverley Brownall Ltd. and Webco Industries Inc.. The report provides qualitative and quantitative analysis categorizing companies as dominant, leading, strong, tentative, and weak based on their market positioning. Company profiles include business segment analysis, SWOT assessment, key offerings, and recent strategic developments.
-
Instrumentation Tubing Market Research Insights
Market dynamics are increasingly shaped by a dual focus on regulatory compliance and performance in extreme environments. Adherence to standards like REACH for material composition and the Pressure Equipment Directive for system safety guides procurement decisions, pushing demand toward high-performance materials. This is particularly evident in the seamless segment, which is growing faster than its welded counterpart.
In a typical semiconductor manufacturing cleanroom, for example, the specification of electropolished, high-purity tubing is non-negotiable to prevent micro-contamination in gas delivery systems, directly impacting chip yields. The emphasis on surface finish quality and guaranteed leak-tight connections, verified by material traceability certification, highlights a market where technical specification, not price, is the primary differentiator.
This shift reinforces the need for suppliers to demonstrate superior quality control systems and deep expertise in metallurgy to gain and retain customers in high-stakes applications.
We can help! Our analysts can customize this instrumentation tubing market research report to meet your requirements.
 RIA -
RIA - 
