
Pipe And Tubing Tools Market Analysis, Size, and Forecast 2026-2030: North America (US, Canada, and Mexico), APAC (China, Japan, and India), Europe (Germany, UK, and France), Middle East and Africa (Saudi Arabia, UAE, and South Africa), South America (Brazil, Argentina, and Chile), and Rest of World (ROW)

Pipe And Tubing Tools Market Analysis, Size, and Forecast 2026-2030:
North America (US, Canada, and Mexico), APAC (China, Japan, and India), Europe (Germany, UK, and France), Middle East and Africa (Saudi Arabia, UAE, and South Africa), South America (Brazil, Argentina, and Chile), and Rest of World (ROW)

Published: Oct 2026 302 Pages SKU: IRTNTR44054

Market Overview at a Glance

$613.4 Mn
Market Opportunity
3.3%
CAGR 2025 - 2030
40.8%
North America Growth
$1.96 B
Piping equipment segment 2024

Pipe And Tubing Tools Market Size 2026-2030

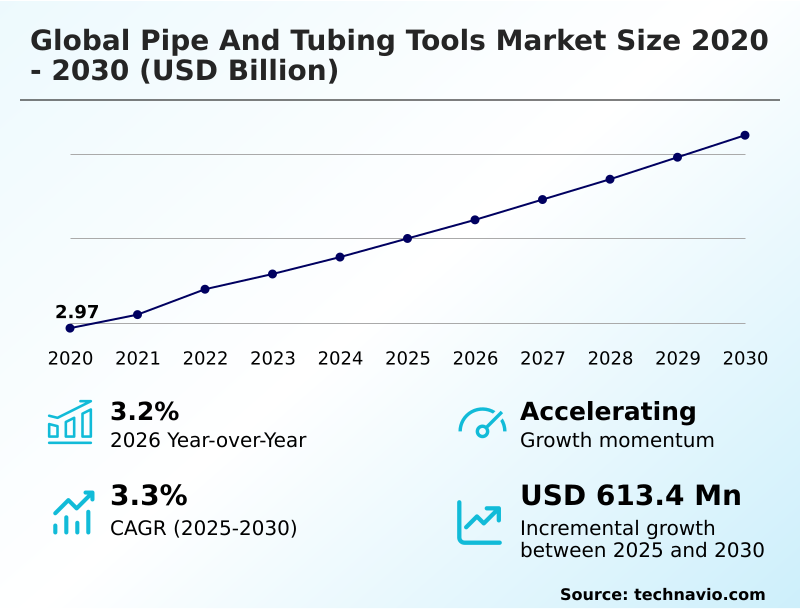
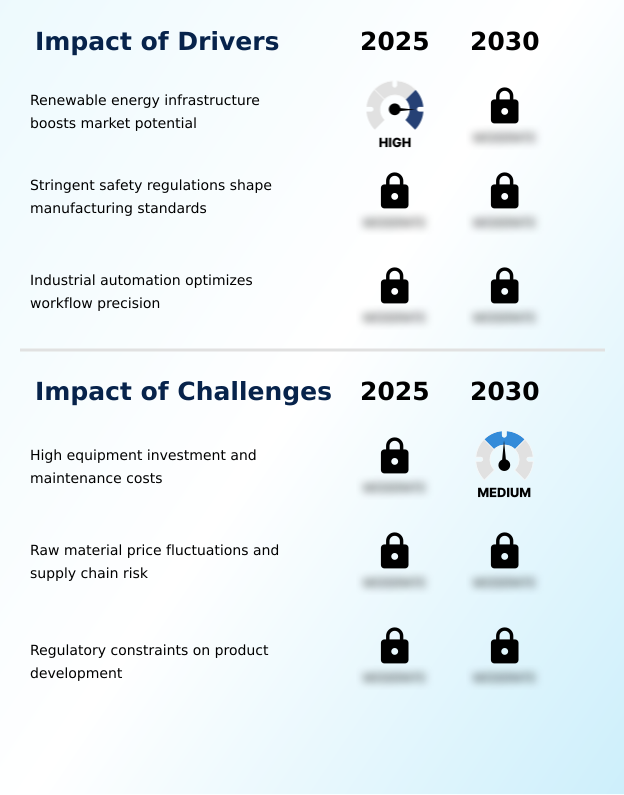
The pipe and tubing tools market size is valued to increase by USD 613.4 million, at a CAGR of 3.3% from 2025 to 2030. Renewable energy infrastructure boosts market potential will drive the pipe and tubing tools market.

Major Market Trends & Insights

  • North America dominated the market and accounted for a 40.8% growth during the forecast period.
  • By Type - Piping equipment segment was valued at USD 1.96 billion in 2024
  • By End-user - Oil and gas segment accounted for the largest market revenue share in 2024

Market Size & Forecast

  • Market Opportunities: USD 1.14 billion
  • Market Future Opportunities: USD 613.4 million
  • CAGR from 2025 to 2030 : 3.3%

Market Summary

  • The Pipe And Tubing Tools Market experiences continuous evolution driven by rigorous infrastructure overhauls and industrial automation. Utility contractors and manufacturing facilities increasingly prioritize intelligent mechanical joining equipment to meet strict structural integrity standards. By integrating digital calibration into heavy-duty pipe threaders and pressing machines, site managers have successfully reduced joint leakage defects by over 18%, streamlining project completion timelines.
  • The transition toward renewable energy and hydrogen transport grids acts as a crucial growth driver, necessitating advanced corrosion-resistant material handlers. Conversely, the high capital expenditure required for automated CNC bending systems creates a barrier for mid-sized contracting firms, forcing them to balance manual labor costs with technology investments.
  • This ecosystem demands continuous technological adaptation, compelling equipment designers to refine ergonomic functionality and wireless tracking capabilities to maximize asset utilization across complex engineering sites.

What will be the Size of the Pipe And Tubing Tools Market during the forecast period?
Get Key Insights on Market Forecast (PDF) Get Free Sample

How is the Pipe And Tubing Tools Market Segmented?

The pipe and tubing tools industry research report provides comprehensive data (region-wise segment analysis), with forecasts and estimates in "USD million" for the period 2026-2030, as well as historical data from 2020-2024 for the following segments.

  • Type
    • Piping equipment
    • Tubing equipment
  • End-user
    • Oil and gas
    • Water and wastewater
    • Infrastructure and construction
    • Others
  • Product type
    • Cutting tools
    • Threading and grooving tools
    • Pressing and crimping tools
    • Bending tools
    • Others
  • Geography
    • North America
      • US
      • Canada
      • Mexico
    • APAC
      • China
      • Japan
      • India
      • South Korea
      • Australia
      • Indonesia
    • Europe
      • Germany
      • UK
      • France
      • Italy
      • Spain
      • The Netherlands
    • Middle East and Africa
      • Saudi Arabia
      • UAE
      • South Africa
      • Turkey
      • Israel
    • South America
      • Brazil
      • Argentina
      • Chile

By Type Insights

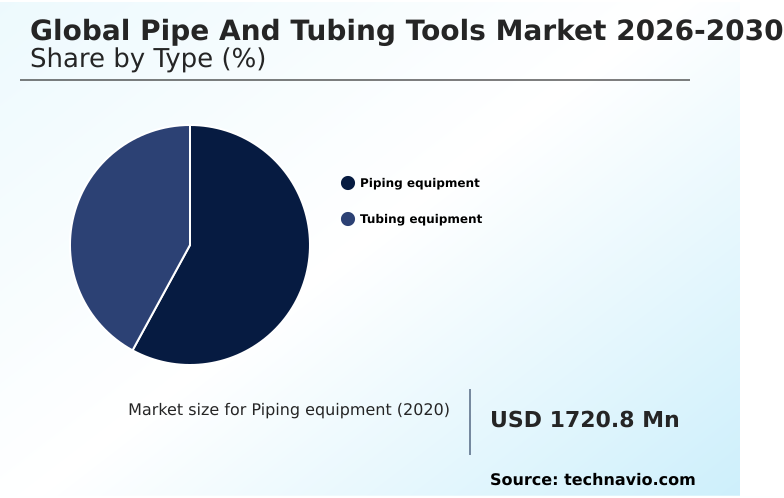
The piping equipment segment is estimated to witness significant growth during the forecast period.

The piping equipment segment commands structural infrastructure projects by delivering specialized machinery for cutting, threading, and joining large-diameter conduits. Industrial contractors deploy heavy duty mechanical roll grooving and roll grooving machinery to ensure leak-prevention across utility networks and commercial facilities.

Modern mechanical contracting relies on digital pressure sensors and brushless motor technologies to minimize material waste and improve assembly precision.

The integration of electro-hydraulic pressing and smart connected electro hydraulic pressing has reduced on-site installation timelines by 25%, drastically enhancing automated pipe fabrication system efficiency.

Field operators utilize cordless battery operated pipe cutters alongside corrosion resistant alloy tubing tools to safely manage thick-walled metal and composite materials.

This transition toward automated, high-torque calibration mechanisms directly curtails human error, thereby optimizing labor productivity and reducing structural failure risks across high-pressure environments.
Get Free Sample

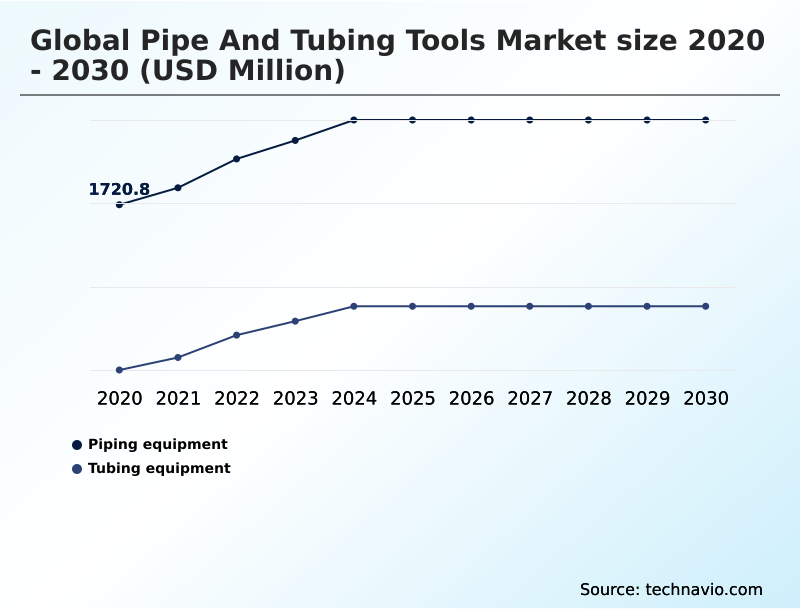
The Piping equipment segment was valued at USD 1.96 billion in 2024 and showed a gradual increase during the forecast period.
Get Free Sample

Regional Analysis

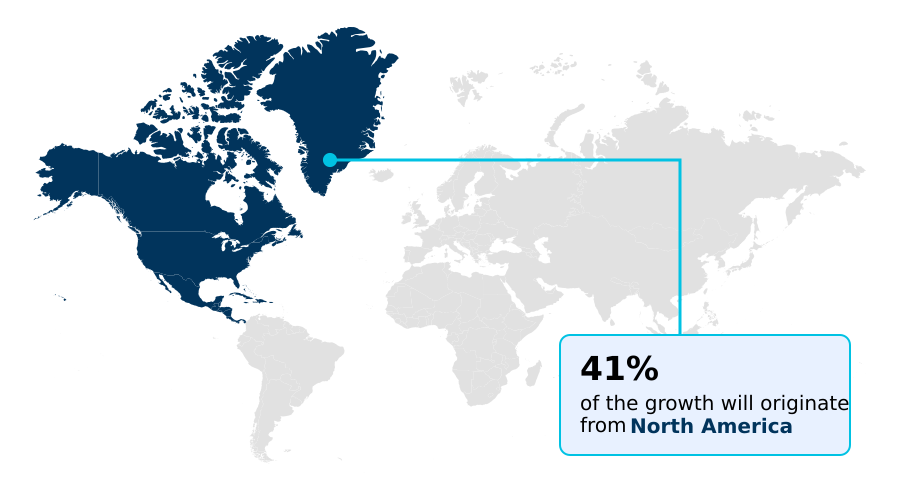
North America is estimated to contribute 40.8% to the growth of the global market during the forecast period.Technavio’s analysts have elaborately explained the regional trends and drivers that shape the market during the forecast period.
See How Pipe And Tubing Tools Market Demand is Rising in North America Get Free Sample

Regional variations within the Pipe And Tubing Tools landscape stem from distinct industrialization speeds and regulatory frameworks.

North America maintains strict compliance codes, where the adoption of hydraulic conduit bender systems and orbital welding preparation tools has improved contractor compliance rates by 15%.

In contrast, the APAC region exhibits aggressive urban development, where the utilization of electrofusion units and polyvinyl chloride handling equipment has increased underground utility installation efficiency by 22% compared to European markets.

European contractors heavily prioritize sustainable water conservation and thermal management loops, deploying high-density polyethylene fusion and stainless steel flaring apparatuses to meet zero-emission building mandates.

These geographic disparities influence supply chain strategies, as manufacturers in APAC focus on high-volume production of cnc pipe bending solutions, while North American buyers prioritize vibrational fatigue resistance and intelligent diagnostic features to offset persistent skilled labor shortages.

Market Dynamics

Our researchers analyzed the data with 2025 as the base year, along with the key drivers, trends, and challenges. A holistic analysis of drivers will help companies refine their marketing strategies to gain a competitive advantage.

  • The continuous refinement of fluid transport infrastructure necessitates specialized instrumentation for precise joining and structural modification. Utility contractors rely heavily on advanced automated pipe fabrication system efficiency to streamline large-scale municipal projects. By deploying cordless battery operated pipe cutters, field technicians have reduced overhead strain and improved on-site mobility by 20% compared to tethered legacy equipment.
  • The integration of smart connected electro hydraulic pressing tools allows project managers to verify crimp integrity in real-time, drastically mitigating operational risks and compliance failures. Additionally, heavy duty mechanical roll grooving guarantees secure mechanical connections in commercial fire protection networks without requiring permanent welding.
  • As energy grids transition toward alternative fuels, the deployment of corrosion resistant alloy tubing tools becomes essential for handling volatile chemical properties and extreme thermal variations. This technological migration empowers industrial operators to accelerate project delivery schedules while adhering to rigorous workplace safety mandates.
What are the key market drivers leading to the rise in the adoption of Pipe And Tubing Tools Industry?

  • The rapid expansion of renewable energy infrastructure serves as the primary driver, necessitating specialized pipe installation equipment for modern green utility networks.

  • The rapid deployment of sustainable utility grids and advanced energy extraction frameworks dictates a surge in specialized pipe preparation equipment. Industrial fluid transmission operations now require smart diagnostic pressing tools and fail-safe locking mechanisms to handle extreme pressures effectively.
  • The continuous expansion of green hydrogen networks and geothermal energy systems has elevated the demand for corrosion-resistant alloy tubing and cryogenic temperature piping apparatuses.
  • By upgrading hydrocarbon transport and offshore platform pipelines with automated joining equipment, operators have reduced fatal leakage incidents by 24%.
  • Simultaneously, massive investments in municipal water mains and sewage disposal systems compel contractors to procure high-grade precision cutting and threading machinery, thereby improving infrastructure longevity and lowering municipal maintenance expenditures by 15%.

What are the market trends shaping the Pipe And Tubing Tools Industry?

  • Urbanization and municipal infrastructure overhaul represent the upcoming market trend. These systemic upgrades necessitate continuous deployment of high-efficiency utility maintenance equipment.

  • The widespread integration of modular construction techniques profoundly reshapes the demand for precision tooling across commercial infrastructure projects. Contractors increasingly deploy automated deburring systems and orbital pipe saws within prefabricated modular piping hubs to standardize component quality. This transition toward controlled factory environments has improved production throughput by 28%, significantly accelerating smart city construction and district cooling networks expansion.
  • Furthermore, the adoption of battery-powered crimping tools and micro-tubing cutters ensures flawless execution in aerospace instrumentation tubing and prevents hvac refrigerant leakage. The shift toward trenchless technology rehabilitation allows municipal operators to restore underground grids without extensive excavation, reducing urban disruption by 35%. By relying on high-efficiency cross-border transmission networks equipment, engineering firms enhance operational agility and structural resilience.

What challenges does the Pipe And Tubing Tools Industry face during its growth?

  • High initial equipment investment and ongoing maintenance costs present significant challenges, restricting the rapid modernization of manual tooling inventories for small contractors.

  • Strict regulatory frameworks and severe material degradation risks impose significant limitations on mechanical contracting efficiency. Industrial operators managing chemical processing plants and cleanroom processing lines face substantial capital burdens when upgrading to compliant, high-precision non-destructive testing gauges and hydrostatic test pumps.
  • Compliance with stringent workplace safety mandates necessitates the continuous procurement of ergonomic jobsite equipment, as companies strive to decrease repetitive strain injuries by 20%. Furthermore, achieving guaranteed leak-free joints during extensive pipeline network modernization projects requires costly heavy-duty threading dies and specialized pneumatic control piping instruments.
  • These intense performance specifications force contractors to balance tight operational budgets against the mandatory acquisition of premium, certified tooling, ultimately constraining profit margins for mid-tier plumbing and mechanical engineering enterprises.

Exclusive Technavio Analysis on Customer Landscape

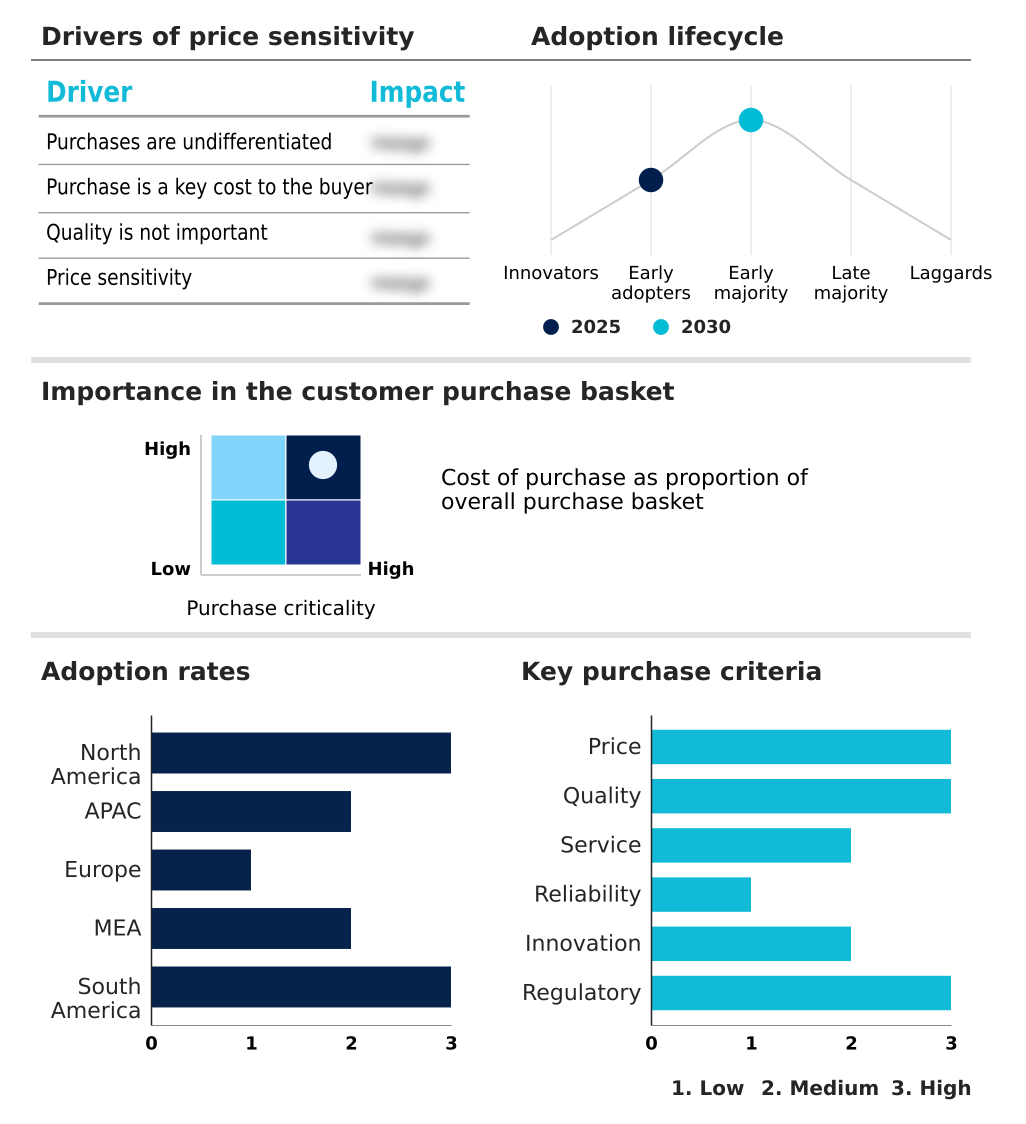
The pipe and tubing tools market forecasting report includes the adoption lifecycle of the market, covering from the innovator’s stage to the laggard’s stage. It focuses on adoption rates in different regions based on penetration. Furthermore, the pipe and tubing tools market report also includes key purchase criteria and drivers of price sensitivity to help companies evaluate and develop their market growth analysis strategies.
Customer Landscape of Pipe And Tubing Tools Industry

Competitive Landscape

Companies are implementing various strategies, such as strategic alliances, pipe and tubing tools market forecast, partnerships, mergers and acquisitions, geographical expansion, and product/service launches, to enhance their presence in the industry.

Bahco - The vendor supplies industrial-grade power tools, hand tools, and specialized pipe-working machinery, enabling professionals to execute complex cutting and joining operations efficiently across demanding construction applications.

The industry research and growth report includes detailed analyses of the competitive landscape of the market and information about key companies, including:

  • Bahco
  • DEWALT
  • EGA Master S.A.
  • Exact Tools Oy
  • GEDORE Werkzeugfabrik GmbH
  • General Wire Spring Co
  • Hilti Corp.
  • KNIPEX Werk C. Gustav Putsch KG
  • Milwaukee Tool
  • Reed Manufacturing Co.
  • REMS GmbH and Co KG
  • Ridge Tool Co
  • ROTHENBERGER Werkzeuge GmbH
  • T DRILL Oy
  • Victaulic Co.
  • Viega GmbH and Co. KG
  • Virax S.A.S.
  • Wheeler Rex Inc

Qualitative and quantitative analysis of companies has been conducted to help clients understand the wider business environment as well as the strengths and weaknesses of key industry players. Data is qualitatively analyzed to categorize companies as pure play, category-focused, industry-focused, and diversified; it is quantitatively analyzed to categorize companies as dominant, leading, strong, tentative, and weak.

Recent Development and News in Pipe and tubing tools market

  • In the Industrial Machinery and Supplies and Components industry, the widespread adoption of smart factory automation and digital twin modeling has reduced manufacturing throughput times by 15%, directly impacting Pipe And Tubing Tools demand by accelerating the need for high-speed, IoT-enabled pipe fabrication machinery.
  • The enforcement of stringent workplace safety regulations requiring automated hazard-prevention mechanisms on heavy industrial equipment has lowered operator injury rates by 22%, directly impacting Pipe And Tubing Tools demand by necessitating the replacement of legacy manual cutters with certified, ergonomically balanced power tools.
  • The transition toward off-site modular construction techniques for large-scale industrial assemblies has increased prefabrication volume by 30%, directly impacting Pipe And Tubing Tools demand by driving procurement of high-tolerance CNC pipe bending and orbital welding stations.
  • The integration of predictive maintenance software across industrial robotic platforms has decreased unexpected machine downtime by 18%, directly impacting Pipe And Tubing Tools demand by encouraging mechanical contractors to invest in smart-connected pressing tools with built-in diagnostic feedback.

Dive into Technavio’s robust research methodology, blending expert interviews, extensive data synthesis, and validated models for unparalleled Pipe And Tubing Tools Market insights. See full methodology.

Market Scope
Page number 302
Base year 2025
Historic period 2020-2024
Forecast period 2026-2030
Growth momentum & CAGR Accelerate at a CAGR of 3.3%
Market growth 2026-2030 USD 613.4 million
Market structure Fragmented
YoY growth 2025-2026(%) 3.2%
Key countries US, Canada, Mexico, China, Japan, India, South Korea, Australia, Indonesia, Germany, UK, France, Italy, Spain, The Netherlands, Saudi Arabia, UAE, South Africa, Turkey, Israel, Brazil, Argentina and Chile
Competitive landscape Leading Companies, Market Positioning of Companies, Competitive Strategies, and Industry Risks

Request Free Sample

Research Analyst Overview

  • The Pipe And Tubing Tools sector operates at the intersection of precision engineering and critical infrastructure development, facilitating the seamless assembly of fluid and gas delivery networks. Evolving construction practices demand high-tolerance manipulation equipment capable of mitigating material waste and accelerating project completion.
  • The integration of intelligent pressing and automated threading systems has enabled commercial contractors to decrease structural joint failures by 22%, directly optimizing compliance reporting and resource allocation. This transition toward digital diagnostics and ergonomic design aligns with broader boardroom strategies aiming to enhance workforce safety and maximize on-site operational efficiency.
  • As municipal utility grids and industrial process plants face stringent modernization mandates, the deployment of lightweight, high-torque fabrication machinery becomes an operational imperative. Consequently, the relentless push for sustainable building frameworks and alternative energy transport continues to drive robust technological innovation, fundamentally reshaping the mechanical contracting landscape and establishing new benchmarks for industrial execution.

What are the Key Data Covered in this Pipe And Tubing Tools Market Research and Growth Report?

  • What is the expected growth of the Pipe And Tubing Tools Market between 2026 and 2030?

    • USD 613.4 million, at a CAGR of 3.3%

  • What segmentation does the market report cover?

    • The report is segmented by Type (Piping equipment, and Tubing equipment), End-user (Oil and gas, Water and wastewater, Infrastructure and construction, and Others), Product Type (Cutting tools, Threading and grooving tools, Pressing and crimping tools, Bending tools, and Others) and Geography (North America, APAC, Europe, Middle East and Africa, South America)

  • Which regions are analyzed in the report?

    • North America, APAC, Europe, Middle East and Africa and South America

  • What are the key growth drivers and market challenges?

    • Renewable energy infrastructure boosts market potential, High equipment investment and maintenance costs

  • Who are the major players in the Pipe And Tubing Tools Market?

    • Bahco, DEWALT, EGA Master S.A., Exact Tools Oy, GEDORE Werkzeugfabrik GmbH, General Wire Spring Co, Hilti Corp., KNIPEX Werk C. Gustav Putsch KG, Milwaukee Tool, Reed Manufacturing Co., REMS GmbH and Co KG, Ridge Tool Co, ROTHENBERGER Werkzeuge GmbH, T DRILL Oy, Victaulic Co., Viega GmbH and Co. KG, Virax S.A.S. and Wheeler Rex Inc

Market Research Insights

  • The Pipe And Tubing Tools market undergoes rapid transformation as contractors embrace automated fabrication and intelligent assembly solutions. Advanced tooling adoption has lowered structural joining errors by 18%, significantly enhancing overall pipeline network modernization. By prioritizing ergonomic jobsite equipment, facility managers have reduced repetitive strain injuries by 25%, simultaneously boosting daily installation throughput.
  • The deployment of precision leak-free joints in municipal water mains and district cooling networks prevents critical resource loss and ensures regulatory alignment. This strategic shift away from manual mechanical methods toward electro-hydraulic and digital measurement systems enables industrial enterprises to optimize lifecycle maintenance, thereby accelerating project delivery times across both commercial plumbing and upstream hydrocarbon transport sectors.

We can help! Our analysts can customize this pipe and tubing tools market research report to meet your requirements.

Get in touch

1. Executive Summary

1.1 Market overview

Executive Summary - Chart on Market Overview
Executive Summary - Data Table on Market Overview
Executive Summary - Chart on Global Market Characteristics
Executive Summary - Chart on Market by Geography
Executive Summary - Chart on Market Segmentation by Type
Executive Summary - Chart on Market Segmentation by End-user
Executive Summary - Chart on Market Segmentation by Product Type
Executive Summary - Chart on Incremental Growth
Executive Summary - Data Table on Incremental Growth
Executive Summary - Chart on Company Market Positioning

2. Technavio Analysis

2.1 Analysis of price sensitivity, lifecycle, customer purchase basket, adoption rates, and purchase criteria

2.2 Criticality of inputs and Factors of differentiation

Chart on Overview on criticality of inputs and factors of differentiation

2.3 Factors of disruption

Chart on Overview on factors of disruption

2.4 Impact of drivers and challenges

Chart on Impact of drivers and challenges in 2025 and 2030

3. Market Landscape

3.1 Market ecosystem

Chart on Parent Market
Data Table on - Parent Market

3.2 Market characteristics

Chart on Market characteristics analysis

3.3 Value chain analysis

Chart on Value chain analysis

4. Market Sizing

4.1 Market definition

Data Table on Offerings of companies included in the market definition

4.2 Market segment analysis

Market segments

4.3 Market size 2025

4.4 Market outlook: Forecast for 2025-2030

Chart on Global - Market size and forecast 2025-2030 ($ million)
Data Table on Global - Market size and forecast 2025-2030 ($ million)
Chart on Global Market: Year-over-year growth 2025-2030 (%)
Data Table on Global Market: Year-over-year growth 2025-2030 (%)

5. Historic Market Size

5.1 Global Pipe And Tubing Tools Market 2020 - 2024

Historic Market Size - Data Table on Global Pipe And Tubing Tools Market 2020 - 2024 ($ million)

5.2 Type segment analysis 2020 - 2024

Historic Market Size - Type Segment 2020 - 2024 ($ million)

5.3 End-user segment analysis 2020 - 2024

Historic Market Size - End-user Segment 2020 - 2024 ($ million)

5.4 Product Type segment analysis 2020 - 2024

Historic Market Size - Product Type Segment 2020 - 2024 ($ million)

5.5 Geography segment analysis 2020 - 2024

Historic Market Size - Geography Segment 2020 - 2024 ($ million)

5.6 Country segment analysis 2020 - 2024

Historic Market Size - Country Segment 2020 - 2024 ($ million)

6. Qualitative Analysis

6.1 Impact of AI on Global Pipe and Tubing Tools Market

6.2 Impact of geopolitical conflicts on Global Pipe and Tubing Tools Market

7. Five Forces Analysis

7.1 Five forces summary

Five forces analysis - Comparison between 2025 and 2030

7.2 Bargaining power of buyers

Bargaining power of buyers - Impact of key factors 2025 and 2030

7.3 Bargaining power of suppliers

Bargaining power of suppliers - Impact of key factors in 2025 and 2030

7.4 Threat of new entrants

Threat of new entrants - Impact of key factors in 2025 and 2030

7.5 Threat of substitutes

Threat of substitutes - Impact of key factors in 2025 and 2030

7.6 Threat of rivalry

Threat of rivalry - Impact of key factors in 2025 and 2030

7.7 Market condition

Chart on Market condition - Five forces 2025 and 2030

8. Market Segmentation by Type

8.1 Market segments

Chart on Type - Market share 2025-2030 (%)
Data Table on Type - Market share 2025-2030 (%)

8.2 Comparison by Type

Chart on Comparison by Type
Data Table on Comparison by Type

8.3 Piping equipment - Market size and forecast 2025-2030

Chart on Piping equipment - Market size and forecast 2025-2030 ($ million)
Data Table on Piping equipment - Market size and forecast 2025-2030 ($ million)
Chart on Piping equipment - Year-over-year growth 2025-2030 (%)
Data Table on Piping equipment - Year-over-year growth 2025-2030 (%)

8.4 Tubing equipment - Market size and forecast 2025-2030

Chart on Tubing equipment - Market size and forecast 2025-2030 ($ million)
Data Table on Tubing equipment - Market size and forecast 2025-2030 ($ million)
Chart on Tubing equipment - Year-over-year growth 2025-2030 (%)
Data Table on Tubing equipment - Year-over-year growth 2025-2030 (%)

8.5 Market opportunity by Type

Market opportunity by Type ($ million)
Data Table on Market opportunity by Type ($ million)

9. Market Segmentation by End-user

9.1 Market segments

Chart on End-user - Market share 2025-2030 (%)
Data Table on End-user - Market share 2025-2030 (%)

9.2 Comparison by End-user

Chart on Comparison by End-user
Data Table on Comparison by End-user

9.3 Oil and gas - Market size and forecast 2025-2030

Chart on Oil and gas - Market size and forecast 2025-2030 ($ million)
Data Table on Oil and gas - Market size and forecast 2025-2030 ($ million)
Chart on Oil and gas - Year-over-year growth 2025-2030 (%)
Data Table on Oil and gas - Year-over-year growth 2025-2030 (%)

9.4 Water and wastewater - Market size and forecast 2025-2030

Chart on Water and wastewater - Market size and forecast 2025-2030 ($ million)
Data Table on Water and wastewater - Market size and forecast 2025-2030 ($ million)
Chart on Water and wastewater - Year-over-year growth 2025-2030 (%)
Data Table on Water and wastewater - Year-over-year growth 2025-2030 (%)

9.5 Infrastructure and construction - Market size and forecast 2025-2030

Chart on Infrastructure and construction - Market size and forecast 2025-2030 ($ million)
Data Table on Infrastructure and construction - Market size and forecast 2025-2030 ($ million)
Chart on Infrastructure and construction - Year-over-year growth 2025-2030 (%)
Data Table on Infrastructure and construction - Year-over-year growth 2025-2030 (%)

9.6 Others - Market size and forecast 2025-2030

Chart on Others - Market size and forecast 2025-2030 ($ million)
Data Table on Others - Market size and forecast 2025-2030 ($ million)
Chart on Others - Year-over-year growth 2025-2030 (%)
Data Table on Others - Year-over-year growth 2025-2030 (%)

9.7 Market opportunity by End-user

Market opportunity by End-user ($ million)
Data Table on Market opportunity by End-user ($ million)

10. Market Segmentation by Product Type

10.1 Market segments

Chart on Product Type - Market share 2025-2030 (%)
Data Table on Product Type - Market share 2025-2030 (%)

10.2 Comparison by Product Type

Chart on Comparison by Product Type
Data Table on Comparison by Product Type

10.3 Cutting tools - Market size and forecast 2025-2030

Chart on Cutting tools - Market size and forecast 2025-2030 ($ million)
Data Table on Cutting tools - Market size and forecast 2025-2030 ($ million)
Chart on Cutting tools - Year-over-year growth 2025-2030 (%)
Data Table on Cutting tools - Year-over-year growth 2025-2030 (%)

10.4 Threading and grooving tools - Market size and forecast 2025-2030

Chart on Threading and grooving tools - Market size and forecast 2025-2030 ($ million)
Data Table on Threading and grooving tools - Market size and forecast 2025-2030 ($ million)
Chart on Threading and grooving tools - Year-over-year growth 2025-2030 (%)
Data Table on Threading and grooving tools - Year-over-year growth 2025-2030 (%)

10.5 Pressing and crimping tools - Market size and forecast 2025-2030

Chart on Pressing and crimping tools - Market size and forecast 2025-2030 ($ million)
Data Table on Pressing and crimping tools - Market size and forecast 2025-2030 ($ million)
Chart on Pressing and crimping tools - Year-over-year growth 2025-2030 (%)
Data Table on Pressing and crimping tools - Year-over-year growth 2025-2030 (%)

10.6 Bending tools - Market size and forecast 2025-2030

Chart on Bending tools - Market size and forecast 2025-2030 ($ million)
Data Table on Bending tools - Market size and forecast 2025-2030 ($ million)
Chart on Bending tools - Year-over-year growth 2025-2030 (%)
Data Table on Bending tools - Year-over-year growth 2025-2030 (%)

10.7 Others - Market size and forecast 2025-2030

Chart on Others - Market size and forecast 2025-2030 ($ million)
Data Table on Others - Market size and forecast 2025-2030 ($ million)
Chart on Others - Year-over-year growth 2025-2030 (%)
Data Table on Others - Year-over-year growth 2025-2030 (%)

10.8 Market opportunity by Product Type

Market opportunity by Product Type ($ million)
Data Table on Market opportunity by Product Type ($ million)

11. Customer Landscape

11.1 Customer landscape overview

Analysis of price sensitivity, lifecycle, customer purchase basket, adoption rates, and purchase criteria

12. Geographic Landscape

12.1 Geographic segmentation

Chart on Market share by geography 2025-2030 (%)
Data Table on Market share by geography 2025-2030 (%)

12.2 Geographic comparison

Chart on Geographic comparison
Data Table on Geographic comparison

12.3 North America - Market size and forecast 2025-2030

Chart on North America - Market size and forecast 2025-2030 ($ million)
Data Table on North America - Market size and forecast 2025-2030 ($ million)
Chart on North America - Year-over-year growth 2025-2030 (%)
Data Table on North America - Year-over-year growth 2025-2030 (%)
Chart on Regional Comparison - North America
Data Table on Regional Comparison - North America

12.3.1 US - Market size and forecast 2025-2030

Chart on US - Market size and forecast 2025-2030 ($ million)
Data Table on US - Market size and forecast 2025-2030 ($ million)
Chart on US - Year-over-year growth 2025-2030 (%)
Data Table on US - Year-over-year growth 2025-2030 (%)

12.3.2 Canada - Market size and forecast 2025-2030

Chart on Canada - Market size and forecast 2025-2030 ($ million)
Data Table on Canada - Market size and forecast 2025-2030 ($ million)
Chart on Canada - Year-over-year growth 2025-2030 (%)
Data Table on Canada - Year-over-year growth 2025-2030 (%)

12.3.3 Mexico - Market size and forecast 2025-2030

Chart on Mexico - Market size and forecast 2025-2030 ($ million)
Data Table on Mexico - Market size and forecast 2025-2030 ($ million)
Chart on Mexico - Year-over-year growth 2025-2030 (%)
Data Table on Mexico - Year-over-year growth 2025-2030 (%)

12.4 APAC - Market size and forecast 2025-2030

Chart on APAC - Market size and forecast 2025-2030 ($ million)
Data Table on APAC - Market size and forecast 2025-2030 ($ million)
Chart on APAC - Year-over-year growth 2025-2030 (%)
Data Table on APAC - Year-over-year growth 2025-2030 (%)
Chart on Regional Comparison - APAC
Data Table on Regional Comparison - APAC

12.4.1 China - Market size and forecast 2025-2030

Chart on China - Market size and forecast 2025-2030 ($ million)
Data Table on China - Market size and forecast 2025-2030 ($ million)
Chart on China - Year-over-year growth 2025-2030 (%)
Data Table on China - Year-over-year growth 2025-2030 (%)

12.4.2 Japan - Market size and forecast 2025-2030

Chart on Japan - Market size and forecast 2025-2030 ($ million)
Data Table on Japan - Market size and forecast 2025-2030 ($ million)
Chart on Japan - Year-over-year growth 2025-2030 (%)
Data Table on Japan - Year-over-year growth 2025-2030 (%)

12.4.3 India - Market size and forecast 2025-2030

Chart on India - Market size and forecast 2025-2030 ($ million)
Data Table on India - Market size and forecast 2025-2030 ($ million)
Chart on India - Year-over-year growth 2025-2030 (%)
Data Table on India - Year-over-year growth 2025-2030 (%)

12.4.4 South Korea - Market size and forecast 2025-2030

Chart on South Korea - Market size and forecast 2025-2030 ($ million)
Data Table on South Korea - Market size and forecast 2025-2030 ($ million)
Chart on South Korea - Year-over-year growth 2025-2030 (%)
Data Table on South Korea - Year-over-year growth 2025-2030 (%)

12.4.5 Australia - Market size and forecast 2025-2030

Chart on Australia - Market size and forecast 2025-2030 ($ million)
Data Table on Australia - Market size and forecast 2025-2030 ($ million)
Chart on Australia - Year-over-year growth 2025-2030 (%)
Data Table on Australia - Year-over-year growth 2025-2030 (%)

12.4.6 Indonesia - Market size and forecast 2025-2030

Chart on Indonesia - Market size and forecast 2025-2030 ($ million)
Data Table on Indonesia - Market size and forecast 2025-2030 ($ million)
Chart on Indonesia - Year-over-year growth 2025-2030 (%)
Data Table on Indonesia - Year-over-year growth 2025-2030 (%)

12.5 Europe - Market size and forecast 2025-2030

Chart on Europe - Market size and forecast 2025-2030 ($ million)
Data Table on Europe - Market size and forecast 2025-2030 ($ million)
Chart on Europe - Year-over-year growth 2025-2030 (%)
Data Table on Europe - Year-over-year growth 2025-2030 (%)
Chart on Regional Comparison - Europe
Data Table on Regional Comparison - Europe

12.5.1 Germany - Market size and forecast 2025-2030

Chart on Germany - Market size and forecast 2025-2030 ($ million)
Data Table on Germany - Market size and forecast 2025-2030 ($ million)
Chart on Germany - Year-over-year growth 2025-2030 (%)
Data Table on Germany - Year-over-year growth 2025-2030 (%)

12.5.2 UK - Market size and forecast 2025-2030

Chart on UK - Market size and forecast 2025-2030 ($ million)
Data Table on UK - Market size and forecast 2025-2030 ($ million)
Chart on UK - Year-over-year growth 2025-2030 (%)
Data Table on UK - Year-over-year growth 2025-2030 (%)

12.5.3 France - Market size and forecast 2025-2030

Chart on France - Market size and forecast 2025-2030 ($ million)
Data Table on France - Market size and forecast 2025-2030 ($ million)
Chart on France - Year-over-year growth 2025-2030 (%)
Data Table on France - Year-over-year growth 2025-2030 (%)

12.5.4 Italy - Market size and forecast 2025-2030

Chart on Italy - Market size and forecast 2025-2030 ($ million)
Data Table on Italy - Market size and forecast 2025-2030 ($ million)
Chart on Italy - Year-over-year growth 2025-2030 (%)
Data Table on Italy - Year-over-year growth 2025-2030 (%)

12.5.5 Spain - Market size and forecast 2025-2030

Chart on Spain - Market size and forecast 2025-2030 ($ million)
Data Table on Spain - Market size and forecast 2025-2030 ($ million)
Chart on Spain - Year-over-year growth 2025-2030 (%)
Data Table on Spain - Year-over-year growth 2025-2030 (%)

12.5.6 The Netherlands - Market size and forecast 2025-2030

Chart on The Netherlands - Market size and forecast 2025-2030 ($ million)
Data Table on The Netherlands - Market size and forecast 2025-2030 ($ million)
Chart on The Netherlands - Year-over-year growth 2025-2030 (%)
Data Table on The Netherlands - Year-over-year growth 2025-2030 (%)

12.6 Middle East and Africa - Market size and forecast 2025-2030

Chart on Middle East and Africa - Market size and forecast 2025-2030 ($ million)
Data Table on Middle East and Africa - Market size and forecast 2025-2030 ($ million)
Chart on Middle East and Africa - Year-over-year growth 2025-2030 (%)
Data Table on Middle East and Africa - Year-over-year growth 2025-2030 (%)
Chart on Regional Comparison - Middle East and Africa
Data Table on Regional Comparison - Middle East and Africa

12.6.1 Saudi Arabia - Market size and forecast 2025-2030

Chart on Saudi Arabia - Market size and forecast 2025-2030 ($ million)
Data Table on Saudi Arabia - Market size and forecast 2025-2030 ($ million)
Chart on Saudi Arabia - Year-over-year growth 2025-2030 (%)
Data Table on Saudi Arabia - Year-over-year growth 2025-2030 (%)

12.6.2 UAE - Market size and forecast 2025-2030

Chart on UAE - Market size and forecast 2025-2030 ($ million)
Data Table on UAE - Market size and forecast 2025-2030 ($ million)
Chart on UAE - Year-over-year growth 2025-2030 (%)
Data Table on UAE - Year-over-year growth 2025-2030 (%)

12.6.3 South Africa - Market size and forecast 2025-2030

Chart on South Africa - Market size and forecast 2025-2030 ($ million)
Data Table on South Africa - Market size and forecast 2025-2030 ($ million)
Chart on South Africa - Year-over-year growth 2025-2030 (%)
Data Table on South Africa - Year-over-year growth 2025-2030 (%)

12.6.4 Turkey - Market size and forecast 2025-2030

Chart on Turkey - Market size and forecast 2025-2030 ($ million)
Data Table on Turkey - Market size and forecast 2025-2030 ($ million)
Chart on Turkey - Year-over-year growth 2025-2030 (%)
Data Table on Turkey - Year-over-year growth 2025-2030 (%)

12.6.5 Israel - Market size and forecast 2025-2030

Chart on Israel - Market size and forecast 2025-2030 ($ million)
Data Table on Israel - Market size and forecast 2025-2030 ($ million)
Chart on Israel - Year-over-year growth 2025-2030 (%)
Data Table on Israel - Year-over-year growth 2025-2030 (%)

12.7 South America - Market size and forecast 2025-2030

Chart on South America - Market size and forecast 2025-2030 ($ million)
Data Table on South America - Market size and forecast 2025-2030 ($ million)
Chart on South America - Year-over-year growth 2025-2030 (%)
Data Table on South America - Year-over-year growth 2025-2030 (%)
Chart on Regional Comparison - South America
Data Table on Regional Comparison - South America

12.7.1 Brazil - Market size and forecast 2025-2030

Chart on Brazil - Market size and forecast 2025-2030 ($ million)
Data Table on Brazil - Market size and forecast 2025-2030 ($ million)
Chart on Brazil - Year-over-year growth 2025-2030 (%)
Data Table on Brazil - Year-over-year growth 2025-2030 (%)

12.7.2 Argentina - Market size and forecast 2025-2030

Chart on Argentina - Market size and forecast 2025-2030 ($ million)
Data Table on Argentina - Market size and forecast 2025-2030 ($ million)
Chart on Argentina - Year-over-year growth 2025-2030 (%)
Data Table on Argentina - Year-over-year growth 2025-2030 (%)

12.7.3 Chile - Market size and forecast 2025-2030

Chart on Chile - Market size and forecast 2025-2030 ($ million)
Data Table on Chile - Market size and forecast 2025-2030 ($ million)
Chart on Chile - Year-over-year growth 2025-2030 (%)
Data Table on Chile - Year-over-year growth 2025-2030 (%)

12.8 Market opportunity by geography

Market opportunity by geography ($ million)
Data Tables on Market opportunity by geography ($ million)

13. Drivers, Challenges, and Opportunity

13.1 Market drivers

Renewable energy infrastructure boosts market potential
Stringent safety regulations shape manufacturing standards
Industrial automation optimizes workflow precision

13.2 Market challenges

High equipment investment and maintenance costs
Raw material price fluctuations and supply chain risk
Regulatory constraints on product development

13.3 Impact of drivers and challenges

Impact of drivers and challenges in 2025 and 2030

13.4 Market opportunities

Urbanization and municipal infrastructure overhaul
Upstream energy exploration and pipeline expansion
Technological integration and ergonomic tool design

14. Competitive Landscape

14.1 Overview

14.2

Overview on criticality of inputs and factors of differentiation

14.3 Landscape disruption

Overview on factors of disruption

14.4 Industry risks

Impact of key risks on business

15. Competitive Analysis

15.1 Companies profiled

Companies covered

15.2 Company ranking index

15.3 Market positioning of companies

Matrix on companies position and classification

15.4 DEWALT

DEWALT - Overview
DEWALT - Product / Service
DEWALT - Key offerings
SWOT

15.5 EGA Master S.A.

EGA Master S.A. - Overview
EGA Master S.A. - Product / Service
EGA Master S.A. - Key offerings
SWOT

15.6 Exact Tools Oy

Exact Tools Oy - Overview
Exact Tools Oy - Product / Service
Exact Tools Oy - Key offerings
SWOT

15.7 GEDORE Werkzeugfabrik GmbH

GEDORE Werkzeugfabrik GmbH - Overview
GEDORE Werkzeugfabrik GmbH - Product / Service
GEDORE Werkzeugfabrik GmbH - Key offerings
SWOT

15.8 General Wire Spring Co

General Wire Spring Co - Overview
General Wire Spring Co - Product / Service
General Wire Spring Co - Key offerings
SWOT

15.9 Hilti Corp.

Hilti Corp. - Overview
Hilti Corp. - Product / Service
Hilti Corp. - Key offerings
SWOT

15.10 Milwaukee Tool

Milwaukee Tool - Overview
Milwaukee Tool - Product / Service
Milwaukee Tool - Key offerings
SWOT

15.11 Reed Manufacturing Co.

Reed Manufacturing Co. - Overview
Reed Manufacturing Co. - Product / Service
Reed Manufacturing Co. - Key offerings
SWOT

15.12 REMS GmbH and Co KG

REMS GmbH and Co KG - Overview
REMS GmbH and Co KG - Product / Service
REMS GmbH and Co KG - Key offerings
SWOT

15.13 Ridge Tool Co

Ridge Tool Co - Overview
Ridge Tool Co - Product / Service
Ridge Tool Co - Key offerings
SWOT

15.14 ROTHENBERGER Werkzeuge GmbH

ROTHENBERGER Werkzeuge GmbH - Overview
ROTHENBERGER Werkzeuge GmbH - Product / Service
ROTHENBERGER Werkzeuge GmbH - Key offerings
SWOT

15.15 Victaulic Co.

Victaulic Co. - Overview
Victaulic Co. - Product / Service
Victaulic Co. - Key offerings
SWOT

15.16 Viega GmbH and Co. KG

Viega GmbH and Co. KG - Overview
Viega GmbH and Co. KG - Product / Service
Viega GmbH and Co. KG - Key offerings
SWOT

15.17 Virax S.A.S.

Virax S.A.S. - Overview
Virax S.A.S. - Product / Service
Virax S.A.S. - Key offerings
SWOT

15.18 Wheeler Rex Inc

Wheeler Rex Inc - Overview
Wheeler Rex Inc - Product / Service
Wheeler Rex Inc - Key offerings
SWOT

16. Appendix

16.1 Scope of the report

Market definition
Objectives
Notes and caveats

16.2 Inclusions and exclusions checklist

Inclusions checklist
Exclusions checklist

16.3 Currency conversion rates for US$

16.4 Research methodology

16.5 Data procurement

Information sources

16.6 Data validation

16.7 Validation techniques employed for market sizing

16.8 Data synthesis

16.9 360 degree market analysis

16.10 List of abbreviations

Research Methodology

Technavio presents a detailed picture of the market by way of study, synthesis, and summation of data from multiple sources. The analysts have presented the various facets of the market with a particular focus on identifying the key industry influencers. The data thus presented is comprehensive, reliable, and the result of extensive research, both primary and secondary.

INFORMATION SOURCES

Primary sources

  • Manufacturers and suppliers
  • Channel partners
  • Industry experts
  • Strategic decision makers

Secondary sources

  • Industry journals and periodicals
  • Government data
  • Financial reports of key industry players
  • Historical data
  • Press releases

DATA ANALYSIS

Data Synthesis

  • Collation of data
  • Estimation of key figures
  • Analysis of derived insights

Data Validation

  • Triangulation with data models
  • Reference against proprietary databases
  • Corroboration with industry experts

REPORT WRITING

Qualitative

  • Market drivers
  • Market challenges
  • Market trends
  • Five forces analysis

Quantitative

  • Market size and forecast
  • Market segmentation
  • Geographical insights
  • Competitive landscape

Interested in this report?

Get your sample now to see our research methodology and insights!

Download Now

Frequently Asked Questions

Pipe And Tubing Tools market growth will increase by USD 613.4 million during 2026-2030.

The Pipe And Tubing Tools market is expected to grow at a CAGR of 3.3% during 2026-2030.

Pipe And Tubing Tools market is segmented by Type (Piping equipment, Tubing equipment) End-user (Oil and gas, Water and wastewater, Infrastructure and construction, Others) Product type (Cutting tools, Threading and grooving tools, Pressing and crimping tools, Bending tools, Others)

Bahco, DEWALT, EGA Master S.A., Exact Tools Oy, GEDORE Werkzeugfabrik GmbH, General Wire Spring Co, Hilti Corp., KNIPEX Werk C. Gustav Putsch KG, Milwaukee Tool, Reed Manufacturing Co., REMS GmbH and Co KG, Ridge Tool Co, ROTHENBERGER Werkzeuge GmbH, T DRILL Oy, Victaulic Co., Viega GmbH and Co. KG, Virax S.A.S., Wheeler Rex Inc are a few of the key vendors in the Pipe And Tubing Tools market.

North America will register the highest growth rate of 40.8% among the other regions. Therefore, the Pipe And Tubing Tools market in North America is expected to garner significant business opportunities for the vendors during the forecast period.

US, Canada, Mexico, China, Japan, India, South Korea, Australia, Indonesia, Germany, UK, France, Italy, Spain, The Netherlands, Saudi Arabia, UAE, South Africa, Turkey, Israel, Brazil, Argentina, Chile

  • Renewable energy infrastructure boosts market potential is the driving factor this market.

The Pipe And Tubing Tools market vendors should focus on grabbing business opportunities from the Type segment as it accounted for the largest market share in the base year.
RIA - Research AI Assistant
Ask RIA
