Process Instrumentation Market Analysis APAC, North America, Europe, South America, Middle East and Africa - US, Canada, China, India, UK - Size and Forecast 2024-2028

Process Instrumentation Market Analysis APAC, North America, Europe, South America, Middle East and Africa - US, Canada, China, India, UK - Size and Forecast 2024-2028

Published: Feb 2024 191 Pages SKU: IRTNTR44009

Market Overview at a Glance

$7.46 B
Market Opportunity
6.67%
CAGR
6.28
YoY growth 2023-2024(%)

Process Instrumentation Market Size 2024-2028

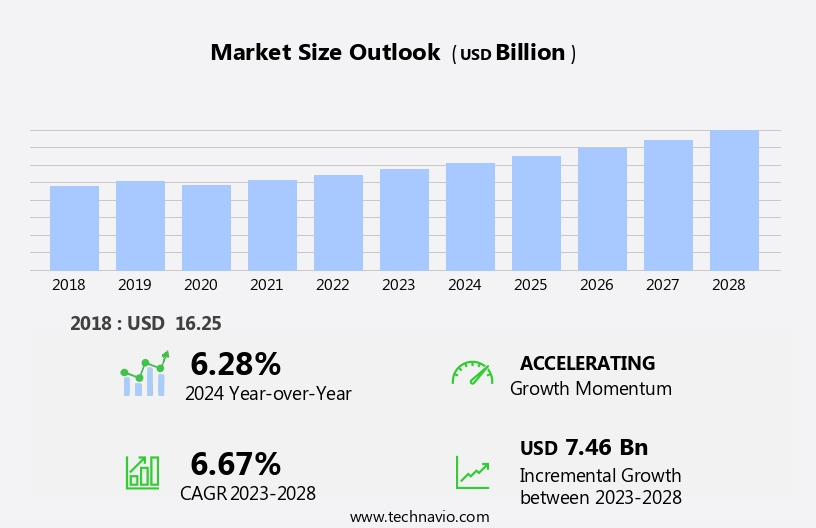
The process instrumentation market size is forecast to increase by USD 7.46 billion at a CAGR of 6.67% between 2023 and 2028.

  • The rising demand for automation in manufacturing processes is a key driver of the process instrumentation market. In line with this, the rising demand for wireless field instruments is emerging as a key trend. These instruments offer increased flexibility, ease of installation, and reduced maintenance costs, making them an attractive choice for industries seeking to optimize production efficiency. Wireless solutions also enable real-time data monitoring and analysis, enhancing operational decision-making and driving innovation in process automation.
  • The adoption of advanced technologies, such as wireless communication and the Internet of Things (IoT), is driving the market's growth. These technologies enable data analytics, leading to improved operational efficiency and productivity. However, safety concerns due to faulty instruments pose a significant challenge to market growth.

What will be the Size of the Process Instrumentation Market During the Forecast Period?

Process Instrumentation Market Size

 Request Free Sample

  • The market encompasses the supply of equipment and systems used for recording, positioning, and controlling various process parameters such as flow, pressure, level, temperature, humidity, and others in industrial applications. This market is driven by the rising trend of industrial automation, which aims to enhance asset utilization, improve product quality, ensure safety, and reduce energy consumption and emission. 
  • The increasing focus on energy efficiency and environmental impact has further fueled the demand for advanced process instrumentation solutions. However, the high initial investments and cybersecurity risks associated with these systems pose challenges for market growth. Communication protocols like Profibus PA facilitate the integration of process instrumentation equipment into industrial automation systems.
  • Ex-proof and intrinsically safe devices cater to industries with hazardous environments. Economic factors and industry-specific applications also influence the market dynamics. Competitor analysis is crucial to understanding the competitive landscape and staying abreast of the latest trends and innovations.

How is this Process Instrumentation Industry segmented and which is the largest segment?

The process instrumentation industry research report provides comprehensive data (region-wise segment analysis), with forecasts and estimates in "USD billion" for the period 2024-2028, as well as historical data from 2018-2022 for the following segments. 

  • End-user
    • Oil and gas
    • Chemical
    • Food and beverages
    • Energy and power
    • Others
  • Type
    • Field instrument
    • Control valve
    • Analyzer
  • Instrument
    • Transmitter
    • Control Valve
  • Technology
    • Programmable Logic Controller (PLC)
    • Distributed Control System (DCS)
    • Supervisory Control and Data Acquisition (SCADA)
    • Manufacturing Execution System (MES)
  • Geography
    • APAC
      • China
      • India
    • North America
      • Canada
      • US
    • Europe
      • UK
    • South America
    • Middle East and Africa

By End-user Insights

The oil and gas segment is estimated to witness significant growth during the forecast period. The market plays a pivotal role in various industries, including manufacturing, energy, and utilities, by enhancing process control systems through the use of sensors, transmitters, switches, and gauges. These instruments enable asset utilization, energy efficiency, emission reduction, and recording of data points from connected equipment. The increasing adoption of automation, labor shortages, and intelligent robotics in production processes necessitates the deployment of precise and accurate process instrumentation equipment. The importance of absolute reliability, long-term contracts, and safety in business operations drives the demand for process instrumentation solutions. Key applications include flow control valves, pressure, level, temperature, humidity, and communication protocols such as Profibus PA, Foundation Fieldbus, and HART.

The market is influenced by economic factors, digital transformation, and the Internet of Things (IoT), leading to the integration of real-time monitoring and M2M communication. Industries like power generation, mining and metals, pharmaceuticals, and agriculture and livestock benefit from process instrumentation, with significant growth expected In the chemical, food and beverages, and water availability sectors. The Energy Information Administration (IEA) and Industrial Bank of China (IBEF) report that the market is expected to grow due to increasing demand for product quality, safety, and environmental impact considerations. Competitor analysis reveals that companies offering process instrumentation solutions include Equilibar, SDO valves, OleumTech, Rising Industrial Automation, and others.

The market faces challenges such as high initial investments, cybersecurity risks, and economic factors. Despite these challenges, the market is expected to continue growing due to the increasing need for process optimization and sustainability.

Process Instrumentation Market Size

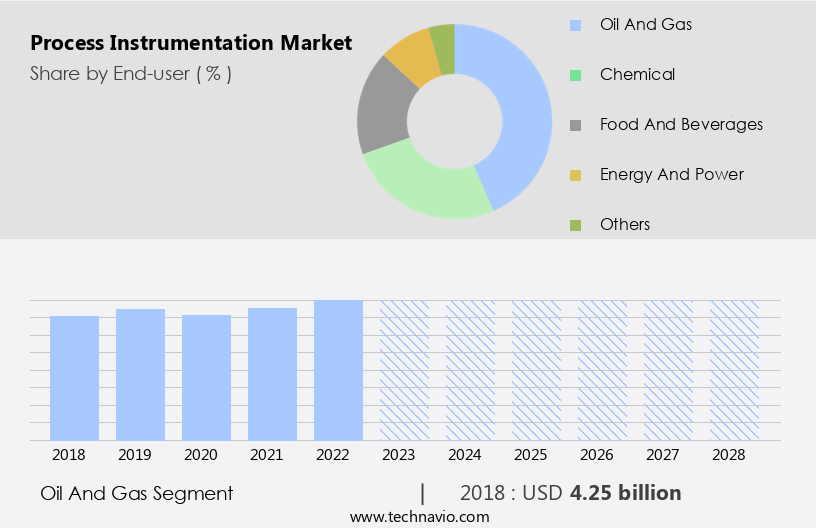
Get a glance at the share of various segments. Request Free Sample

The Oil and gas segment was valued at USD 4.25 billion in 2018 and showed a gradual increase during the forecast period.

Regional Analysis

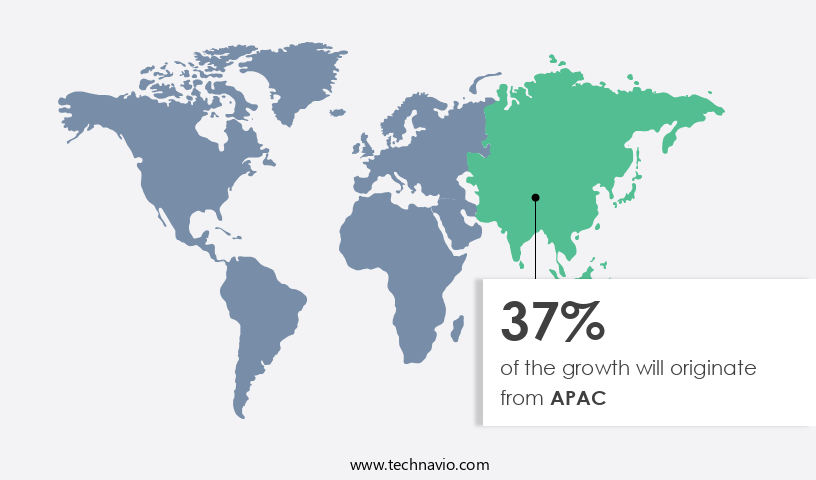
APAC is estimated to contribute 37% to the growth of the global market during the forecast period. Technavio’s analysts have elaborately explained the regional trends and drivers that shape the market during the forecast period.

Process Instrumentation Market Share by Geography

For more insights on the market share of various regions, Request Free Sample

The market in APAC is projected to experience significant growth, with China, South Korea, Japan, India, Thailand, Malaysia, and Australia being key contributors. The increasing manufacturing sector expansion In the region, driven by population growth and rising per capita income, is a major factor fueling market growth. In China, a priority is placed on improving water quality and infrastructure, with substantial investments in advanced water technologies, such as wastewater treatment, recycling, and membrane technologies. The Chinese government allocated over USD104 billion towards water infrastructure development in 2019. Process control systems, including Asset utilization, Energy efficiency, and Emission reduction, are integral to manufacturing businesses.

Process instrumentation equipment, such as sensors, transmitters, switches, and gauges, enable real-time monitoring, automation, and M2M communication. Key sectors rely on process instrumentation for product quality, safety, and environmental iImpact. Companies offer a range of solutions to meet the diverse needs of various industries. The market's high initial investments necessitate careful consideration of Industry applications, competitor analysis, and communication protocols.

Market Dynamics

Our  researchers analyzed the data with 2023 as the base year, along with the key drivers, trends, and challenges. A holistic analysis of drivers will help companies refine their marketing strategies to gain a competitive advantage.

What are the key market drivers leading to the rise In the adoption of Process Instrumentation Industry?

Rising demand for automation in manufacturing processes is the key driver of the market.

  • Process instrumentation plays a crucial role in optimizing manufacturing processes by providing real-time data on various parameters such as flow, pressure, level, temperature, and humidity. Process control systems rely on this data for asset utilization, energy efficiency, emission reduction, and maintaining product quality and safety. The market for process instrumentation equipment is driven by economic factors, including the need for absolute reliability, accuracy, and precision in various industry applications. Automation, digital transformation, and the Internet of Things (IoT) are transforming manufacturing businesses by enabling M2M communication between connected equipment and intelligent robotics. This enables labor-intensive production processes to become more efficient and sustainable, addressing labor shortages and environmental impact.
  • The serviceable addressable market for process instrumentation is vast, with significant opportunities in sectors such as energy and utilities, metals and mining, chemical, food and beverages, and pharmaceuticals. Key players In the market include Equilibar, SDO valves, OleumTech, and others. Process instrumentation is essential for industries such as power generation and transportation, where high initial investments and cybersecurity risks require absolute reliability and accuracy. Communication protocols like Profibus PA, Foundation Fieldbus, and HART enable seamless integration of field instruments into control systems. Ex-Proof/Intrinsically safe sensors and transmitters are critical for industries with hazardous environments, such as agriculture and livestock, mining and metals, and oil and gas.
  • Competitor analysis, industry trends, and economic factors are essential considerations for businesses looking to invest in process instrumentation.

What are the market trends shaping the Process Instrumentation Industry?

Rising demand for wireless field instruments is the upcoming market trend.

  • Process instrumentation plays a crucial role in optimizing process control systems in various industries, including manufacturing businesses. The integration of advanced technologies such as M2M communication, automation, and intelligent robotics has led to improved asset utilization, energy efficiency, and emission reduction. Process instrumentation equipment, including sensors, transmitters, switches, and gauges, record and measure critical data points in real-time, enabling precise controlling and monitoring of production processes. Absolute reliability and accuracy are essential for maintaining product quality, safety, and environmental impact. The serviceable addressable market for process instrumentation is significant, with applications in sectors such as energy and utilities, metals and mining, chemical, food and beverages, and pharmaceutical industries.
  • Key technologies include flow control valves, pressure, level, temperature, and humidity sensors, and communication protocols such as Profibus PA, Foundation Fieldbus, and HART. Despite the benefits, high initial investments and cybersecurity risks are challenges for businesses considering process instrumentation upgrades. Economic factors, digital transformation, and the increasing importance of sustainability also influence business investment decisions. The Internet of Things (IoT) and smart sensors enable real-time monitoring and data analysis, while transportation and power plants require specialized field instruments. Competitor analysis and industry applications continue to drive innovation in process instrumentation, with companies such as Equilibar, SDO valves, and OleumTech offering solutions for various industries.

What challenges does the Process Instrumentation Industry face during its growth?

Safety issues due to faulty instruments is a key challenge affecting the industry growth.

  • Process instrumentation plays a pivotal role in ensuring safety and efficiency in various industries by providing precise measurements for process control systems. These measurements are essential for optimizing asset utilization, enhancing energy efficiency, and reducing emissions. Process instrumentation equipment, including sensors, transmitters, switches, and gauges, enable real-time monitoring and automation of manufacturing processes. The importance of absolute reliability and accuracy in process measurements is evident in industries such as energy and utilities, chemicals, food and beverages, and metals and mining. For instance, a faulty measurement instrument in a power plant could lead to inefficient energy consumption or even safety hazards.
  • In the food and beverage industry, inaccurate temperature readings could affect product quality, while incorrect pressure measurements In the mining sector could impact equipment performance and worker safety. Moreover, the integration of M2M communication and the Internet of Things (IoT) in process instrumentation has led to intelligent automation and remote monitoring capabilities, addressing labor shortages and enabling businesses to make data-driven decisions. However, high initial investments and cybersecurity risks are some economic factors that may hinder market growth. Key industry applications of process instrumentation include flow control valves, pressure, level, temperature, humidity, and communication protocols such as Profibus PA, Foundation Fieldbus, and HART.
  • Additionally, the market encompasses various sectors, including agriculture and livestock, mining and metals, power generation, pharmaceuticals, and water availability, among others. Competitor analysis and understanding industry trends are crucial for businesses looking to invest in process instrumentation.

Exclusive Customer Landscape

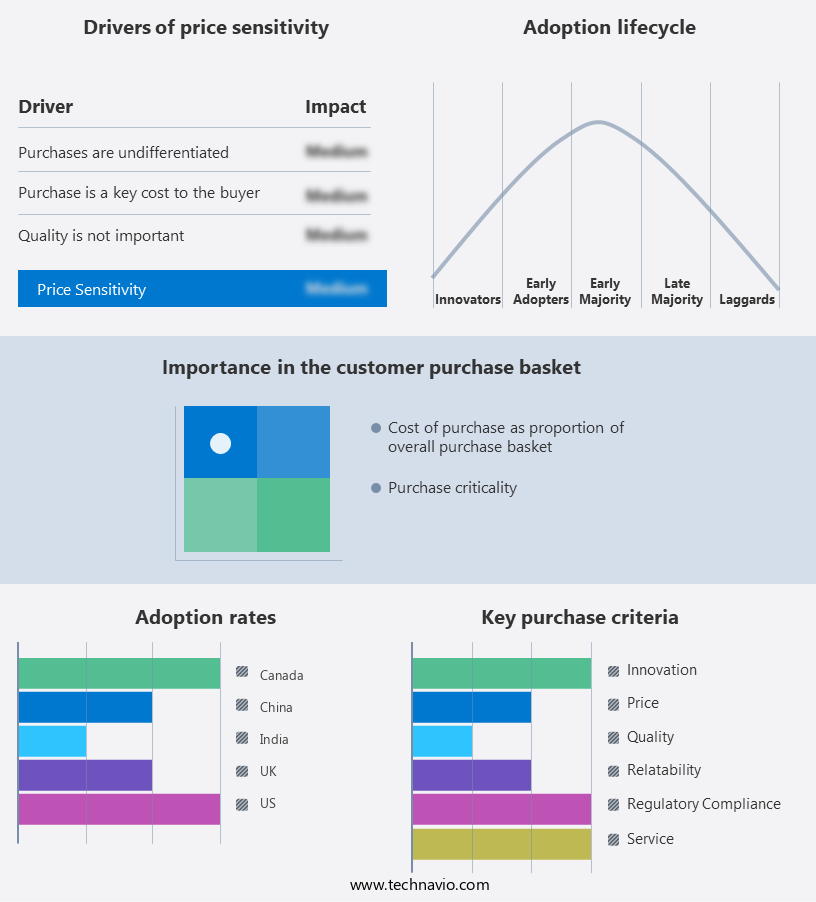
The process instrumentation market forecasting report includes the adoption lifecycle of the market, covering from the innovator’s stage to the laggard’s stage. It focuses on adoption rates in different regions based on penetration. Furthermore, the process instrumentation market report also includes key purchase criteria and drivers of price sensitivity to help companies evaluate and develop their market growth analysis strategies.

Process Instrumentation Market Share by Geography

 Customer Landscape

Key Companies & Market Insights

Companies are implementing various strategies, such as strategic alliances, process instrumentation market forecast, partnerships, mergers and acquisitions, geographical expansion, and product/service launches, to enhance their presence In the industry.

ABB Ltd. - The market encompasses temperature transmitters and sensors, as well as pressure transmitters and remote seals, catering to the life sciences sector. These instruments facilitate process monitoring and control, ensuring optimal performance and compliance with industry regulations. Temperature transmitters and sensors measure and transmit temperature data, enabling real-time process monitoring and temperature maintenance. Pressure transmitters and remote seals, on the other hand, measure and transmit pressure data, ensuring process safety and efficiency. By implementing these advanced process instrumentation solutions, organizations In the life sciences industry can enhance their operational efficiency, product quality, and regulatory compliance.

The industry research and growth report includes detailed analyses of the competitive landscape of the market and information about key companies, including:

  • ABB Ltd.
  • Delta Electronics Inc.
  • Emerson Electric Co.
  • Endress Hauser Group Services AG
  • Fuji Electric Co. Ltd.
  • General Electric Co.
  • Hitachi Ltd.
  • Honeywell International Inc.
  • KROHNE Messtechnik GmbH
  • Metso Outotec Corp.
  • Mitsubishi Electric Corp.
  • OMRON Corp.
  • Pepperl and Fuchs SE
  • Rockwell Automation Inc.
  • Schlumberger Ltd.
  • Schneider Electric SE
  • Siemens AG
  • Teledyne Technologies Inc.
  • Titan Co. Ltd.
  • Yokogawa Electric Corp.

Qualitative and quantitative analysis of companies has been conducted to help clients understand the wider business environment as well as the strengths and weaknesses of key industry players. Data is qualitatively analyzed to categorize companies as pure play, category-focused, industry-focused, and diversified; it is quantitatively analyzed to categorize companies as dominant, leading, strong, tentative, and weak.

Research Analyst Overview

Process instrumentation plays a crucial role in optimizing production processes and enhancing asset utilization in various manufacturing businesses. By providing real-time data on critical process parameters such as flow, pressure, level, temperature, and humidity, process instrumentation equipment enables manufacturers to improve energy efficiency, reduce emissions, and ensure product quality and safety. The adoption of process instrumentation is driven by several market dynamics. The increasing focus on sustainability and environmental impact reduction has led manufacturers to prioritize energy efficiency and water availability In their operations. Moreover, the rise of industrial automation and digital transformation has resulted In the integration of process instrumentation with connected equipment and M2M communication, enabling intelligent robotics and automation systems to make data-driven decisions in real-time.

Manufacturing businesses across industries, including chemical, food and beverages, metals and mining, pharmaceuticals, energy and utilities, and power generation, are investing in process instrumentation to enhance their production processes. The serviceable addressable market for process instrumentation is expected to grow significantly due to these factors. However, the high initial investments required for process instrumentation and cybersecurity risks associated with connected equipment are some of the challenges hindering the growth of the market. Moreover, economic factors such as labor shortages and business investment trends also influence the adoption of process instrumentation. The market is witnessing significant innovation, with companies developing new technologies and communication protocols such as Profibus PA, Foundation Fieldbus, and HART to improve accuracy, precision, and absolute reliability.

Transmitters, switches, gauges, and flow control valves are some of the key types of process instrumentation equipment in demand. The market for process instrumentation is diverse, with applications ranging from agriculture and livestock to mining and metals, power generation, and transportation. The market is competitive, with several players offering a range of products and services to cater to the varying needs of different industries. Competitor analysis is essential to understand market trends and positioning In the market. In conclusion, process instrumentation plays a vital role in optimizing production processes and enhancing asset utilization in manufacturing businesses. The market is driven by several factors, including sustainability, digital transformation, and industrial automation.

However, challenges such as high initial investments and cybersecurity risks need to be addressed to fully realize the potential of process instrumentation.

Market Scope

Report Coverage

Details

Page number

191

Base year

2023

Historic period

2018-2022

Forecast period

2024-2028

Growth momentum & CAGR

Accelerate at a CAGR of 6.67%

Market growth 2024-2028

USD 7.46 billion

Market structure

Fragmented

YoY growth 2023-2024(%)

6.28

Key countries

US, Canada, China, India, and UK

Competitive landscape

Leading Companies, Market Positioning of Companies, Competitive Strategies, and Industry Risks

Request Free Sample

What are the Key Data Covered in this Process Instrumentation Market Research and Growth Report?

  • CAGR of the Process Instrumentation industry during the forecast period
  • Detailed information on factors that will drive the growth and forecasting between 2024 and 2028
  • Precise estimation of the size of the market and its contribution of the industry in focus to the parent market
  • Accurate predictions about upcoming growth and trends and changes in consumer behaviour
  • Growth of the market across APAC, North America, Europe, South America, and Middle East and Africa
  • Thorough analysis of the market’s competitive landscape and detailed information about companies
  • Comprehensive analysis of factors that will challenge the process instrumentation market growth of industry companies

We can help! Our analysts can customize this process instrumentation market research report to meet your requirements.

Get in touch

1 Executive Summary

  • 1.1 Market overview
    • Exhibit 01: Executive Summary – Chart on Market Overview
    • Exhibit 02: Executive Summary – Data Table on Market Overview
    • Exhibit 03: Executive Summary – Chart on Global Market Characteristics
    • Exhibit 04: Executive Summary – Chart on Market by Geography
    • Exhibit 05: Executive Summary – Chart on Market Segmentation by End-user
    • Exhibit 06: Executive Summary – Chart on Market Segmentation by Type
    • Exhibit 07: Executive Summary – Chart on Incremental Growth
    • Exhibit 08: Executive Summary – Data Table on Incremental Growth
    • Exhibit 09: Executive Summary – Chart on Vendor Market Positioning

2 Market Landscape

  • 2.1 Market ecosystem
    • Exhibit 10: Parent market
    • Exhibit 11: Market Characteristics

3 Market Sizing

  • 3.1 Market definition
    • Exhibit 12: Offerings of vendors included in the market definition
  • 3.2 Market segment analysis
    • Exhibit 13: Market segments
  • 3.3 Market size 2023
    • 3.4 Market outlook: Forecast for 2023-2028
      • Exhibit 14: Chart on Global - Market size and forecast 2023-2028 ($ million)
      • Exhibit 15: Data Table on Global - Market size and forecast 2023-2028 ($ million)
      • Exhibit 16: Chart on Global Market: Year-over-year growth 2023-2028 (%)
      • Exhibit 17: Data Table on Global Market: Year-over-year growth 2023-2028 (%)

    4 Historic Market Size

    • 4.1 Global process instrumentation market 2018 - 2022
      • Exhibit 18: Historic Market Size – Data Table on global process instrumentation market 2018 - 2022 ($ million)
    • 4.2 End-user Segment Analysis 2018 - 2022
      • Exhibit 19: Historic Market Size – End-user Segment 2018 - 2022 ($ million)
    • 4.3 Type Segment Analysis 2018 - 2022
      • Exhibit 20: Historic Market Size – Type Segment 2018 - 2022 ($ million)
    • 4.4 Geography Segment Analysis 2018 - 2022
      • Exhibit 21: Historic Market Size – Geography Segment 2018 - 2022 ($ million)
    • 4.5 Country Segment Analysis 2018 - 2022
      • Exhibit 22: Historic Market Size – Country Segment 2018 - 2022 ($ million)

    5 Five Forces Analysis

    • 5.1 Five forces summary
      • Exhibit 23: Five forces analysis - Comparison between 2023 and 2028
    • 5.2 Bargaining power of buyers
      • Exhibit 24: Chart on Bargaining power of buyers – Impact of key factors 2023 and 2028
    • 5.3 Bargaining power of suppliers
      • Exhibit 25: Bargaining power of suppliers – Impact of key factors in 2023 and 2028
    • 5.4 Threat of new entrants
      • Exhibit 26: Threat of new entrants – Impact of key factors in 2023 and 2028
    • 5.5 Threat of substitutes
      • Exhibit 27: Threat of substitutes – Impact of key factors in 2023 and 2028
    • 5.6 Threat of rivalry
      • Exhibit 28: Threat of rivalry – Impact of key factors in 2023 and 2028
    • 5.7 Market condition
      • Exhibit 29: Chart on Market condition - Five forces 2023 and 2028

    6 Market Segmentation by End-user

    • 6.1 Market segments
      • Exhibit 30: Chart on End-user - Market share 2023-2028 (%)
      • Exhibit 31: Data Table on End-user - Market share 2023-2028 (%)
    • 6.2 Comparison by End-user
      • Exhibit 32: Chart on Comparison by End-user
      • Exhibit 33: Data Table on Comparison by End-user
    • 6.3 Oil and gas - Market size and forecast 2023-2028
      • Exhibit 34: Chart on Oil and gas - Market size and forecast 2023-2028 ($ million)
      • Exhibit 35: Data Table on Oil and gas - Market size and forecast 2023-2028 ($ million)
      • Exhibit 36: Chart on Oil and gas - Year-over-year growth 2023-2028 (%)
      • Exhibit 37: Data Table on Oil and gas - Year-over-year growth 2023-2028 (%)
    • 6.4 Chemical - Market size and forecast 2023-2028
      • Exhibit 38: Chart on Chemical - Market size and forecast 2023-2028 ($ million)
      • Exhibit 39: Data Table on Chemical - Market size and forecast 2023-2028 ($ million)
      • Exhibit 40: Chart on Chemical - Year-over-year growth 2023-2028 (%)
      • Exhibit 41: Data Table on Chemical - Year-over-year growth 2023-2028 (%)
    • 6.5 Food and beverages - Market size and forecast 2023-2028
      • Exhibit 42: Chart on Food and beverages - Market size and forecast 2023-2028 ($ million)
      • Exhibit 43: Data Table on Food and beverages - Market size and forecast 2023-2028 ($ million)
      • Exhibit 44: Chart on Food and beverages - Year-over-year growth 2023-2028 (%)
      • Exhibit 45: Data Table on Food and beverages - Year-over-year growth 2023-2028 (%)
    • 6.6 Energy and power - Market size and forecast 2023-2028
      • Exhibit 46: Chart on Energy and power - Market size and forecast 2023-2028 ($ million)
      • Exhibit 47: Data Table on Energy and power - Market size and forecast 2023-2028 ($ million)
      • Exhibit 48: Chart on Energy and power - Year-over-year growth 2023-2028 (%)
      • Exhibit 49: Data Table on Energy and power - Year-over-year growth 2023-2028 (%)
    • 6.7 Others - Market size and forecast 2023-2028
      • Exhibit 50: Chart on Others - Market size and forecast 2023-2028 ($ million)
      • Exhibit 51: Data Table on Others - Market size and forecast 2023-2028 ($ million)
      • Exhibit 52: Chart on Others - Year-over-year growth 2023-2028 (%)
      • Exhibit 53: Data Table on Others - Year-over-year growth 2023-2028 (%)
    • 6.8 Market opportunity by End-user
      • Exhibit 54: Market opportunity by End-user ($ million)
      • Exhibit 55: Data Table on Market opportunity by End-user ($ million)

    7 Market Segmentation by Type

    • 7.1 Market segments
      • Exhibit 56: Chart on Type - Market share 2023-2028 (%)
      • Exhibit 57: Data Table on Type - Market share 2023-2028 (%)
    • 7.2 Comparison by Type
      • Exhibit 58: Chart on Comparison by Type
      • Exhibit 59: Data Table on Comparison by Type
    • 7.3 Field instrument - Market size and forecast 2023-2028
      • Exhibit 60: Chart on Field instrument - Market size and forecast 2023-2028 ($ million)
      • Exhibit 61: Data Table on Field instrument - Market size and forecast 2023-2028 ($ million)
      • Exhibit 62: Chart on Field instrument - Year-over-year growth 2023-2028 (%)
      • Exhibit 63: Data Table on Field instrument - Year-over-year growth 2023-2028 (%)
    • 7.4 Control valve - Market size and forecast 2023-2028
      • Exhibit 64: Chart on Control valve - Market size and forecast 2023-2028 ($ million)
      • Exhibit 65: Data Table on Control valve - Market size and forecast 2023-2028 ($ million)
      • Exhibit 66: Chart on Control valve - Year-over-year growth 2023-2028 (%)
      • Exhibit 67: Data Table on Control valve - Year-over-year growth 2023-2028 (%)
    • 7.5 Analyzer - Market size and forecast 2023-2028
      • Exhibit 68: Chart on Analyzer - Market size and forecast 2023-2028 ($ million)
      • Exhibit 69: Data Table on Analyzer - Market size and forecast 2023-2028 ($ million)
      • Exhibit 70: Chart on Analyzer - Year-over-year growth 2023-2028 (%)
      • Exhibit 71: Data Table on Analyzer - Year-over-year growth 2023-2028 (%)
    • 7.6 Market opportunity by Type
      • Exhibit 72: Market opportunity by Type ($ million)
      • Exhibit 73: Data Table on Market opportunity by Type ($ million)

    8 Market Segmentation by Instrument

    • 8.1 Market segments
      • Chart on Instrument - Market share (2023-2028) (%)
      • Data Table on Instrument - Market share (2023-2028) (%)
    • 8.2 Comparison by Instrument
      • Chart on Comparison by Instrument
      • Data Table on Comparison by Instrument
    • 8.3 Transmitter - Market size and forecast (2023-2028)
      • Chart on Transmitter - Market size and forecast (2023-2028) ($ million)
      • Data Table on Transmitter - Market size and forecast (2023-2028) ($ million)
      • Chart on Transmitter - Year-over-year growth (2023-2028) (%)
      • Data Table on Transmitter - Year-over-year growth (2023-2028) (%)
    • 8.4 Control Valve - Market size and forecast (2023-2028)
      • Chart on Control Valve - Market size and forecast (2023-2028) ($ million)
      • Data Table on Control Valve - Market size and forecast (2023-2028) ($ million)
      • Chart on Control Valve - Year-over-year growth (2023-2028) (%)
      • Data Table on Control Valve - Year-over-year growth (2023-2028) (%)
    • 8.5 Market opportunity by Instrument
      • Market opportunity by $segment_name ($ million)
      • Data Table on Market opportunity by $segment_name ($ million)

    9 Market Segmentation by Technology

    • 9.1 Market segments
      • Chart on Technology - Market share (2023-2028) (%)
      • Data Table on Technology - Market share (2023-2028) (%)
    • 9.2 Comparison by Technology
      • Chart on Comparison by Technology
      • Data Table on Comparison by Technology
    • 9.3 Programmable Logic Controller (PLC) - Market size and forecast (2023-2028)
      • Chart on Programmable Logic Controller (PLC) - Market size and forecast (2023-2028) ($ million)
      • Data Table on Programmable Logic Controller (PLC) - Market size and forecast (2023-2028) ($ million)
      • Chart on Programmable Logic Controller (PLC) - Year-over-year growth (2023-2028) (%)
      • Data Table on Programmable Logic Controller (PLC) - Year-over-year growth (2023-2028) (%)
    • 9.4 Distributed Control System (DCS) - Market size and forecast (2023-2028)
      • Chart on Distributed Control System (DCS) - Market size and forecast (2023-2028) ($ million)
      • Data Table on Distributed Control System (DCS) - Market size and forecast (2023-2028) ($ million)
      • Chart on Distributed Control System (DCS) - Year-over-year growth (2023-2028) (%)
      • Data Table on Distributed Control System (DCS) - Year-over-year growth (2023-2028) (%)
    • 9.5 Supervisory Control and Data Acquisition (SCADA) - Market size and forecast (2023-2028)
      • Chart on Supervisory Control and Data Acquisition (SCADA) - Market size and forecast (2023-2028) ($ million)
      • Data Table on Supervisory Control and Data Acquisition (SCADA) - Market size and forecast (2023-2028) ($ million)
      • Chart on Supervisory Control and Data Acquisition (SCADA) - Year-over-year growth (2023-2028) (%)
      • Data Table on Supervisory Control and Data Acquisition (SCADA) - Year-over-year growth (2023-2028) (%)
    • 9.6 Manufacturing Execution System (MES) - Market size and forecast (2023-2028)
      • Chart on Manufacturing Execution System (MES) - Market size and forecast (2023-2028) ($ million)
      • Data Table on Manufacturing Execution System (MES) - Market size and forecast (2023-2028) ($ million)
      • Chart on Manufacturing Execution System (MES) - Year-over-year growth (2023-2028) (%)
      • Data Table on Manufacturing Execution System (MES) - Year-over-year growth (2023-2028) (%)
    • 9.7 Market opportunity by Technology
      • Market opportunity by $segment_name ($ million)
      • Data Table on Market opportunity by $segment_name ($ million)

    8 Customer Landscape

    • 8.1 Customer landscape overview
      • Exhibit 74: Analysis of price sensitivity, lifecycle, customer purchase basket, adoption rates, and purchase criteria

    9 Geographic Landscape

    • 9.1 Geographic segmentation
      • Exhibit 75: Chart on Market share by geography 2023-2028 (%)
      • Exhibit 76: Data Table on Market share by geography 2023-2028 (%)
    • 9.2 Geographic comparison
      • Exhibit 77: Chart on Geographic comparison
      • Exhibit 78: Data Table on Geographic comparison
    • 9.3 APAC - Market size and forecast 2023-2028
      • Exhibit 79: Chart on APAC - Market size and forecast 2023-2028 ($ million)
      • Exhibit 80: Data Table on APAC - Market size and forecast 2023-2028 ($ million)
      • Exhibit 81: Chart on APAC - Year-over-year growth 2023-2028 (%)
      • Exhibit 82: Data Table on APAC - Year-over-year growth 2023-2028 (%)
    • 9.4 North America - Market size and forecast 2023-2028
      • Exhibit 83: Chart on North America - Market size and forecast 2023-2028 ($ million)
      • Exhibit 84: Data Table on North America - Market size and forecast 2023-2028 ($ million)
      • Exhibit 85: Chart on North America - Year-over-year growth 2023-2028 (%)
      • Exhibit 86: Data Table on North America - Year-over-year growth 2023-2028 (%)
    • 9.5 Europe - Market size and forecast 2023-2028
      • Exhibit 87: Chart on Europe - Market size and forecast 2023-2028 ($ million)
      • Exhibit 88: Data Table on Europe - Market size and forecast 2023-2028 ($ million)
      • Exhibit 89: Chart on Europe - Year-over-year growth 2023-2028 (%)
      • Exhibit 90: Data Table on Europe - Year-over-year growth 2023-2028 (%)
    • 9.6 South America - Market size and forecast 2023-2028
      • Exhibit 91: Chart on South America - Market size and forecast 2023-2028 ($ million)
      • Exhibit 92: Data Table on South America - Market size and forecast 2023-2028 ($ million)
      • Exhibit 93: Chart on South America - Year-over-year growth 2023-2028 (%)
      • Exhibit 94: Data Table on South America - Year-over-year growth 2023-2028 (%)
    • 9.7 Middle East and Africa - Market size and forecast 2023-2028
      • Exhibit 95: Chart on Middle East and Africa - Market size and forecast 2023-2028 ($ million)
      • Exhibit 96: Data Table on Middle East and Africa - Market size and forecast 2023-2028 ($ million)
      • Exhibit 97: Chart on Middle East and Africa - Year-over-year growth 2023-2028 (%)
      • Exhibit 98: Data Table on Middle East and Africa - Year-over-year growth 2023-2028 (%)
    • 9.8 US - Market size and forecast 2023-2028
      • Exhibit 99: Chart on US - Market size and forecast 2023-2028 ($ million)
      • Exhibit 100: Data Table on US - Market size and forecast 2023-2028 ($ million)
      • Exhibit 101: Chart on US - Year-over-year growth 2023-2028 (%)
      • Exhibit 102: Data Table on US - Year-over-year growth 2023-2028 (%)
    • 9.9 China - Market size and forecast 2023-2028
      • Exhibit 103: Chart on China - Market size and forecast 2023-2028 ($ million)
      • Exhibit 104: Data Table on China - Market size and forecast 2023-2028 ($ million)
      • Exhibit 105: Chart on China - Year-over-year growth 2023-2028 (%)
      • Exhibit 106: Data Table on China - Year-over-year growth 2023-2028 (%)
    • 9.10 India - Market size and forecast 2023-2028
      • Exhibit 107: Chart on India - Market size and forecast 2023-2028 ($ million)
      • Exhibit 108: Data Table on India - Market size and forecast 2023-2028 ($ million)
      • Exhibit 109: Chart on India - Year-over-year growth 2023-2028 (%)
      • Exhibit 110: Data Table on India - Year-over-year growth 2023-2028 (%)
    • 9.11 Canada - Market size and forecast 2023-2028
      • Exhibit 111: Chart on Canada - Market size and forecast 2023-2028 ($ million)
      • Exhibit 112: Data Table on Canada - Market size and forecast 2023-2028 ($ million)
      • Exhibit 113: Chart on Canada - Year-over-year growth 2023-2028 (%)
      • Exhibit 114: Data Table on Canada - Year-over-year growth 2023-2028 (%)
    • 9.12 UK - Market size and forecast 2023-2028
      • Exhibit 115: Chart on UK - Market size and forecast 2023-2028 ($ million)
      • Exhibit 116: Data Table on UK - Market size and forecast 2023-2028 ($ million)
      • Exhibit 117: Chart on UK - Year-over-year growth 2023-2028 (%)
      • Exhibit 118: Data Table on UK - Year-over-year growth 2023-2028 (%)
    • 9.13 Market opportunity by geography
      • Exhibit 119: Market opportunity by geography ($ million)
      • Exhibit 120: Data Tables on Market opportunity by geography ($ million)

    10 Drivers, Challenges, and Trends

    • 10.1 Market drivers
      • 10.2 Market challenges
        • 10.3 Impact of drivers and challenges
          • Exhibit 121: Impact of drivers and challenges in 2023 and 2028
        • 10.4 Market trends

          11 Vendor Landscape

          • 11.1 Overview
            • 11.2 Vendor landscape
              • Exhibit 122: Overview on Criticality of inputs and Factors of differentiation
            • 11.3 Landscape disruption
              • Exhibit 123: Overview on factors of disruption
            • 11.4 Industry risks
              • Exhibit 124: Impact of key risks on business

            12 Vendor Analysis

            • 12.1 Vendors covered
              • Exhibit 125: Vendors covered
            • 12.2 Market positioning of vendors
              • Exhibit 126: Matrix on vendor position and classification
            • 12.3 ABB Ltd.
              • Exhibit 127: ABB Ltd. - Overview
              • Exhibit 128: ABB Ltd. - Business segments
              • Exhibit 129: ABB Ltd. - Key news
              • Exhibit 130: ABB Ltd. - Key offerings
              • Exhibit 131: ABB Ltd. - Segment focus
            • 12.4 Delta Electronics Inc.
              • Exhibit 132: Delta Electronics Inc. - Overview
              • Exhibit 133: Delta Electronics Inc. - Business segments
              • Exhibit 134: Delta Electronics Inc. - Key offerings
              • Exhibit 135: Delta Electronics Inc. - Segment focus
            • 12.5 Emerson Electric Co.
              • Exhibit 136: Emerson Electric Co. - Overview
              • Exhibit 137: Emerson Electric Co. - Business segments
              • Exhibit 138: Emerson Electric Co. - Key news
              • Exhibit 139: Emerson Electric Co. - Key offerings
              • Exhibit 140: Emerson Electric Co. - Segment focus
            • 12.6 Endress Hauser Group Services AG
              • Exhibit 141: Endress Hauser Group Services AG - Overview
              • Exhibit 142: Endress Hauser Group Services AG - Product / Service
              • Exhibit 143: Endress Hauser Group Services AG - Key news
              • Exhibit 144: Endress Hauser Group Services AG - Key offerings
            • 12.7 Fuji Electric Co. Ltd.
              • Exhibit 145: Fuji Electric Co. Ltd. - Overview
              • Exhibit 146: Fuji Electric Co. Ltd. - Business segments
              • Exhibit 147: Fuji Electric Co. Ltd. - Key offerings
              • Exhibit 148: Fuji Electric Co. Ltd. - Segment focus
            • 12.8 General Electric Co.
              • Exhibit 149: General Electric Co. - Overview
              • Exhibit 150: General Electric Co. - Business segments
              • Exhibit 151: General Electric Co. - Key offerings
              • Exhibit 152: General Electric Co. - Segment focus
            • 12.9 Hitachi Ltd.
              • Exhibit 153: Hitachi Ltd. - Overview
              • Exhibit 154: Hitachi Ltd. - Business segments
              • Exhibit 155: Hitachi Ltd. - Key news
              • Exhibit 156: Hitachi Ltd. - Key offerings
              • Exhibit 157: Hitachi Ltd. - Segment focus
            • 12.10 Honeywell International Inc.
              • Exhibit 158: Honeywell International Inc. - Overview
              • Exhibit 159: Honeywell International Inc. - Business segments
              • Exhibit 160: Honeywell International Inc. - Key news
              • Exhibit 161: Honeywell International Inc. - Key offerings
              • Exhibit 162: Honeywell International Inc. - Segment focus
            • 12.11 Metso Outotec Corp.
              • Exhibit 163: Metso Outotec Corp. - Overview
              • Exhibit 164: Metso Outotec Corp. - Business segments
              • Exhibit 165: Metso Outotec Corp. - Key offerings
              • Exhibit 166: Metso Outotec Corp. - Segment focus
            • 12.12 Mitsubishi Electric Corp.
              • Exhibit 167: Mitsubishi Electric Corp. - Overview
              • Exhibit 168: Mitsubishi Electric Corp. - Business segments
              • Exhibit 169: Mitsubishi Electric Corp. - Key news
              • Exhibit 170: Mitsubishi Electric Corp. - Key offerings
              • Exhibit 171: Mitsubishi Electric Corp. - Segment focus
            • 12.13 OMRON Corp.
              • Exhibit 172: OMRON Corp. - Overview
              • Exhibit 173: OMRON Corp. - Business segments
              • Exhibit 174: OMRON Corp. - Key news
              • Exhibit 175: OMRON Corp. - Key offerings
              • Exhibit 176: OMRON Corp. - Segment focus
            • 12.14 Pepperl and Fuchs SE
              • Exhibit 177: Pepperl and Fuchs SE - Overview
              • Exhibit 178: Pepperl and Fuchs SE - Product / Service
              • Exhibit 179: Pepperl and Fuchs SE - Key offerings
            • 12.15 Rockwell Automation Inc.
              • Exhibit 180: Rockwell Automation Inc. - Overview
              • Exhibit 181: Rockwell Automation Inc. - Business segments
              • Exhibit 182: Rockwell Automation Inc. - Key news
              • Exhibit 183: Rockwell Automation Inc. - Key offerings
              • Exhibit 184: Rockwell Automation Inc. - Segment focus
            • 12.16 Schneider Electric SE
              • Exhibit 185: Schneider Electric SE - Overview
              • Exhibit 186: Schneider Electric SE - Business segments
              • Exhibit 187: Schneider Electric SE - Key news
              • Exhibit 188: Schneider Electric SE - Key offerings
              • Exhibit 189: Schneider Electric SE - Segment focus
            • 12.17 Siemens AG
              • Exhibit 190: Siemens AG - Overview
              • Exhibit 191: Siemens AG - Business segments
              • Exhibit 192: Siemens AG - Key news
              • Exhibit 193: Siemens AG - Key offerings
              • Exhibit 194: Siemens AG - Segment focus

            13 Appendix

            • 13.1 Scope of the report
              • 13.2 Inclusions and exclusions checklist
                • Exhibit 195: Inclusions checklist
                • Exhibit 196: Exclusions checklist
              • 13.3 Currency conversion rates for US$
                • Exhibit 197: Currency conversion rates for US$
              • 13.4 Research methodology
                • Exhibit 198: Research methodology
                • Exhibit 199: Validation techniques employed for market sizing
                • Exhibit 200: Information sources
              • 13.5 List of abbreviations
                • Exhibit 201: List of abbreviations

              Research Methodology

              Technavio presents a detailed picture of the market by way of study, synthesis, and summation of data from multiple sources. The analysts have presented the various facets of the market with a particular focus on identifying the key industry influencers. The data thus presented is comprehensive, reliable, and the result of extensive research, both primary and secondary.

              INFORMATION SOURCES

              Primary sources

              • Manufacturers and suppliers
              • Channel partners
              • Industry experts
              • Strategic decision makers

              Secondary sources

              • Industry journals and periodicals
              • Government data
              • Financial reports of key industry players
              • Historical data
              • Press releases

              DATA ANALYSIS

              Data Synthesis

              • Collation of data
              • Estimation of key figures
              • Analysis of derived insights

              Data Validation

              • Triangulation with data models
              • Reference against proprietary databases
              • Corroboration with industry experts

              REPORT WRITING

              Qualitative

              • Market drivers
              • Market challenges
              • Market trends
              • Five forces analysis

              Quantitative

              • Market size and forecast
              • Market segmentation
              • Geographical insights
              • Competitive landscape

              Interested in this report?

              Get your sample now to see our research methodology and insights!

              Download Now

              Frequently Asked Questions

              Process Instrumentation market growth will increase by $ 7.46 bn during 2024-2028.

              The Process Instrumentation market is expected to grow at a CAGR of 6.67% during 2024-2028.

              Process Instrumentation market is segmented by End-user( Oil and gas, Chemical, Food and beverages, Energy and power, Others) Type( Field instrument, Control valve, Analyzer, MEA, South America)

              ABB Ltd., Delta Electronics Inc., Emerson Electric Co., Endress Hauser Group Services AG, Fuji Electric Co. Ltd., General Electric Co., Hitachi Ltd., Honeywell International Inc., KROHNE Messtechnik GmbH, Metso Outotec Corp., Mitsubishi Electric Corp., OMRON Corp., Pepperl and Fuchs SE, Rockwell Automation Inc., Schlumberger Ltd., Schneider Electric SE, Siemens AG, Teledyne Technologies Inc., Titan Co. Ltd., Yokogawa Electric Corp. are a few of the key vendors in the Process Instrumentation market.

              APAC will register the highest growth rate of 37% among the other regions. Therefore, the Process Instrumentation market in APAC is expected to garner significant business opportunities for the vendors during the forecast period.

              US, Canada, China, India, UK

              • Rising demand for automation in manufacturing processesRequirements such as a lengthy bill of materials is the driving factor this market.
              • long cycle time is the driving factor this market.
              • highly skilled labor is the driving factor this market.
              • non-repetitive production process is the driving factor this market.
              • and extensive data collection and verification have increased the complexity of the manufacturing processes in the process and discrete industry. The complex product development methods require continuous streaming of the overall process.  Over the past few years is the driving factor this market.
              • from 2021 is the driving factor this market.
              • automation in manufacturing processes has been transforming the factory floor and economics of many manufacturing sectors. Advancements in robotics is the driving factor this market.
              • artificial intelligence is the driving factor this market.
              • and machine learning are enabling machines to outperform humans in a range of work capabilities that require cognitive capabilities. Some of the advantages of automation manufacturing include an increase in labor productivity is the driving factor this market.
              • low labor cost is the driving factor this market.
              • elimination of routine work is the driving factor this market.
              • high work safety is the driving factor this market.
              • high product quality is the driving factor this market.
              • and a decrease in lead time. Automated systems such as SCADA is the driving factor this market.
              • PLCs is the driving factor this market.
              • DCS is the driving factor this market.
              • and MES help industrial operators streamline and automate complex manufacturing and reporting processes. Additionally is the driving factor this market.
              • instruments such as sensors is the driving factor this market.
              • analyzers is the driving factor this market.
              • and transmitters help in providing accurate data and ensuring controlled production operations. MES are automated systems to improve the quality and traceability of the entire operation process is the driving factor this market.
              • while PLCs and SCADA systems ease the regulation of operational equipment such as 3D printing and product assembly lines.  The fierce competition and increasing complexity of production operations coupled with faster time-to-market have become a major challenge for the global process instrumentation market. Without automated systems involved in process instrumentation place is the driving factor this market.
              • the overall time-to-market increases and leads to losses for the process and discrete industrial manufacturers. Thus is the driving factor this market.
              • to adopt changing technology is the driving factor this market.
              • this automated device just needs a minor change in programming. As this automated system can easily adapt to operational changes is the driving factor this market.
              • it reduces the time taken to collect data and increases the efficiency of the overall production process. Thus is the driving factor this market.
              •  the rising adoption of automation in manufacturing processes is expected to drive the growth of the global process instrumentation market during the forecast period. is the driving factor this market.

              The Process Instrumentation market vendors should focus on grabbing business opportunities from the Oil and gas segment as it accounted for the largest market share in the base year.
              RIA - Research AI Assistant
              Ask RIA