Insurance Business Process Outsourcing (BPO) Market Analysis, Size, and Forecast 2026-2030: North America (US, Canada, and Mexico), Europe (UK, Germany, and France), APAC (India, China, and Japan), Middle East and Africa (UAE, Saudi Arabia, and South Africa), South America (Brazil, Argentina, and Colombia), and Rest of World (ROW)

Insurance Business Process Outsourcing (BPO) Market Analysis, Size, and Forecast 2026-2030:
North America (US, Canada, and Mexico), Europe (UK, Germany, and France), APAC (India, China, and Japan), Middle East and Africa (UAE, Saudi Arabia, and South Africa), South America (Brazil, Argentina, and Colombia), and Rest of World (ROW)

Published: Apr 2026 300 Pages SKU: IRTNTR77533

Market Overview at a Glance

$1.63 B
Market Opportunity
4.3%
CAGR 2025 - 2030
46.5%
North America Growth
$4.02 B
Life and pension segment 2024

Insurance Business Process Outsourcing (BPO) Market Size 2026-2030

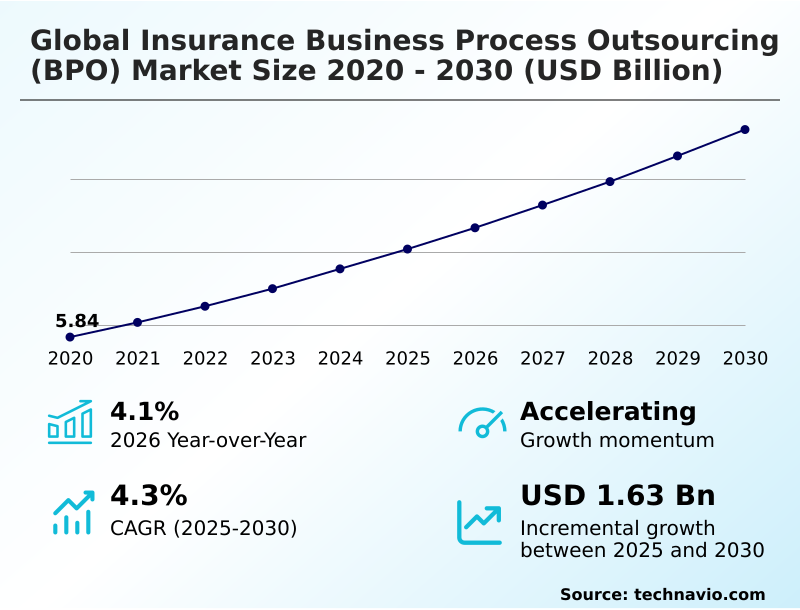
The insurance business process outsourcing (bpo) market size is valued to increase by USD 1.63 billion, at a CAGR of 4.3% from 2025 to 2030. Rising imperative for scalable pension and retirement risk transfer solutions will drive the insurance business process outsourcing (bpo) market.

Major Market Trends & Insights

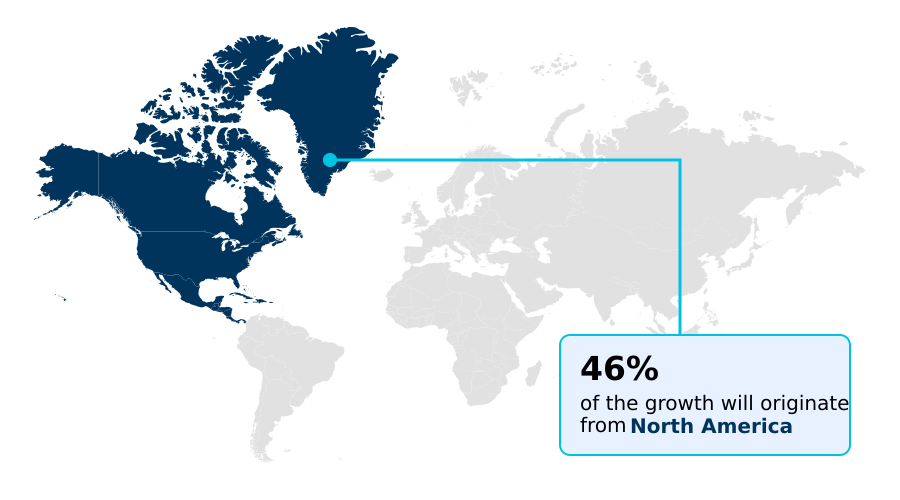
  • North America dominated the market and accounted for a 46.5% growth during the forecast period.
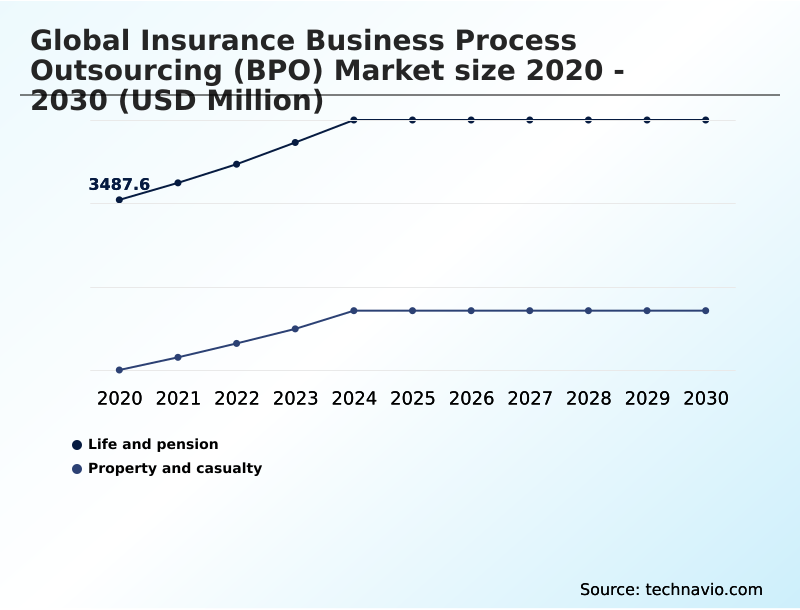
  • By Application - Life and pension segment was valued at USD 4.02 billion in 2024
  • By End-user - Insurance companies segment accounted for the largest market revenue share in 2024

Market Size & Forecast

  • Market Opportunities: USD 2.83 billion
  • Market Future Opportunities: USD 1.63 billion
  • CAGR from 2025 to 2030 : 4.3%

Market Summary

  • The Insurance Business Process Outsourcing (BPO) market is evolving from a cost-reduction tool into a strategic enabler of digital transformation. Insurers increasingly rely on external partners to navigate complex regulatory landscapes, enhance operational efficiency, and modernize legacy systems.
  • A primary driver is the need for specialized expertise in areas like pension risk transfer and cyber liability administration, which many carriers lack in-house. Key trends include the adoption of robotic process automation (RPA) and AI-driven insurance operations to automate routine tasks and improve data analytics capabilities.
  • For instance, a property and casualty insurer might outsource its claims function to a BPO provider that uses AI-powered tools for first notice of loss automation and virtual damage assessment, reducing claim cycle times and improving policyholder satisfaction. However, challenges persist, particularly around data security and the integration of sophisticated cloud-native insurance platforms with existing core infrastructure.
  • This strategic shift positions BPO providers as critical partners in achieving agility and resilience in a competitive environment.

What will be the Size of the Insurance Business Process Outsourcing (BPO) Market during the forecast period?

Get Key Insights on Market Forecast (PDF) Request Free Sample

How is the Insurance Business Process Outsourcing (BPO) Market Segmented?

The insurance business process outsourcing (bpo) industry research report provides comprehensive data (region-wise segment analysis), with forecasts and estimates in "USD million" for the period 2026-2030, as well as historical data from 2020-2024 for the following segments.

  • Application
    • Life and pension
    • Property and casualty
  • End-user
    • Insurance companies
    • Brokers and agents
  • Type
    • Claims management
    • Customer service
    • Policy administration
    • IT and technological support
    • Others
  • Geography
    • North America
      • US
      • Canada
      • Mexico
    • Europe
      • UK
      • Germany
      • France
    • APAC
      • India
      • China
      • Japan
    • Middle East and Africa
      • UAE
      • Saudi Arabia
      • South Africa
    • South America
      • Brazil
      • Argentina
      • Colombia
    • Rest of World (ROW)

By Application Insights

The life and pension segment is estimated to witness significant growth during the forecast period.

The life and pension segment is undergoing a strategic overhaul focused on long-term operational resilience and core systems modernization. Insurers face mounting pressure to manage complex annuity block management and execute pension risk transfer (PRT) strategies with greater precision.

This has spurred a demand for business process as a service (BPaaS) models and specialized managed services. Outsourcing partners provide essential actuarial data management and multi-jurisdictional regulatory compliance support, utilizing cloud-native insurance platforms for real-time reporting.

The transition from paper-based legacy environments to streamlined digital workflows, incorporating agentic artificial intelligence, allows for the automation of underwriting support services.

This shift enables a documented 20% improvement in reporting accuracy for multi-jurisdictional compliance, a key aspect of insurance operations management.

Request Free Sample

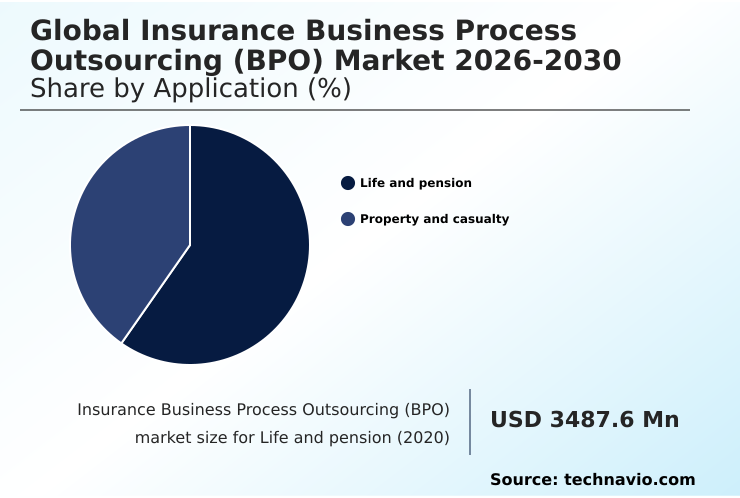
The Life and pension segment was valued at USD 4.02 billion in 2024 and showed a gradual increase during the forecast period.

Request Free Sample

Regional Analysis

North America is estimated to contribute 46.5% to the growth of the global market during the forecast period.Technavio’s analysts have elaborately explained the regional trends and drivers that shape the market during the forecast period.

See How Insurance Business Process Outsourcing (BPO) Market Demand is Rising in North America Request Free Sample

The geographic landscape of the insurance BPO market is led by North America, where a mature financial services sector drives demand for advanced technological frameworks, including predictive analytics for insurance and AI-powered claims processing.

Insurers in the United States and Canada leverage third-party administration (TPA) for complex claims adjudication and actuarial services outsourcing. In this region, the adoption of automated underwriting has reduced policy issuance times by up to 50%.

In contrast, the APAC region is the fastest-growing market, fueled by rapid digitalization and the expansion of insurance platform management. In Europe, the focus remains on navigating stringent regulatory frameworks and data sovereignty management.

BPO partners in this region help firms achieve over 99% compliance with data sovereignty regulations, demonstrating the critical role of specialized expertise in maintaining operational integrity across diverse legal environments.

Market Dynamics

Our researchers analyzed the data with 2025 as the base year, along with the key drivers, trends, and challenges. A holistic analysis of drivers will help companies refine their marketing strategies to gain a competitive advantage.

  • The strategic focus within the insurance industry is shifting from generalized cost-cutting to achieving specific, high-impact business outcomes through targeted outsourcing. Insurers are now prioritizing cost reduction in insurance claims processing by deploying solutions that streamline workflows from intake to settlement.
  • This involves a concerted effort toward improving underwriting accuracy with BPO partnerships that leverage advanced data analytics and sophisticated risk modeling tools. A key area of growth is the demand for scalable pension administration solutions, driven by the increasing complexity of retirement products and the need for specialized expertise in managing pension risk transfer operational tasks.
  • BPO for managing closed blocks of business has become essential for carriers looking to divest non-core liabilities while ensuring seamless service continuity. The implementation of AI in insurance customer service outsourcing is transforming policyholder interactions, creating more responsive and personalized support channels.
  • This focus on specialized capabilities is critical for digital transformation for property and casualty insurers, who must adapt to new risk categories and customer expectations. Concurrently, securing policyholder data in outsourced environments has become a top boardroom priority.
  • Firms that integrate BPO for end-to-end lifecycle management report operational efficiency gains that are often double those of organizations that only outsource piecemeal back-office tasks, demonstrating the value of a holistic approach.

What are the key market drivers leading to the rise in the adoption of Insurance Business Process Outsourcing (BPO) Industry?

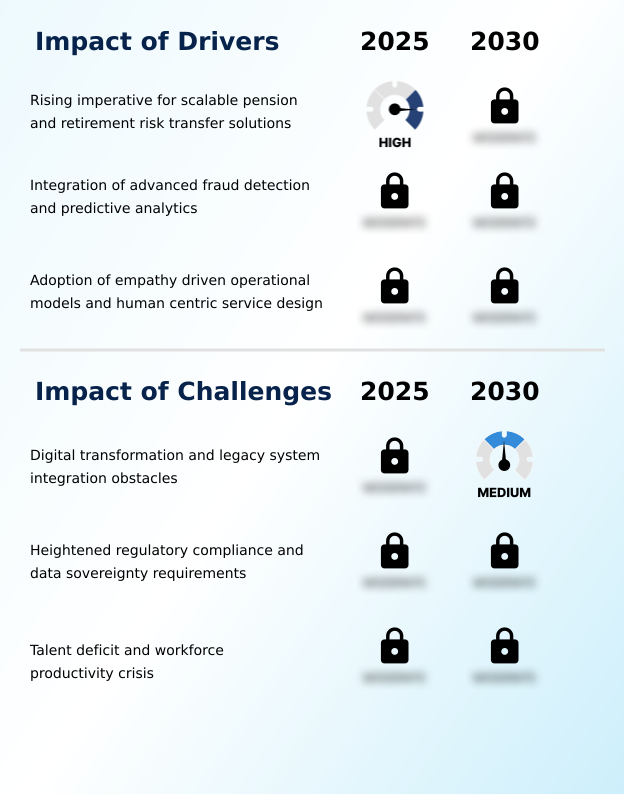
  • A key market driver is the rising imperative for scalable solutions to manage pension and retirement risk transfers.

  • A critical market driver is the rising need for scalable retirement solutions and the specialized administration of complex pension blocks.
  • As insurers divest non-core retirement portfolios, the reliance on third-party providers for closed block administration and managing pension risk transfer (PRT) volumes becomes paramount.
  • Outsourcing these functions can reduce administrative costs by up to 25% for large, closed books of business.
  • These BPO partners offer the necessary scale and technical infrastructure, including first notice of loss (FNOL) automation and claims lifecycle orchestration, to ensure accurate, timely payments and regulatory adherence.
  • The integration of advanced analytics into these services has improved cash flow prediction accuracy by over 20%. This allows carriers to offload significant administrative burdens, optimize capital, and focus internal resources on high-growth segments while leveraging expert insurance back-office outsourcing.

What are the market trends shaping the Insurance Business Process Outsourcing (BPO) Industry?

  • A key market trend is the expansion of specialized managed services designed to address niche and emerging risks. This includes areas such as cyber liability, parametric climate coverage, and decentralized finance protection.

  • A significant market trend is the expansion of specialized managed services tailored for niche risk categories, moving the industry toward knowledge process outsourcing (KPO). Insurers are partnering with providers for cyber liability administration and parametric insurance support to address complex, data-intensive underwriting and claims scenarios.
  • This shift toward outsourcing underwriting solutions enables a 30% faster launch time for new parametric products by leveraging external expertise and pre-built technology stacks. The emphasis on operational resilience is also driving the adoption of multi-sourced sovereign clouds to meet stringent data residency rules.
  • Concurrently, firms utilizing specialized BPO services for cyber risk management report a 40% reduction in incident response times, highlighting the value of dedicated expertise in a volatile threat landscape. This evolution signifies a move toward strategic partnerships focused on innovation and risk specialization, enabled by advanced insurance data analytics.

What challenges does the Insurance Business Process Outsourcing (BPO) Industry face during its growth?

  • A key challenge affecting industry growth is the presence of obstacles related to digital transformation and legacy system integration.

  • A primary market challenge is the technical friction associated with legacy system integration. Many established insurers operate on antiquated core systems, creating significant compatibility issues when attempting to connect with modern, cloud-native platforms used by BPO providers.
  • This technical debt hinders the seamless implementation of robotic process automation (RPA) and straight-through processing (STP), with integration projects involving legacy systems often overrunning budgets by an average of 35%. The resulting data silos can delay critical decision-making processes by up to two weeks, diminishing the intended efficiency gains from outsourcing.
  • This obstacle complicates digital transformation services and the adoption of advanced solutions like customer lifecycle management, requiring a comprehensive modernization strategy to unlock the full potential of BPO partnerships and avoid further loss adjustment expense reduction.

Exclusive Technavio Analysis on Customer Landscape

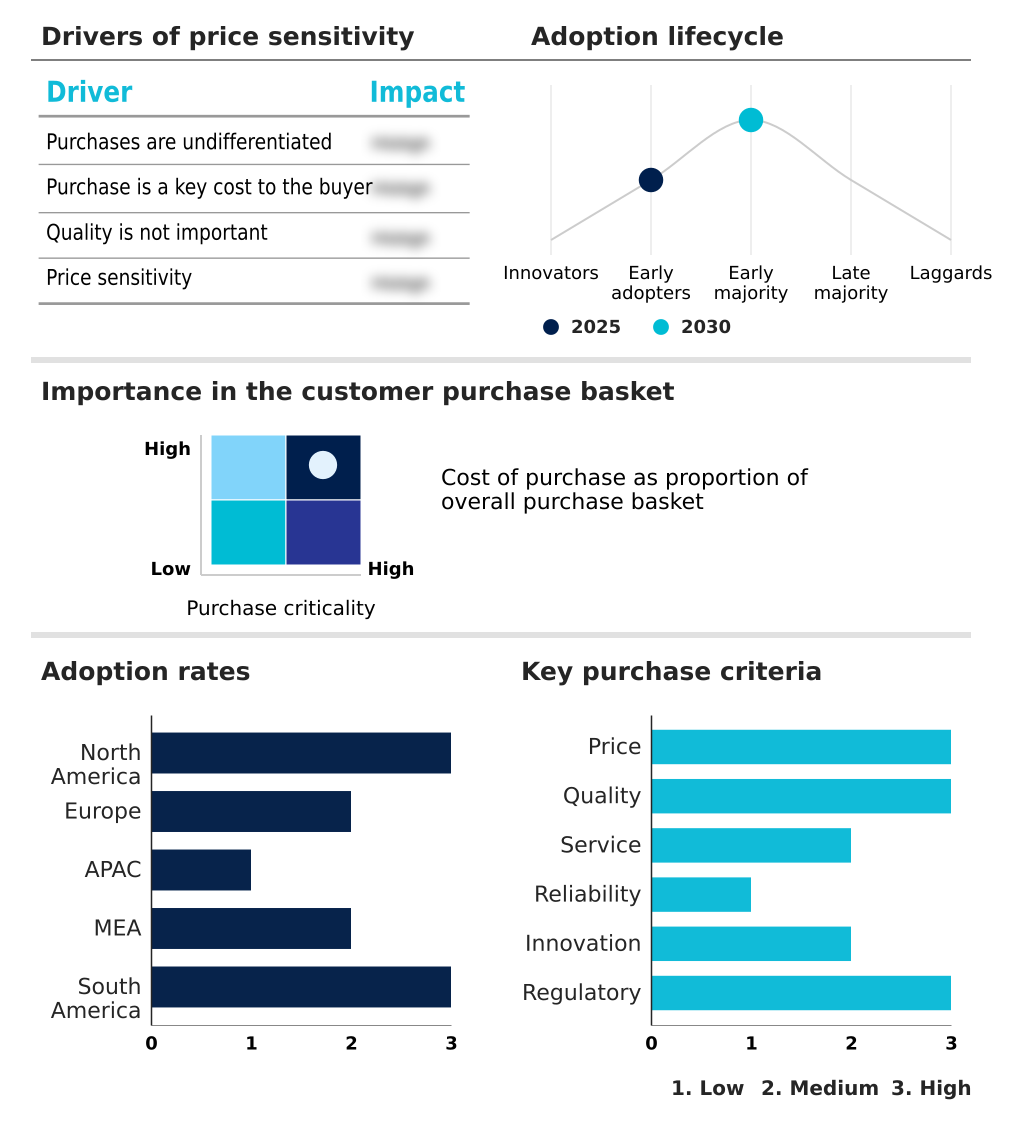
The insurance business process outsourcing (bpo) market forecasting report includes the adoption lifecycle of the market, covering from the innovator’s stage to the laggard’s stage. It focuses on adoption rates in different regions based on penetration. Furthermore, the insurance business process outsourcing (bpo) market report also includes key purchase criteria and drivers of price sensitivity to help companies evaluate and develop their market growth analysis strategies.

Customer Landscape of Insurance Business Process Outsourcing (BPO) Industry

Competitive Landscape

Companies are implementing various strategies, such as strategic alliances, insurance business process outsourcing (bpo) market forecast, partnerships, mergers and acquisitions, geographical expansion, and product/service launches, to enhance their presence in the industry.

Accenture Plc - Delivers insurance BPO services, including claims processing and policy administration, driving digital transformation for life, health, and property insurers.

The industry research and growth report includes detailed analyses of the competitive landscape of the market and information about key companies, including:

  • Accenture Plc
  • Capgemini SE
  • Cogneesol BPO Pvt. Ltd.
  • Cognizant Technology Solution
  • Concentrix Corp.
  • DXC Technology Co.
  • ExlService Holdings Inc.
  • Genpact Ltd.
  • HCL Technologies Ltd.
  • Hinduja Global Solutions Ltd.
  • Infosys BPM Ltd.
  • Invensis Technologies Pvt. Ltd.
  • Mphasis Ltd.
  • NTT DATA Corp.
  • Solartis LLC
  • Tata Consultancy Services
  • Tech Mahindra Ltd.
  • Teleperformance SE
  • Wipro Ltd.
  • WNS Holdings Ltd.

Qualitative and quantitative analysis of companies has been conducted to help clients understand the wider business environment as well as the strengths and weaknesses of key industry players. Data is qualitatively analyzed to categorize companies as pure play, category-focused, industry-focused, and diversified; it is quantitatively analyzed to categorize companies as dominant, leading, strong, tentative, and weak.

Recent Development and News in Insurance business process outsourcing (bpo) market

  • In March 2025, Accenture acquired Altus Consulting, a UK-based specialist consultancy, to bolster its capabilities in delivering end-to-end digital transformation solutions for financial services and insurance clients.
  • In November 2024, Genpact announced a strategic partnership with a leading AI firm to co-develop an autonomous claims processing platform, aiming to reduce manual intervention in low-complexity property claims by up to 80%.
  • In September 2024, Infosys announced a definitive agreement to acquire Stratus, a technology solutions provider specializing in the property and casualty insurance sector, to integrate its Guidewire platform expertise with Infosys's AI and cloud offerings.
  • In January 2025, WNS (Holdings) Ltd. launched a new AI-powered underwriting support service designed to help life insurers analyze alternative data sources, improving risk assessment accuracy and accelerating policy issuance.

Dive into Technavio’s robust research methodology, blending expert interviews, extensive data synthesis, and validated models for unparalleled Insurance Business Process Outsourcing (BPO) Market insights. See full methodology.

Market Scope
Page number 300
Base year 2025
Historic period 2020-2024
Forecast period 2026-2030
Growth momentum & CAGR Accelerate at a CAGR of 4.3%
Market growth 2026-2030 USD 1632.1 million
Market structure Fragmented
YoY growth 2025-2026(%) 4.1%
Key countries US, Canada, Mexico, UK, Germany, France, Italy, Poland, The Netherlands, India, China, Japan, Philippines, Australia, South Korea, UAE, Saudi Arabia, South Africa, Egypt, Kenya, Brazil, Argentina and Colombia
Competitive landscape Leading Companies, Market Positioning of Companies, Competitive Strategies, and Industry Risks

Request Free Sample

Research Analyst Overview

  • The insurance business process outsourcing (BPO) market has matured beyond simple labor arbitrage, evolving into a landscape of strategic partnerships focused on deep digital integration. Insurers now leverage claims processing automation, sophisticated policy administration systems, and robotic process automation (RPA) to drive efficiency and enhance customer experiences.
  • The adoption of generative AI in insurance operations is a pivotal trend, compelling executive leadership to re-evaluate long-term IT investment strategies and decide between building in-house capabilities or relying on specialized partners for comprehensive digital transformation services. Key enablers include advanced fraud detection, predictive analytics for insurance, and the implementation of cloud-native insurance platforms that offer superior agility.
  • Partnerships focused on actuarial data management have enabled some carriers to improve loss ratio prediction accuracy by as much as 15%. This transition toward knowledge process outsourcing (KPO) and human-centric service design, supported by virtual agent implementation and back-office insurance operations, underscores the market's shift toward delivering tangible business value rather than mere cost savings.

What are the Key Data Covered in this Insurance Business Process Outsourcing (BPO) Market Research and Growth Report?

  • What is the expected growth of the Insurance Business Process Outsourcing (BPO) Market between 2026 and 2030?

    • USD 1.63 billion, at a CAGR of 4.3%

  • What segmentation does the market report cover?

    • The report is segmented by Application (Life and pension, and Property and casualty), End-user (Insurance companies, and Brokers and agents), Type (Claims management, Customer service, Policy administration, IT and technological support, and Others) and Geography (North America, Europe, APAC, Middle East and Africa, South America)

  • Which regions are analyzed in the report?

    • North America, Europe, APAC, Middle East and Africa and South America

  • What are the key growth drivers and market challenges?

    • Rising imperative for scalable pension and retirement risk transfer solutions, Digital transformation and legacy system integration obstacles

  • Who are the major players in the Insurance Business Process Outsourcing (BPO) Market?

    • Accenture Plc, Capgemini SE, Cogneesol BPO Pvt. Ltd., Cognizant Technology Solution, Concentrix Corp., DXC Technology Co., ExlService Holdings Inc., Genpact Ltd., HCL Technologies Ltd., Hinduja Global Solutions Ltd., Infosys BPM Ltd., Invensis Technologies Pvt. Ltd., Mphasis Ltd., NTT DATA Corp., Solartis LLC, Tata Consultancy Services, Tech Mahindra Ltd., Teleperformance SE, Wipro Ltd. and WNS Holdings Ltd.

Market Research Insights

  • The market dynamic is shifting from labor arbitrage to value-driven partnerships, where insurance IT outsourcing drives measurable outcomes. Third-party policy servicing and intelligent automation in insurance are central to modernizing operations. For example, firms leveraging digital claims management have reported a 40% reduction in processing times.
  • Concurrently, AI-powered consulting is reshaping strategies, with carriers that adopt comprehensive technology transformation programs showing a 25% improvement in operational efficiency. Customer experience (CX) outsourcing initiatives are also critical, contributing to a 15-point average increase in policyholder satisfaction scores by providing seamless, omnichannel support.
  • This evolution underscores a strategic move toward specialized insurance operations management to achieve both cost control and competitive differentiation in a rapidly changing landscape.

We can help! Our analysts can customize this insurance business process outsourcing (bpo) market research report to meet your requirements.

Get in touch

1. Executive Summary

1.1 Market overview

Executive Summary - Chart on Market Overview
Executive Summary - Data Table on Market Overview
Executive Summary - Chart on Global Market Characteristics
Executive Summary - Chart on Market by Geography
Executive Summary - Chart on Market Segmentation by Application
Executive Summary - Chart on Market Segmentation by End-user
Executive Summary - Chart on Market Segmentation by Type
Executive Summary - Chart on Incremental Growth
Executive Summary - Data Table on Incremental Growth
Executive Summary - Chart on Company Market Positioning

2. Technavio Analysis

2.1 Analysis of price sensitivity, lifecycle, customer purchase basket, adoption rates, and purchase criteria

2.2 Criticality of inputs and Factors of differentiation

Chart on Overview on criticality of inputs and factors of differentiation

2.3 Factors of disruption

Chart on Overview on factors of disruption

2.4 Impact of drivers and challenges

Chart on Impact of drivers and challenges in 2025 and 2030

3. Market Landscape

3.1 Market ecosystem

Chart on Parent Market
Data Table on - Parent Market

3.2 Market characteristics

Chart on Market characteristics analysis

3.3 Value chain analysis

Chart on Value chain analysis

4. Market Sizing

4.1 Market definition

Data Table on Offerings of companies included in the market definition

4.2 Market segment analysis

Market segments

4.3 Market size 2025

4.4 Market outlook: Forecast for 2025-2030

Chart on Global - Market size and forecast 2025-2030 ($ million)
Data Table on Global - Market size and forecast 2025-2030 ($ million)
Chart on Global Market: Year-over-year growth 2025-2030 (%)
Data Table on Global Market: Year-over-year growth 2025-2030 (%)

5. Historic Market Size

5.1 Global Insurance Business Process Outsourcing (BPO) Market 2020 - 2024

Historic Market Size - Data Table on Global Insurance Business Process Outsourcing (BPO) Market 2020 - 2024 ($ million)

5.2 Application segment analysis 2020 - 2024

Historic Market Size - Application Segment 2020 - 2024 ($ million)

5.3 End-user segment analysis 2020 - 2024

Historic Market Size - End-user Segment 2020 - 2024 ($ million)

5.4 Type segment analysis 2020 - 2024

Historic Market Size - Type Segment 2020 - 2024 ($ million)

5.5 Geography segment analysis 2020 - 2024

Historic Market Size - Geography Segment 2020 - 2024 ($ million)

5.6 Country segment analysis 2020 - 2024

Historic Market Size - Country Segment 2020 - 2024 ($ million)

6. Qualitative Analysis

6.1 Impact of AI on global insurance business process outsourcing (BPO) market

6.2 Impact of geopolitical conflicts on global insurance business process outsourcing (BPO) market

7. Five Forces Analysis

7.1 Five forces summary

Five forces analysis - Comparison between 2025 and 2030

7.2 Bargaining power of buyers

Bargaining power of buyers - Impact of key factors 2025 and 2030

7.3 Bargaining power of suppliers

Bargaining power of suppliers - Impact of key factors in 2025 and 2030

7.4 Threat of new entrants

Threat of new entrants - Impact of key factors in 2025 and 2030

7.5 Threat of substitutes

Threat of substitutes - Impact of key factors in 2025 and 2030

7.6 Threat of rivalry

Threat of rivalry - Impact of key factors in 2025 and 2030

7.7 Market condition

Chart on Market condition - Five forces 2025 and 2030

8. Market Segmentation by Application

8.1 Market segments

Chart on Application - Market share 2025-2030 (%)
Data Table on Application - Market share 2025-2030 (%)

8.2 Comparison by Application

Chart on Comparison by Application
Data Table on Comparison by Application

8.3 Life and pension - Market size and forecast 2025-2030

Chart on Life and pension - Market size and forecast 2025-2030 ($ million)
Data Table on Life and pension - Market size and forecast 2025-2030 ($ million)
Chart on Life and pension - Year-over-year growth 2025-2030 (%)
Data Table on Life and pension - Year-over-year growth 2025-2030 (%)

8.4 Property and casualty - Market size and forecast 2025-2030

Chart on Property and casualty - Market size and forecast 2025-2030 ($ million)
Data Table on Property and casualty - Market size and forecast 2025-2030 ($ million)
Chart on Property and casualty - Year-over-year growth 2025-2030 (%)
Data Table on Property and casualty - Year-over-year growth 2025-2030 (%)

8.5 Market opportunity by Application

Market opportunity by Application ($ million)
Data Table on Market opportunity by Application ($ million)

9. Market Segmentation by End-user

9.1 Market segments

Chart on End-user - Market share 2025-2030 (%)
Data Table on End-user - Market share 2025-2030 (%)

9.2 Comparison by End-user

Chart on Comparison by End-user
Data Table on Comparison by End-user

9.3 Insurance companies - Market size and forecast 2025-2030

Chart on Insurance companies - Market size and forecast 2025-2030 ($ million)
Data Table on Insurance companies - Market size and forecast 2025-2030 ($ million)
Chart on Insurance companies - Year-over-year growth 2025-2030 (%)
Data Table on Insurance companies - Year-over-year growth 2025-2030 (%)

9.4 Brokers and agents - Market size and forecast 2025-2030

Chart on Brokers and agents - Market size and forecast 2025-2030 ($ million)
Data Table on Brokers and agents - Market size and forecast 2025-2030 ($ million)
Chart on Brokers and agents - Year-over-year growth 2025-2030 (%)
Data Table on Brokers and agents - Year-over-year growth 2025-2030 (%)

9.5 Market opportunity by End-user

Market opportunity by End-user ($ million)
Data Table on Market opportunity by End-user ($ million)

10. Market Segmentation by Type

10.1 Market segments

Chart on Type - Market share 2025-2030 (%)
Data Table on Type - Market share 2025-2030 (%)

10.2 Comparison by Type

Chart on Comparison by Type
Data Table on Comparison by Type

10.3 Claims management - Market size and forecast 2025-2030

Chart on Claims management - Market size and forecast 2025-2030 ($ million)
Data Table on Claims management - Market size and forecast 2025-2030 ($ million)
Chart on Claims management - Year-over-year growth 2025-2030 (%)
Data Table on Claims management - Year-over-year growth 2025-2030 (%)

10.4 Customer service - Market size and forecast 2025-2030

Chart on Customer service - Market size and forecast 2025-2030 ($ million)
Data Table on Customer service - Market size and forecast 2025-2030 ($ million)
Chart on Customer service - Year-over-year growth 2025-2030 (%)
Data Table on Customer service - Year-over-year growth 2025-2030 (%)

10.5 Policy administration - Market size and forecast 2025-2030

Chart on Policy administration - Market size and forecast 2025-2030 ($ million)
Data Table on Policy administration - Market size and forecast 2025-2030 ($ million)
Chart on Policy administration - Year-over-year growth 2025-2030 (%)
Data Table on Policy administration - Year-over-year growth 2025-2030 (%)

10.6 IT and technological support - Market size and forecast 2025-2030

Chart on IT and technological support - Market size and forecast 2025-2030 ($ million)
Data Table on IT and technological support - Market size and forecast 2025-2030 ($ million)
Chart on IT and technological support - Year-over-year growth 2025-2030 (%)
Data Table on IT and technological support - Year-over-year growth 2025-2030 (%)

10.7 Others - Market size and forecast 2025-2030

Chart on Others - Market size and forecast 2025-2030 ($ million)
Data Table on Others - Market size and forecast 2025-2030 ($ million)
Chart on Others - Year-over-year growth 2025-2030 (%)
Data Table on Others - Year-over-year growth 2025-2030 (%)

10.8 Market opportunity by Type

Market opportunity by Type ($ million)
Data Table on Market opportunity by Type ($ million)

11. Customer Landscape

11.1 Customer landscape overview

Analysis of price sensitivity, lifecycle, customer purchase basket, adoption rates, and purchase criteria

12. Geographic Landscape

12.1 Geographic segmentation

Chart on Market share by geography 2025-2030 (%)
Data Table on Market share by geography 2025-2030 (%)

12.2 Geographic comparison

Chart on Geographic comparison
Data Table on Geographic comparison

12.3 North America - Market size and forecast 2025-2030

Chart on North America - Market size and forecast 2025-2030 ($ million)
Data Table on North America - Market size and forecast 2025-2030 ($ million)
Chart on North America - Year-over-year growth 2025-2030 (%)
Data Table on North America - Year-over-year growth 2025-2030 (%)
Chart on Regional Comparison - North America
Data Table on Regional Comparison - North America

12.3.1 US - Market size and forecast 2025-2030

Chart on US - Market size and forecast 2025-2030 ($ million)
Data Table on US - Market size and forecast 2025-2030 ($ million)
Chart on US - Year-over-year growth 2025-2030 (%)
Data Table on US - Year-over-year growth 2025-2030 (%)

12.3.2 Canada - Market size and forecast 2025-2030

Chart on Canada - Market size and forecast 2025-2030 ($ million)
Data Table on Canada - Market size and forecast 2025-2030 ($ million)
Chart on Canada - Year-over-year growth 2025-2030 (%)
Data Table on Canada - Year-over-year growth 2025-2030 (%)

12.3.3 Mexico - Market size and forecast 2025-2030

Chart on Mexico - Market size and forecast 2025-2030 ($ million)
Data Table on Mexico - Market size and forecast 2025-2030 ($ million)
Chart on Mexico - Year-over-year growth 2025-2030 (%)
Data Table on Mexico - Year-over-year growth 2025-2030 (%)

12.4 Europe - Market size and forecast 2025-2030

Chart on Europe - Market size and forecast 2025-2030 ($ million)
Data Table on Europe - Market size and forecast 2025-2030 ($ million)
Chart on Europe - Year-over-year growth 2025-2030 (%)
Data Table on Europe - Year-over-year growth 2025-2030 (%)
Chart on Regional Comparison - Europe
Data Table on Regional Comparison - Europe

12.4.1 UK - Market size and forecast 2025-2030

Chart on UK - Market size and forecast 2025-2030 ($ million)
Data Table on UK - Market size and forecast 2025-2030 ($ million)
Chart on UK - Year-over-year growth 2025-2030 (%)
Data Table on UK - Year-over-year growth 2025-2030 (%)

12.4.2 Germany - Market size and forecast 2025-2030

Chart on Germany - Market size and forecast 2025-2030 ($ million)
Data Table on Germany - Market size and forecast 2025-2030 ($ million)
Chart on Germany - Year-over-year growth 2025-2030 (%)
Data Table on Germany - Year-over-year growth 2025-2030 (%)

12.4.3 France - Market size and forecast 2025-2030

Chart on France - Market size and forecast 2025-2030 ($ million)
Data Table on France - Market size and forecast 2025-2030 ($ million)
Chart on France - Year-over-year growth 2025-2030 (%)
Data Table on France - Year-over-year growth 2025-2030 (%)

12.4.4 Italy - Market size and forecast 2025-2030

Chart on Italy - Market size and forecast 2025-2030 ($ million)
Data Table on Italy - Market size and forecast 2025-2030 ($ million)
Chart on Italy - Year-over-year growth 2025-2030 (%)
Data Table on Italy - Year-over-year growth 2025-2030 (%)

12.4.5 Poland - Market size and forecast 2025-2030

Chart on Poland - Market size and forecast 2025-2030 ($ million)
Data Table on Poland - Market size and forecast 2025-2030 ($ million)
Chart on Poland - Year-over-year growth 2025-2030 (%)
Data Table on Poland - Year-over-year growth 2025-2030 (%)

12.4.6 The Netherlands - Market size and forecast 2025-2030

Chart on The Netherlands - Market size and forecast 2025-2030 ($ million)
Data Table on The Netherlands - Market size and forecast 2025-2030 ($ million)
Chart on The Netherlands - Year-over-year growth 2025-2030 (%)
Data Table on The Netherlands - Year-over-year growth 2025-2030 (%)

12.5 APAC - Market size and forecast 2025-2030

Chart on APAC - Market size and forecast 2025-2030 ($ million)
Data Table on APAC - Market size and forecast 2025-2030 ($ million)
Chart on APAC - Year-over-year growth 2025-2030 (%)
Data Table on APAC - Year-over-year growth 2025-2030 (%)
Chart on Regional Comparison - APAC
Data Table on Regional Comparison - APAC

12.5.1 India - Market size and forecast 2025-2030

Chart on India - Market size and forecast 2025-2030 ($ million)
Data Table on India - Market size and forecast 2025-2030 ($ million)
Chart on India - Year-over-year growth 2025-2030 (%)
Data Table on India - Year-over-year growth 2025-2030 (%)

12.5.2 China - Market size and forecast 2025-2030

Chart on China - Market size and forecast 2025-2030 ($ million)
Data Table on China - Market size and forecast 2025-2030 ($ million)
Chart on China - Year-over-year growth 2025-2030 (%)
Data Table on China - Year-over-year growth 2025-2030 (%)

12.5.3 Japan - Market size and forecast 2025-2030

Chart on Japan - Market size and forecast 2025-2030 ($ million)
Data Table on Japan - Market size and forecast 2025-2030 ($ million)
Chart on Japan - Year-over-year growth 2025-2030 (%)
Data Table on Japan - Year-over-year growth 2025-2030 (%)

12.5.4 Philippines - Market size and forecast 2025-2030

Chart on Philippines - Market size and forecast 2025-2030 ($ million)
Data Table on Philippines - Market size and forecast 2025-2030 ($ million)
Chart on Philippines - Year-over-year growth 2025-2030 (%)
Data Table on Philippines - Year-over-year growth 2025-2030 (%)

12.5.5 Australia - Market size and forecast 2025-2030

Chart on Australia - Market size and forecast 2025-2030 ($ million)
Data Table on Australia - Market size and forecast 2025-2030 ($ million)
Chart on Australia - Year-over-year growth 2025-2030 (%)
Data Table on Australia - Year-over-year growth 2025-2030 (%)

12.5.6 South Korea - Market size and forecast 2025-2030

Chart on South Korea - Market size and forecast 2025-2030 ($ million)
Data Table on South Korea - Market size and forecast 2025-2030 ($ million)
Chart on South Korea - Year-over-year growth 2025-2030 (%)
Data Table on South Korea - Year-over-year growth 2025-2030 (%)

12.6 Middle East and Africa - Market size and forecast 2025-2030

Chart on Middle East and Africa - Market size and forecast 2025-2030 ($ million)
Data Table on Middle East and Africa - Market size and forecast 2025-2030 ($ million)
Chart on Middle East and Africa - Year-over-year growth 2025-2030 (%)
Data Table on Middle East and Africa - Year-over-year growth 2025-2030 (%)
Chart on Regional Comparison - Middle East and Africa
Data Table on Regional Comparison - Middle East and Africa

12.6.1 UAE - Market size and forecast 2025-2030

Chart on UAE - Market size and forecast 2025-2030 ($ million)
Data Table on UAE - Market size and forecast 2025-2030 ($ million)
Chart on UAE - Year-over-year growth 2025-2030 (%)
Data Table on UAE - Year-over-year growth 2025-2030 (%)

12.6.2 Saudi Arabia - Market size and forecast 2025-2030

Chart on Saudi Arabia - Market size and forecast 2025-2030 ($ million)
Data Table on Saudi Arabia - Market size and forecast 2025-2030 ($ million)
Chart on Saudi Arabia - Year-over-year growth 2025-2030 (%)
Data Table on Saudi Arabia - Year-over-year growth 2025-2030 (%)

12.6.3 South Africa - Market size and forecast 2025-2030

Chart on South Africa - Market size and forecast 2025-2030 ($ million)
Data Table on South Africa - Market size and forecast 2025-2030 ($ million)
Chart on South Africa - Year-over-year growth 2025-2030 (%)
Data Table on South Africa - Year-over-year growth 2025-2030 (%)

12.6.4 Egypt - Market size and forecast 2025-2030

Chart on Egypt - Market size and forecast 2025-2030 ($ million)
Data Table on Egypt - Market size and forecast 2025-2030 ($ million)
Chart on Egypt - Year-over-year growth 2025-2030 (%)
Data Table on Egypt - Year-over-year growth 2025-2030 (%)

12.6.5 Kenya - Market size and forecast 2025-2030

Chart on Kenya - Market size and forecast 2025-2030 ($ million)
Data Table on Kenya - Market size and forecast 2025-2030 ($ million)
Chart on Kenya - Year-over-year growth 2025-2030 (%)
Data Table on Kenya - Year-over-year growth 2025-2030 (%)

12.7 South America - Market size and forecast 2025-2030

Chart on South America - Market size and forecast 2025-2030 ($ million)
Data Table on South America - Market size and forecast 2025-2030 ($ million)
Chart on South America - Year-over-year growth 2025-2030 (%)
Data Table on South America - Year-over-year growth 2025-2030 (%)
Chart on Regional Comparison - South America
Data Table on Regional Comparison - South America

12.7.1 Brazil - Market size and forecast 2025-2030

Chart on Brazil - Market size and forecast 2025-2030 ($ million)
Data Table on Brazil - Market size and forecast 2025-2030 ($ million)
Chart on Brazil - Year-over-year growth 2025-2030 (%)
Data Table on Brazil - Year-over-year growth 2025-2030 (%)

12.7.2 Argentina - Market size and forecast 2025-2030

Chart on Argentina - Market size and forecast 2025-2030 ($ million)
Data Table on Argentina - Market size and forecast 2025-2030 ($ million)
Chart on Argentina - Year-over-year growth 2025-2030 (%)
Data Table on Argentina - Year-over-year growth 2025-2030 (%)

12.7.3 Colombia - Market size and forecast 2025-2030

Chart on Colombia - Market size and forecast 2025-2030 ($ million)
Data Table on Colombia - Market size and forecast 2025-2030 ($ million)
Chart on Colombia - Year-over-year growth 2025-2030 (%)
Data Table on Colombia - Year-over-year growth 2025-2030 (%)

12.8 Market opportunity by geography

Market opportunity by geography ($ million)
Data Tables on Market opportunity by geography ($ million)

13. Drivers, Challenges, and Opportunity

13.1 Market drivers

Rising imperative for scalable pension and retirement risk transfer solutions
Integration of advanced fraud detection and predictive analytics
Adoption of empathy driven operational models and human centric service design

13.2 Market challenges

Digital transformation and legacy system integration obstacles
Heightened regulatory compliance and data sovereignty requirements
Talent deficit and workforce productivity crisis

13.3 Impact of drivers and challenges

Impact of drivers and challenges in 2025 and 2030

13.4 Market opportunities

Expansion of specialized managed services for niche and emerging risks
Heightened emphasis on operational resilience and multi sourced sovereign clouds
Critical need for institutional knowledge preservation and workforce transition support

14. Competitive Landscape

14.1 Overview

14.2

Overview on criticality of inputs and factors of differentiation

14.3 Landscape disruption

Overview on factors of disruption

14.4 Industry risks

Impact of key risks on business

15. Competitive Analysis

15.1 Companies profiled

Companies covered

15.2 Company ranking index

15.3 Market positioning of companies

Matrix on companies position and classification

15.4 Accenture Plc

Accenture Plc - Overview
Accenture Plc - Business segments
Accenture Plc - Key news
Accenture Plc - Key offerings
Accenture Plc - Segment focus
SWOT

15.5 Capgemini SE

Capgemini SE - Overview
Capgemini SE - Business segments
Capgemini SE - Key news
Capgemini SE - Key offerings
Capgemini SE - Segment focus
SWOT

15.6 Concentrix Corp.

Concentrix Corp. - Overview
Concentrix Corp. - Product / Service
Concentrix Corp. - Key offerings
SWOT

15.7 DXC Technology Co.

DXC Technology Co. - Overview
DXC Technology Co. - Business segments
DXC Technology Co. - Key news
DXC Technology Co. - Key offerings
DXC Technology Co. - Segment focus
SWOT

15.8 ExlService Holdings Inc.

ExlService Holdings Inc. - Overview
ExlService Holdings Inc. - Business segments
ExlService Holdings Inc. - Key offerings
ExlService Holdings Inc. - Segment focus
SWOT

15.9 Genpact Ltd.

Genpact Ltd. - Overview
Genpact Ltd. - Business segments
Genpact Ltd. - Key offerings
Genpact Ltd. - Segment focus
SWOT

15.10 HCL Technologies Ltd.

HCL Technologies Ltd. - Overview
HCL Technologies Ltd. - Business segments
HCL Technologies Ltd. - Key offerings
HCL Technologies Ltd. - Segment focus
SWOT

15.11 Hinduja Global Solutions Ltd.

Hinduja Global Solutions Ltd. - Overview
Hinduja Global Solutions Ltd. - Product / Service
Hinduja Global Solutions Ltd. - Key offerings
SWOT

15.12 Infosys BPM Ltd.

Infosys BPM Ltd. - Overview
Infosys BPM Ltd. - Business segments
Infosys BPM Ltd. - Key offerings
Infosys BPM Ltd. - Segment focus
SWOT

15.13 Mphasis Ltd.

Mphasis Ltd. - Overview
Mphasis Ltd. - Product / Service
Mphasis Ltd. - Key offerings
SWOT

15.14 NTT DATA Corp.

NTT DATA Corp. - Overview
NTT DATA Corp. - Business segments
NTT DATA Corp. - Key offerings
NTT DATA Corp. - Segment focus
SWOT

15.15 Tata Consultancy Services

Tata Consultancy Services - Overview
Tata Consultancy Services - Business segments
Tata Consultancy Services - Key offerings
Tata Consultancy Services - Segment focus
SWOT

15.16 Tech Mahindra Ltd.

Tech Mahindra Ltd. - Overview
Tech Mahindra Ltd. - Business segments
Tech Mahindra Ltd. - Key offerings
Tech Mahindra Ltd. - Segment focus
SWOT

15.17 Teleperformance SE

Teleperformance SE - Overview
Teleperformance SE - Business segments
Teleperformance SE - Key offerings
Teleperformance SE - Segment focus
SWOT

15.18 Wipro Ltd.

Wipro Ltd. - Overview
Wipro Ltd. - Business segments
Wipro Ltd. - Key news
Wipro Ltd. - Key offerings
Wipro Ltd. - Segment focus
SWOT

16. Appendix

16.1 Scope of the report

Market definition
Objectives
Notes and caveats

16.2 Inclusions and exclusions checklist

Inclusions checklist
Exclusions checklist

16.3 Currency conversion rates for US$

16.4 Research methodology

16.5 Data procurement

Information sources

16.6 Data validation

16.7 Validation techniques employed for market sizing

16.8 Data synthesis

16.9 360 degree market analysis

16.10 List of abbreviations

Research Methodology

Technavio presents a detailed picture of the market by way of study, synthesis, and summation of data from multiple sources. The analysts have presented the various facets of the market with a particular focus on identifying the key industry influencers. The data thus presented is comprehensive, reliable, and the result of extensive research, both primary and secondary.

INFORMATION SOURCES

Primary sources

  • Manufacturers and suppliers
  • Channel partners
  • Industry experts
  • Strategic decision makers

Secondary sources

  • Industry journals and periodicals
  • Government data
  • Financial reports of key industry players
  • Historical data
  • Press releases

DATA ANALYSIS

Data Synthesis

  • Collation of data
  • Estimation of key figures
  • Analysis of derived insights

Data Validation

  • Triangulation with data models
  • Reference against proprietary databases
  • Corroboration with industry experts

REPORT WRITING

Qualitative

  • Market drivers
  • Market challenges
  • Market trends
  • Five forces analysis

Quantitative

  • Market size and forecast
  • Market segmentation
  • Geographical insights
  • Competitive landscape

Interested in this report?

Get your sample now to see our research methodology and insights!

Download Now

Frequently Asked Questions

Insurance Business Process Outsourcing (BPO) market growth will increase by USD 1632.1 million during 2026-2030.

The Insurance Business Process Outsourcing (BPO) market is expected to grow at a CAGR of 4.3% during 2026-2030.

Insurance Business Process Outsourcing (BPO) market is segmented by Application (Life and pension, Property and casualty) End-user (Insurance companies, Brokers and agents) Type (Claims management, Customer service, Policy administration, IT and technological support, Others)

Accenture Plc, Capgemini SE, Cogneesol BPO Pvt. Ltd., Cognizant Technology Solution, Concentrix Corp., DXC Technology Co., ExlService Holdings Inc., Genpact Ltd., HCL Technologies Ltd., Hinduja Global Solutions Ltd., Infosys BPM Ltd., Invensis Technologies Pvt. Ltd., Mphasis Ltd., NTT DATA Corp., Solartis LLC, Tata Consultancy Services, Tech Mahindra Ltd., Teleperformance SE, Wipro Ltd., WNS Holdings Ltd. are a few of the key vendors in the Insurance Business Process Outsourcing (BPO) market.

North America will register the highest growth rate of 46.5% among the other regions. Therefore, the Insurance Business Process Outsourcing (BPO) market in North America is expected to garner significant business opportunities for the vendors during the forecast period.

US, Canada, Mexico, UK, Germany, France, Italy, Poland, The Netherlands, India, China, Japan, Philippines, Australia, South Korea, UAE, Saudi Arabia, South Africa, Egypt, Kenya, Brazil, Argentina, Colombia

  • Rising imperative for scalable pension and retirement risk transfer solutions is the driving factor this market.

The Insurance Business Process Outsourcing (BPO) market vendors should focus on grabbing business opportunities from the Application segment as it accounted for the largest market share in the base year.
RIA - Research AI Assistant
Ask RIA