
Claims Processing Software Market Size 2025-2029
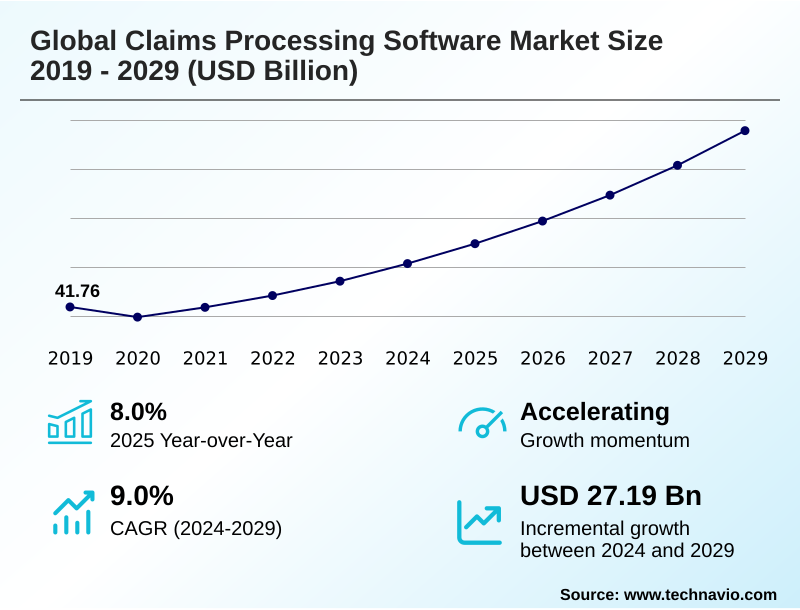
The claims processing software market size is valued to increase by USD 27.19 billion, at a CAGR of 9% from 2024 to 2029. Increasing government regulations on mandatory insurance coverage in developing countries will drive the claims processing software market.
Major Market Trends & Insights
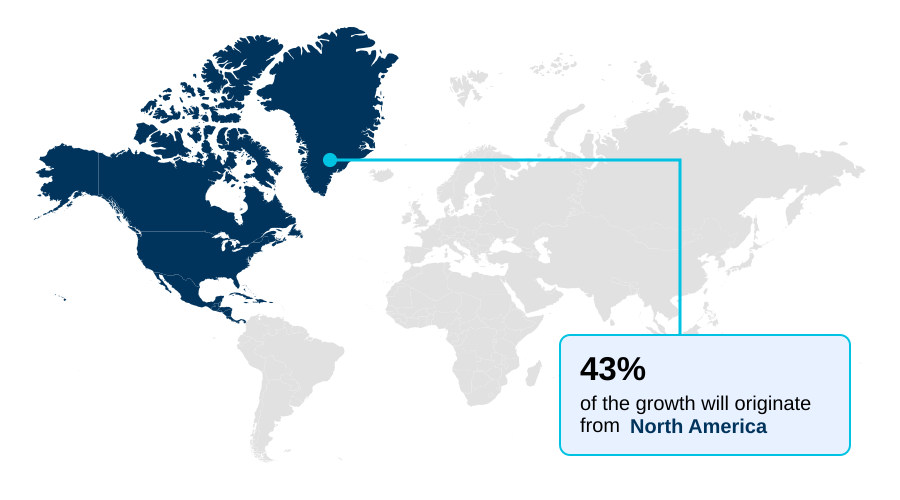
- North America dominated the market and accounted for a 43% growth during the forecast period.
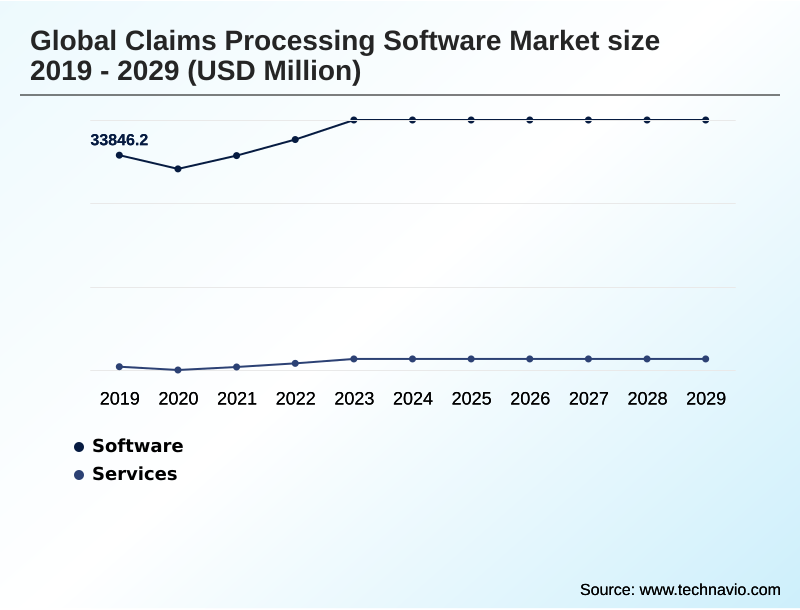
- By Component - Software segment was valued at USD 38.16 billion in 2023
- By Deployment - Cloud-based segment accounted for the largest market revenue share in 2023
Market Size & Forecast
- Market Opportunities: USD 36.06 billion
- Market Future Opportunities: USD 27.19 billion
- CAGR from 2024 to 2029 : 9%
Market Summary
- The claims processing software market is undergoing a significant transformation, driven by the need for greater operational efficiency and accuracy. Organizations are moving away from manual, siloed processes toward integrated platforms that leverage robotic process automation in claims and AI-driven fraud detection.
- A key focus is on streamlining the entire claims lifecycle management, from first notice of loss automation to final settlement. For instance, a property and casualty insurer can deploy a system that uses a rule-based adjudication engine to enable straight-through processing for low-complexity claims, freeing up adjusters to focus on more nuanced cases.
- This approach not only accelerates resolution times but also improves claims payment integrity. The adoption of cloud-native claims platform architectures further enhances scalability and allows for seamless policy administration integration.
- As the industry evolves, the emphasis remains on developing sophisticated yet user-friendly systems that support multi-channel claims intake and provide real-time claims analytics, ultimately enhancing customer satisfaction and reducing operational costs. These advancements in healthcare claims management and complex claims handling are pivotal for maintaining a competitive edge.
What will be the Size of the Claims Processing Software Market during the forecast period?
Get Key Insights on Market Forecast (PDF) Get Free Sample
How is the Claims Processing Software Market Segmented?
The claims processing software industry research report provides comprehensive data (region-wise segment analysis), with forecasts and estimates in "USD million" for the period 2025-2029, as well as historical data from 2019-2023 for the following segments.
- Component
- Software
- Services
- Deployment
- Cloud-based
- On-premises
- Industry application
- BFSI
- Healthcare
- IT and telecommunications
- Retail and E-commerce
- Others
- Geography
- North America
- US
- Canada
- Mexico
- Europe
- Germany
- UK
- France
- APAC
- China
- Japan
- India
- South America
- Brazil
- Argentina
- Colombia
- Middle East and Africa
- Saudi Arabia
- UAE
- South Africa
- Rest of World (ROW)
- North America
By Component Insights
The software segment is estimated to witness significant growth during the forecast period.
The software segment is central to the claims processing software market, providing foundational tools for automation and intelligent decision-making. These platforms are engineered to deliver immediate ROI by unifying disparate data sources and streamlining complex operations.
Core functionalities facilitate a rule-based adjudication engine and enhance claims workflow optimization, allowing organizations to configure dynamic business rules.
This leads to the consistent application of standards across the enterprise, with integrated claims data validation techniques improving data accuracy by over 15%. By creating a cohesive API-driven insurance ecosystem, businesses achieve significant gains in claims operational efficiency.
This supports end-to-end claims automation and legacy system modernization initiatives, including litigation management software and claims payment accuracy, while enabling robust claims auditing and reporting.
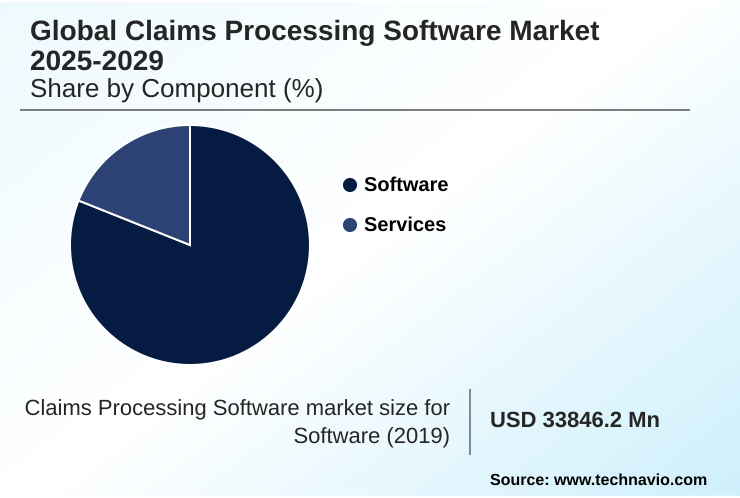
The Software segment was valued at USD 38.16 billion in 2023 and showed a gradual increase during the forecast period.
Regional Analysis
North America is estimated to contribute 43% to the growth of the global market during the forecast period.Technavio’s analysts have elaborately explained the regional trends and drivers that shape the market during the forecast period.
See How Claims Processing Software Market Demand is Rising in North America Get Free Sample
The geographic landscape of the claims processing software market is led by North America, which accounts for 43% of the market's incremental growth, driven by high technology adoption and complex regulatory environments.
In this region, the adoption of automated systems for healthcare claims management has led to a 20% reduction in claims processing costs. Europe and APAC follow as significant markets, with growing investments in digital transformation.
The implementation of robust platforms for property and casualty claims and catastrophe claims management is critical in these mature markets. Key technologies enabling this leadership include systems for regulatory compliance automation and complex claims handling.
Regional success is increasingly tied to deploying HIPAA compliant claims software in North America and ensuring GDPR in claims processing within Europe, alongside capabilities for real-time claims tracking and efficient claims TPA platforms.
Market Dynamics
Our researchers analyzed the data with 2024 as the base year, along with the key drivers, trends, and challenges. A holistic analysis of drivers will help companies refine their marketing strategies to gain a competitive advantage.
- For organizations seeking to understand how to automate insurance claims processing, the focus has shifted toward integrated digital platforms. Evaluating the benefits of cloud-based claims software reveals significant advantages in scalability and accessibility over traditional systems, addressing key challenges in on-premises claims systems. A pivotal technology is AI for fraud detection in healthcare claims, which is now a critical feature.
- Best practices for claims lifecycle management emphasize a holistic approach, from intake to settlement. A primary goal is improving claims settlement turnaround time, which directly impacts customer satisfaction. Specialized software for property and casualty claims is evolving with new features to handle complex scenarios. When comparing cloud vs on-premise claims solutions, businesses must weigh security, cost, and maintenance.
- The role of RPA in claims adjudication is to automate repetitive tasks, enabling faster processing. Optimizing claims workflow with software involves mapping out each stage to identify bottlenecks. Modern claims processing software for TPAs must offer multi-tenant capabilities and flexible reporting. In healthcare, it is crucial to have software to automate denial management and to ensure claims payment integrity.
- Furthermore, compliance requirements for claims software are non-negotiable, demanding built-in adherence to industry regulations. Technology for subrogation and recovery can recoup costs more effectively, with platforms offering advanced analytics demonstrating up to 10% higher recovery rates than those without.
- Key considerations include how to improve first notice of loss and understanding the top claims processing software features, such as using analytics to reduce claims leakage.
What are the key market drivers leading to the rise in the adoption of Claims Processing Software Industry?
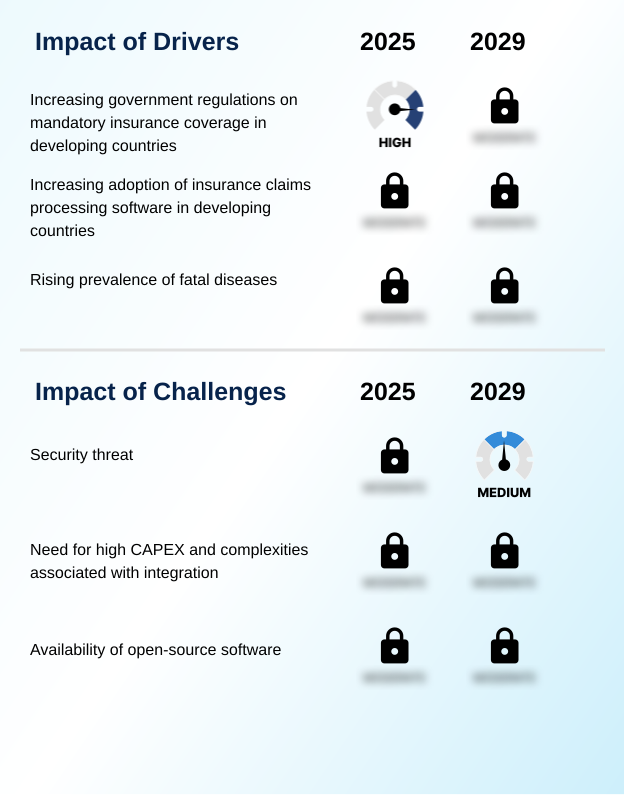
- A key market driver is the proliferation of government regulations mandating insurance coverage in developing nations, which expands the customer base and necessitates efficient claims infrastructure.
- A significant driver for the claims processing software market is the increasing enforcement of mandatory insurance regulations in developing economies.
- As governments mandate coverage for vehicles, health, and travel, the volume of claims has surged by over 200% in some regions, making manual processing untenable. This regulatory push necessitates the adoption of scalable platforms for effective insurance claims automation.
- Modern software with built-in regulatory compliance automation reduces compliance reporting errors by over 95%, a crucial capability for navigating diverse legal frameworks. This environment fuels the demand for robust healthcare claims management and first notice of loss automation.
- The market is responding with systems that facilitate claims TPA platforms and denial management software, ensuring that the increasing claim load is managed efficiently while maintaining claims payment integrity and enabling automated underwriting software.
What are the market trends shaping the Claims Processing Software Industry?
- The rapid expansion of the cyber insurance sector is emerging as a significant market trend. This growth is consequently driving the demand for specialized claims processing software to manage the unique complexities of cyber-related claims.
- A primary trend shaping the market is the rapid growth of the cyber insurance sector, which introduces unique and complex claims scenarios. This surge is driving the adoption of specialized platforms capable of advanced digital forensics and breach-response coordination.
- The integration of AI into these platforms has improved threat identification accuracy by over 40%, a critical factor in managing cyber risks. Furthermore, automated systems can process intricate cyber claims up to 60% faster than traditional manual methods. This trend necessitates sophisticated insurance claims automation and real-time claims analytics.
- Effective management requires robust insurance process automation and advanced claims data analytics. Providers are developing digital FNOL solutions and claims subrogation software specifically for this segment, focusing on claims data security and straight-through processing to manage the high volume and complexity of incidents.
What challenges does the Claims Processing Software Industry face during its growth?
- The escalating sophistication of cybersecurity threats targeting sensitive claims data presents a significant challenge to market growth, demanding continuous investment in advanced security protocols.
- The primary challenge confronting the claims processing software market is the escalating sophistication of cybersecurity threats. Data breaches involving sensitive claims information can result in financial penalties averaging 4% of a firm's annual revenue. As a response, systems with end-to-end encryption have become essential, preventing over 99% of unauthorized data access attempts.
- This security imperative drives investment in secure on-premises claims solution and cloud-native claims platform architectures. The challenge is compounded by the need for seamless legacy system modernization without creating new vulnerabilities. Insurers are now prioritizing features like claims data security, automated denial management, and robust beneficiary eligibility verification within their core insurance systems modernization plans.
- This focus is critical for maintaining trust and ensuring compliance across all operations, from claims correspondence automation to medical billing automation.
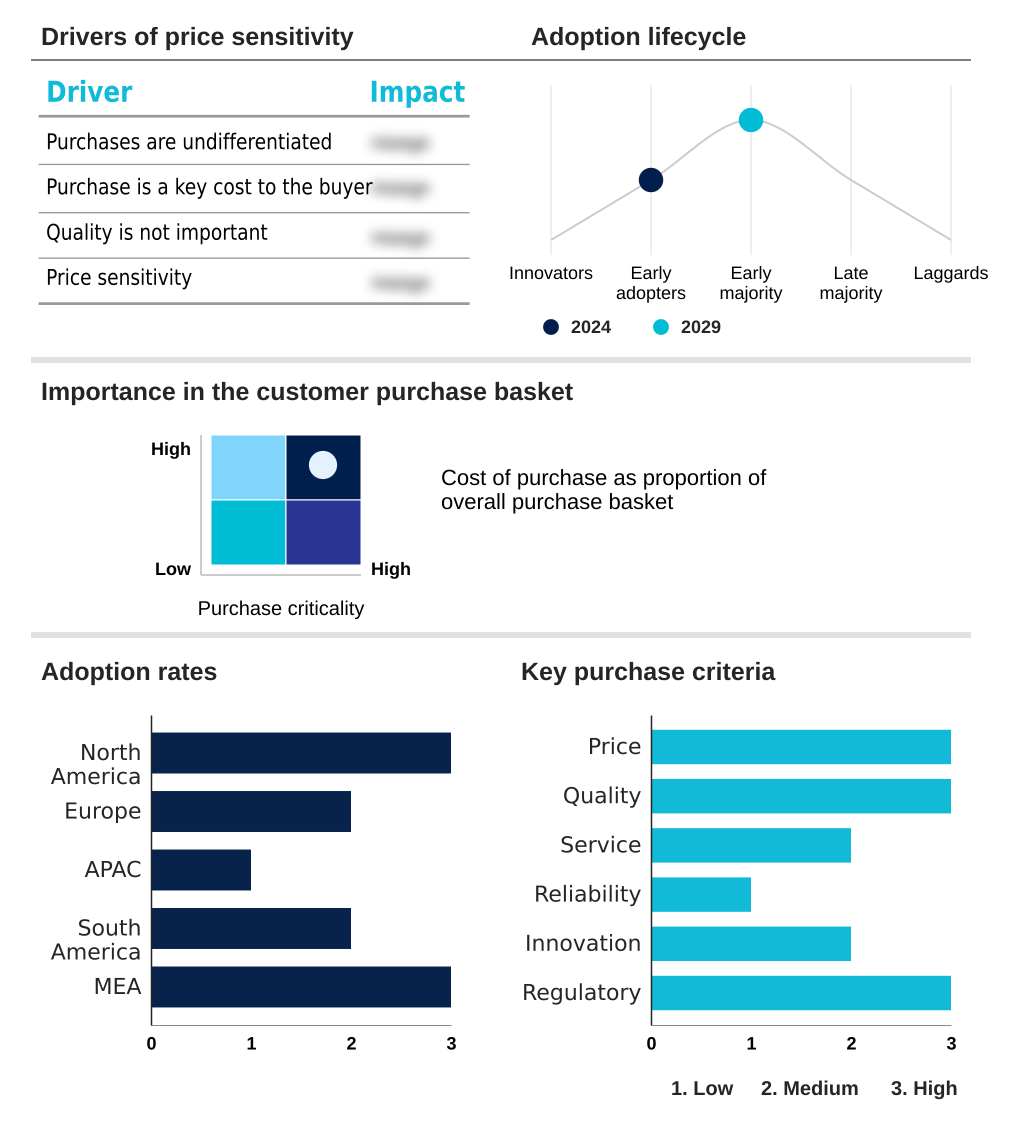
Exclusive Technavio Analysis on Customer Landscape
The claims processing software market forecasting report includes the adoption lifecycle of the market, covering from the innovator’s stage to the laggard’s stage. It focuses on adoption rates in different regions based on penetration. Furthermore, the claims processing software market report also includes key purchase criteria and drivers of price sensitivity to help companies evaluate and develop their market growth analysis strategies.
Customer Landscape of Claims Processing Software Industry
Competitive Landscape
Companies are implementing various strategies, such as strategic alliances, claims processing software market forecast, partnerships, mergers and acquisitions, geographical expansion, and product/service launches, to enhance their presence in the industry.
Applied Systems Inc. - Provides an integrated agency management system with analytics and mobile capabilities, designed to unify claims processing and core operational workflows for enhanced business intelligence.
The industry research and growth report includes detailed analyses of the competitive landscape of the market and information about key companies, including:
- Applied Systems Inc.
- Central Point Services Ltd.
- Duck Creek Technologies LLC
- EIS Group Inc.
- Euclid Insurance Services Inc.
- Fineos Corp. Holdings plc
- ForeSoft Corp.
- HawkSoft Inc.
- Healthsuite LLC
- Hi Tech Health
- HIPAAsuite
- Hyland Software Inc.
- Insta Claim
- Jenesis Software
- Liberty Mutual Insurance Co.
- Newgen Software Technologies Ltd.
- Pegasystems Inc.
- Quick Silver Systems Inc.
- SpeedySoft USA Inc.
- Ventiv Technology Inc.
Qualitative and quantitative analysis of companies has been conducted to help clients understand the wider business environment as well as the strengths and weaknesses of key industry players. Data is qualitatively analyzed to categorize companies as pure play, category-focused, industry-focused, and diversified; it is quantitatively analyzed to categorize companies as dominant, leading, strong, tentative, and weak.
Recent Development and News in Claims processing software market
- In September, 2024, Duck Creek Technologies LLC announced the launch of Duck Creek Claims AI, a new module integrating generative AI to automate first notice of loss intake and assign claims, reducing manual data entry by an estimated 40%.
- In November, 2024, Hyland Software Inc. completed its acquisition of a leading European insurtech firm specializing in mobile-first claims documentation, adding advanced photo and video evidence management capabilities to its portfolio for USD 150 million.
- In January, 2025, Newgen Software Technologies Ltd. entered into a strategic partnership with a global cloud infrastructure provider to co-develop a next-generation claims processing platform-as-a-service (PaaS) for the APAC insurance market.
- In March, 2025, Fineos Corp. Holdings plc secured a multi-year, USD 50 million contract with a major North American life insurance carrier to replace its legacy claims system with the FINEOS Platform, supporting over five million policyholders.
Dive into Technavio’s robust research methodology, blending expert interviews, extensive data synthesis, and validated models for unparalleled Claims Processing Software Market insights. See full methodology.
| Market Scope | |
|---|---|
| Page number | 282 |
| Base year | 2024 |
| Historic period | 2019-2023 |
| Forecast period | 2025-2029 |
| Growth momentum & CAGR | Accelerate at a CAGR of 9% |
| Market growth 2025-2029 | USD 27190.4 million |
| Market structure | Fragmented |
| YoY growth 2024-2025(%) | 8.0% |
| Key countries | US, Canada, Mexico, Germany, UK, France, Italy, The Netherlands, Spain, China, Japan, India, South Korea, Australia, Indonesia, Brazil, Argentina, Colombia, Saudi Arabia, UAE, South Africa, Israel and Turkey |
| Competitive landscape | Leading Companies, Market Positioning of Companies, Competitive Strategies, and Industry Risks |
Research Analyst Overview
- The claims processing software market's evolution is defined by a strategic push toward comprehensive automation. Boardroom decisions now center on implementing effective claims lifecycle management, incorporating automated claims adjudication and robotic process automation in claims to enhance efficiency. The deployment of an AI-driven fraud detection engine is critical for mitigating risk in both insurance claims automation and healthcare claims management.
- Modernization efforts focus on replacing outdated systems with a cloud-native claims platform or a robust on-premises claims solution. These systems feature deep policy administration integration and operate within an API-driven insurance ecosystem, providing real-time claims analytics. Firms with such integrated systems report up to a 25% reduction in claims adjustment expenses.
- Key functionalities include straight-through processing, first notice of loss automation, and tools for claims payment integrity, denial management software, and subrogation management tools. Solutions now cover medical billing automation, electronic data interchange for claims, and claims workflow optimization, all governed by a rule-based adjudication engine.
- Specialized software for third-party administrators, property and casualty claims, and workers' compensation claims is becoming standard. Advanced systems also provide beneficiary eligibility verification, provider network management, and catastrophe claims management.
What are the Key Data Covered in this Claims Processing Software Market Research and Growth Report?
-
What is the expected growth of the Claims Processing Software Market between 2025 and 2029?
-
USD 27.19 billion, at a CAGR of 9%
-
-
What segmentation does the market report cover?
-
The report is segmented by Component (Software, and Services), Deployment (Cloud-based, and On-premises), Industry Application (BFSI, Healthcare, IT and Telecommunications, Retail and E-commerce, and Others) and Geography (North America, Europe, APAC, South America, Middle East and Africa)
-
-
Which regions are analyzed in the report?
-
North America, Europe, APAC, South America and Middle East and Africa
-
-
What are the key growth drivers and market challenges?
-
Increasing government regulations on mandatory insurance coverage in developing countries, Security threat
-
-
Who are the major players in the Claims Processing Software Market?
-
Applied Systems Inc., Central Point Services Ltd., Duck Creek Technologies LLC, EIS Group Inc., Euclid Insurance Services Inc., Fineos Corp. Holdings plc, ForeSoft Corp., HawkSoft Inc., Healthsuite LLC, Hi Tech Health, HIPAAsuite, Hyland Software Inc., Insta Claim, Jenesis Software, Liberty Mutual Insurance Co., Newgen Software Technologies Ltd., Pegasystems Inc., Quick Silver Systems Inc., SpeedySoft USA Inc. and Ventiv Technology Inc.
-
Market Research Insights
- The claims processing software market is characterized by a dynamic shift toward intelligent automation and data-driven strategies. Insurtech claims solutions are at the forefront of this change, with the adoption of AI in claims processing leading to a 30% improvement in fraud detection accuracy.
- Companies leveraging end-to-end claims automation platforms report a 25% faster claims settlement efficiency compared to those relying on legacy systems. This push for modernization is not just about speed; it's about enhancing the overall customer experience in claims and achieving greater claims operational efficiency.
- The integration of fraud analytics for insurance into core insurance systems modernization projects is now standard, enabling real-time risk assessment. As a result, digital insurance platforms are becoming essential for carriers aiming to optimize workflows and reduce administrative overhead, fundamentally reshaping insurance process automation.
We can help! Our analysts can customize this claims processing software market research report to meet your requirements.
 RIA -
RIA - 
