
Business Process Outsourcing Market Size 2026-2030
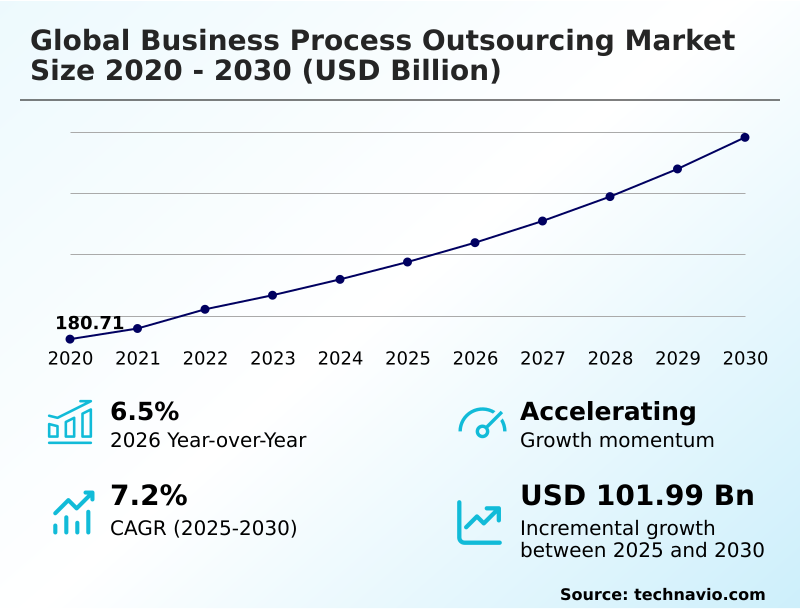
The business process outsourcing market size is valued to increase by USD 101.99 billion, at a CAGR of 7.2% from 2025 to 2030. Imperative of digital transformation will drive the business process outsourcing market.
Major Market Trends & Insights
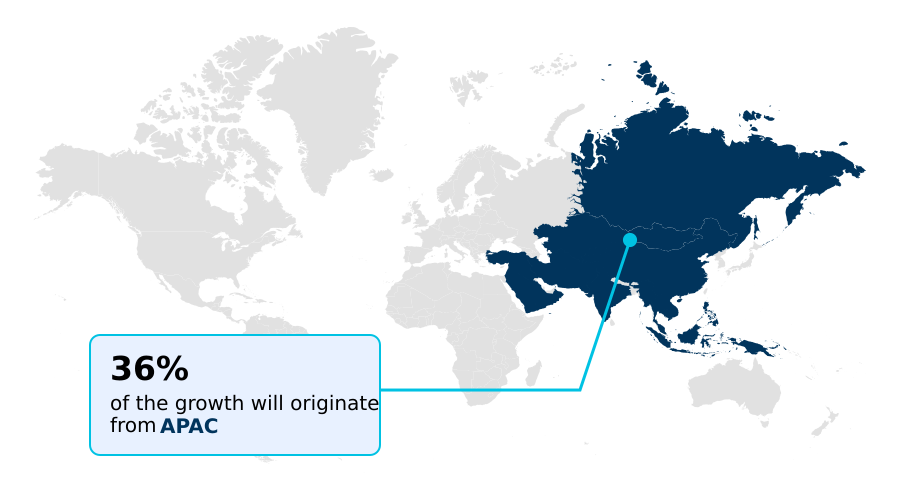
- APAC dominated the market and accounted for a 35.8% growth during the forecast period.
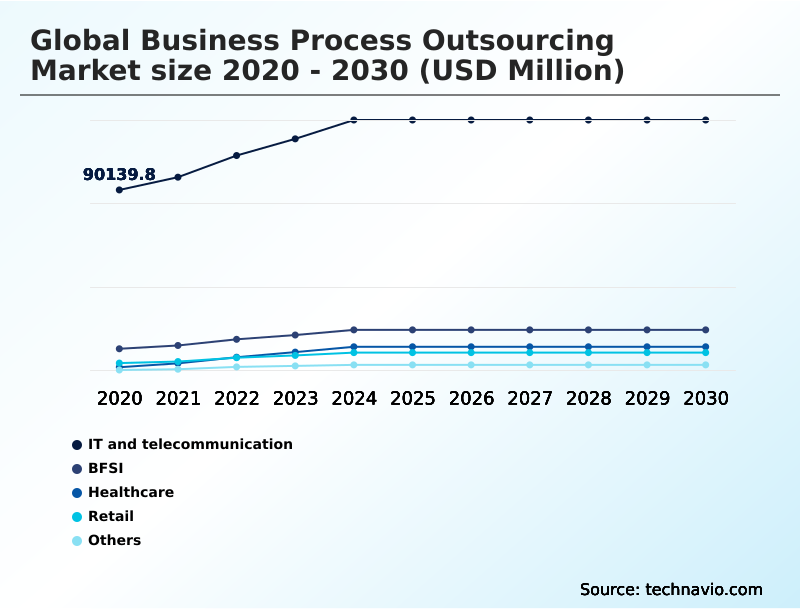
- By End-user - IT and telecommunication segment was valued at USD 117.53 billion in 2024
- By Business Segment - Large enterprises segment accounted for the largest market revenue share in 2024
Market Size & Forecast
- Market Opportunities: USD 165.09 billion
- Market Future Opportunities: USD 101.99 billion
- CAGR from 2025 to 2030 : 7.2%
Market Summary
- The Business Process Outsourcing market has evolved from a cost-reduction tactic into a strategic enabler of enterprise-wide digital transformation. Organizations now leverage BPO for more than labor arbitrage; they seek strategic outsourcing partnerships for value-added services that provide access to advanced ai-powered platforms and specialized skills.
- This includes managing complex functions like the procure-to-pay cycle and using contract analysis automation to drive efficiency. The integration of intelligent automation solutions is fundamental, with providers offering vertical-specific bpaas to address unique industry needs.
- For instance, a financial institution might outsource its anti-money laundering compliance processes, relying on a partner's sophisticated fraud detection algorithms and technology-led bpo solutions to navigate regulatory complexities and mitigate risk.
- This move towards technology-centric bpo service delivery is challenged by the skills gap in bpo and growing data privacy and security concerns, compelling providers to invest in both talent development and robust cybersecurity infrastructure to maintain client trust and deliver on the promise of innovation.
What will be the Size of the Business Process Outsourcing Market during the forecast period?
Get Key Insights on Market Forecast (PDF) Get Free Sample
How is the Business Process Outsourcing Market Segmented?
The business process outsourcing industry research report provides comprehensive data (region-wise segment analysis), with forecasts and estimates in "USD million" for the period 2026-2030, as well as historical data from 2020-2024 for the following segments.
- End-user
- IT and telecommunication
- BFSI
- Healthcare
- Retail
- Others
- Business segment
- Large enterprises
- SMEs
- Deployment
- Cloud
- On-premises
- Geography
- North America
- US
- Canada
- Mexico
- APAC
- India
- China
- Japan
- Europe
- UK
- Germany
- France
- Middle East and Africa
- UAE
- Saudi Arabia
- South Africa
- South America
- Brazil
- Argentina
- Rest of World (ROW)
- North America
By End-user Insights
The it and telecommunication segment is estimated to witness significant growth during the forecast period.
The IT and telecommunication sector is evolving from traditional call center support to complex, high-value strategic outsourcing partnerships. The proliferation of advanced technologies demands a new class of bpo service delivery focused on software-defined networking, cybersecurity, and data analytics.
Service providers are actively managing and optimizing customer engagement systems through AI-powered platforms. This shift toward technology-infused bpo for large enterprises delivers tangible improvements, with AI-powered sales tools driving a thirty-eight percent increase in sales conversion rates.
Providers are increasingly offering digital transformation consulting, leveraging ai-augmented engineering and omnichannel contact center solutions with ai-powered chatbots and multilingual agent support to enhance customer experience, while developments like a cybersecurity firm acquisition bolster security.
This trend mirrors the move towards cognitive operations center and it-enabled back-office services seen in models like nearshoring to eastern europe.
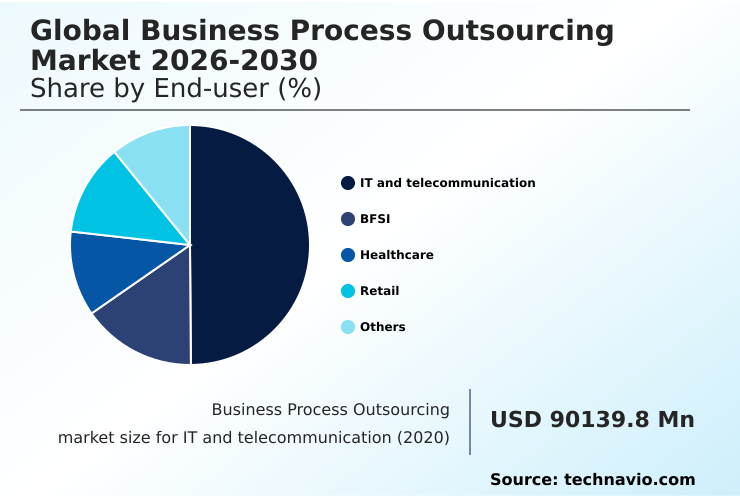
The IT and telecommunication segment was valued at USD 117.53 billion in 2024 and showed a gradual increase during the forecast period.
Regional Analysis
APAC is estimated to contribute 35.8% to the growth of the global market during the forecast period.Technavio’s analysts have elaborately explained the regional trends and drivers that shape the market during the forecast period.
See How Business Process Outsourcing Market Demand is Rising in APAC Get Free Sample
The geographic landscape is diversifying. North America emphasizes mature, high-value onshore service delivery for functions like revenue cycle management and anti-money laundering compliance.
In contrast, APAC is the fastest-growing region, with growth rates nearly double those in Europe, driven by demand and the establishment of digital acceleration center hubs. Europe shows a strong preference for nearshore delivery models to maintain regulatory alignment.
Meanwhile, emerging regions are gaining prominence; south america nearshoring is prized for time zone alignment and bilingual customer support, and middle east bpo growth is fueled by economic diversification.
This global shift includes outsourcing specialized tasks like pharmacovigilance services, clinical trial data management, and clinical trial documentation, moving far beyond traditional back-office support into complex, regulated domains like contract analysis automation and procure-to-pay cycle management.
Market Dynamics
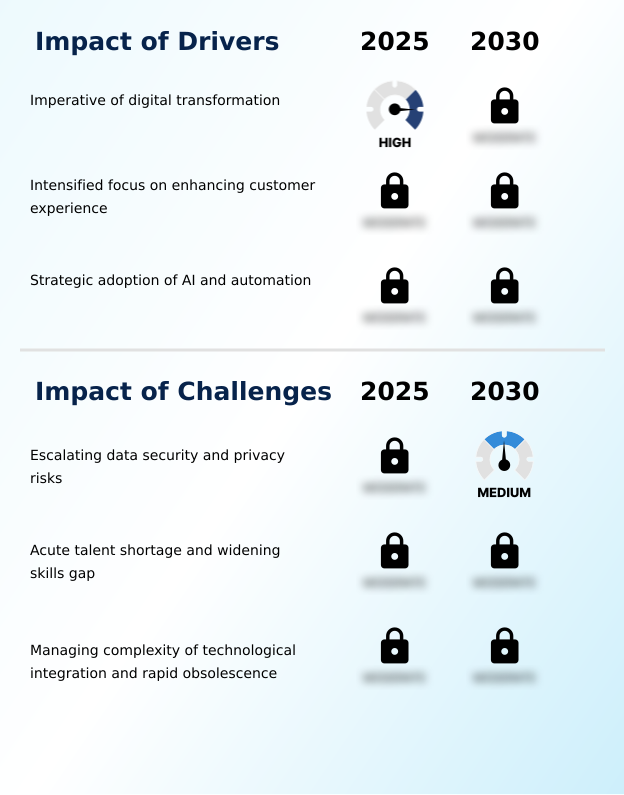
Our researchers analyzed the data with 2025 as the base year, along with the key drivers, trends, and challenges. A holistic analysis of drivers will help companies refine their marketing strategies to gain a competitive advantage.
- The Global Business Process Outsourcing Market 2026-2030 is undergoing a significant transformation, shaped by several interconnected factors. Analysis of the Global Business Process Outsourcing Market 2026-2030 generative ai adoption trends shows a clear shift toward cognitive automation, impacting everything from customer service to financial analysis.
- This is particularly relevant when examining the Global Business Process Outsourcing Market 2026-2030 bfsi sector compliance challenges, where AI helps manage risk. Simultaneously, the Global Business Process Outsourcing Market 2026-2030 healthcare patient engagement solutions are being redefined by technology.
- A key consideration for clients is the Global Business Process Outsourcing Market 2026-2030 impact of esg on vendor selection, pushing providers toward sustainable practices. However, the Global Business Process Outsourcing Market 2026-2030 talent shortage and upskilling strategies remain a central challenge.
- For smaller companies, the Global Business Process Outsourcing Market 2026-2030 sme adoption of bpaas platforms is leveling the playing field. Security is paramount, with the Global Business Process Outsourcing Market 2026-2030 data security in cloud outsourcing being a top boardroom concern.
- The strategic debate over the Global Business Process Outsourcing Market 2026-2030 nearshoring versus offshoring cost analysis continues, influenced by geopolitical stability and talent availability, especially for Global Business Process Outsourcing Market 2026-2030 managing multilingual agent support.
- There is also strong momentum in specialized areas such as Global Business Process Outsourcing Market 2026-2030 ai in finance and accounting and Global Business Process Outsourcing Market 2026-2030 customer experience management innovations.
- The foundational Global Business Process Outsourcing Market 2026-2030 role of robotic process automation continues, while Global Business Process Outsourcing Market 2026-2030 vertical specific solutions for retail are becoming standard. Key risks include Global Business Process Outsourcing Market 2026-2030 cybersecurity risks for bpo providers and Global Business Process Outsourcing Market 2026-2030 challenges in legacy system integration.
- Growth is strong, as seen in the Global Business Process Outsourcing Market 2026-2030 growth drivers in apac region. Large enterprises drive much of this with Global Business Process Outsourcing Market 2026-2030 large enterprise digital transformation projects.
- Looking ahead, the Global Business Process Outsourcing Market 2026-2030 future of omnichannel contact centers, opportunities in Global Business Process Outsourcing Market 2026-2030 south america nearshoring, and the use of Global Business Process Outsourcing Market 2026-2030 predictive analytics for operational efficiency will define the next phase of market evolution.
What are the key market drivers leading to the rise in the adoption of Business Process Outsourcing Industry?
- The imperative for digital transformation across all industries serves as a primary driver, positioning BPO providers as strategic partners in modernizing operations and enhancing competitive advantage.
- The market is driven by strategic outsourcing partnerships that deliver value-added services beyond cost savings. A heightened focus on customer experience management requires sophisticated technology-led bpo solutions and ai-powered platforms to meet demands for seamless, 24/7 support.
- Providers leverage omnichannel communication platform and intelligent automation solutions to transform customer service into a value-generating function, with some AI tools boosting sales conversions by 38%.
- Furthermore, the adoption of robotic process automation and advanced AI for tasks like procure-to-pay automation and improving fraud detection algorithms is reshaping operations.
- These technologies, supported by a cloud-based infrastructure, enable predictive analytics for cash flow and are increasingly accessible to bpo for smes, fundamentally changing the BPO value proposition.
What are the market trends shaping the Business Process Outsourcing Industry?
- The proliferation of generative AI in service delivery is a dominant market trend. This shift is compelling providers to transform business models from a labor-centric approach to a technology-first, human-in-the-loop model.
- A key trend is the sophisticated generative ai integration into service delivery, moving beyond simple automation to a human-in-the-loop model for complex cognitive functions. This requires enterprise-grade ai solutions and a focus on knowledge process outsourcing. Alongside technology, impact sourcing initiatives and esg criteria in outsourcing are gaining prominence, as clients evaluate providers' social and environmental footprints.
- This has led to the development of hyper-specialized, vertical-specific bpaas platforms and centers of excellence. In highly regulated sectors, this specialization is critical for functions like trade finance processing or ensuring a hipaa compliance framework is met in a mortgage origination workflow.
- To support this, providers are investing heavily in upskilling, with some launching programs to train over 50,000 employees in advanced AI capabilities.
What challenges does the Business Process Outsourcing Industry face during its growth?
- Escalating data security and privacy risks, coupled with a complex global regulatory landscape, present a primary challenge to the business process outsourcing market's growth.
- Escalating challenges in data privacy and security and gdrp compliance in bpo are compelling providers to invest in sovereign cloud security and robust data residency solutions, with compliance costs sometimes exceeding 10% of operational budgets. Concurrently, the ai-powered business process shift creates a significant skills gap in bpo, increasing competition for digital-native professionals.
- Firms are addressing this by upskilling over 50,000 employees in some cases. Another hurdle is the technology integration complexity, particularly with legacy system integration and enterprise resource planning integration. This requires specialized process automation consulting to streamline functions like order-to-cash cycles and successfully deploy cloud-based bpaas models without disrupting client operations, highlighting the high stakes of digital transformation.
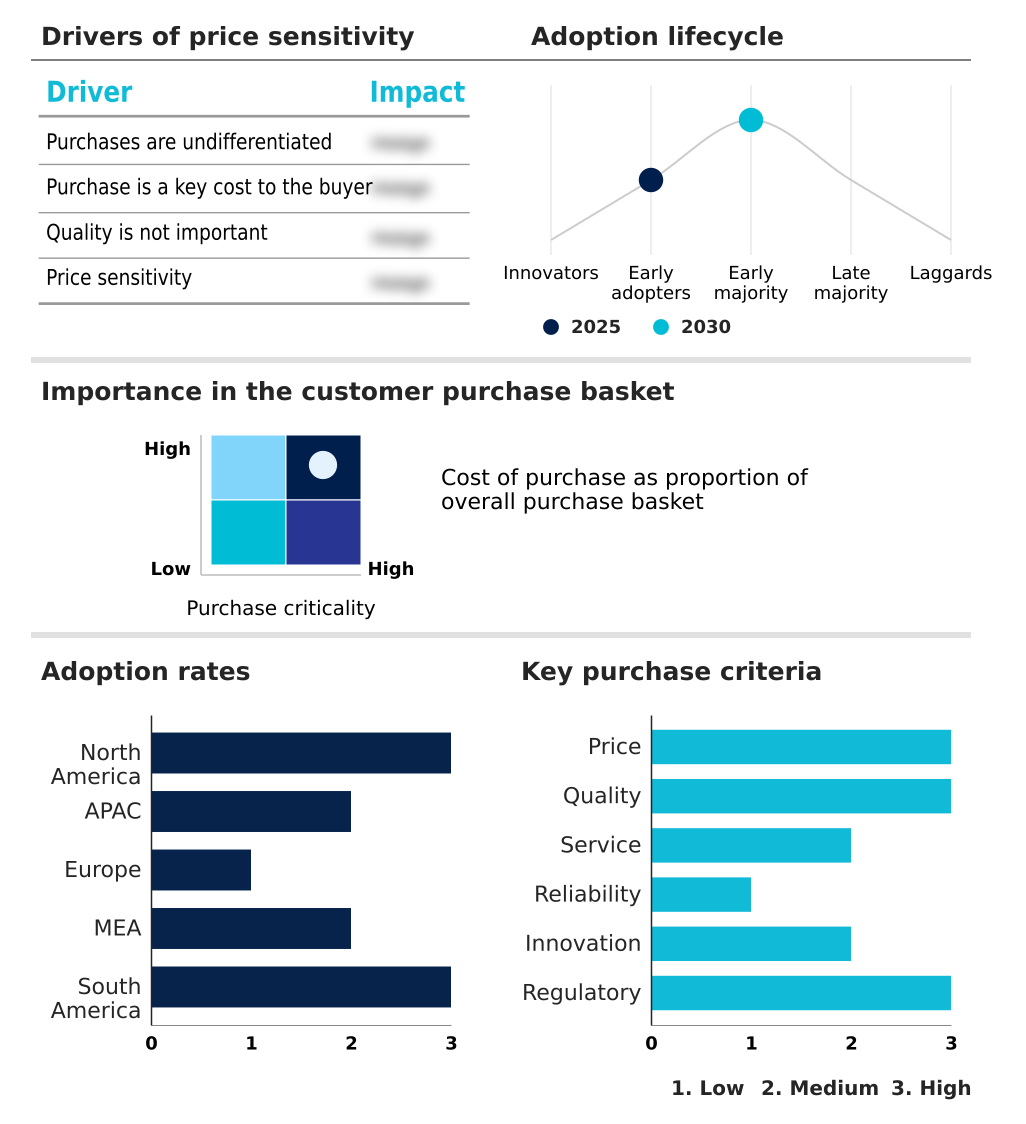
Exclusive Technavio Analysis on Customer Landscape
The business process outsourcing market forecasting report includes the adoption lifecycle of the market, covering from the innovator’s stage to the laggard’s stage. It focuses on adoption rates in different regions based on penetration. Furthermore, the business process outsourcing market report also includes key purchase criteria and drivers of price sensitivity to help companies evaluate and develop their market growth analysis strategies.
Customer Landscape of Business Process Outsourcing Industry
Competitive Landscape
Companies are implementing various strategies, such as strategic alliances, business process outsourcing market forecast, partnerships, mergers and acquisitions, geographical expansion, and product/service launches, to enhance their presence in the industry.
Accenture Plc - Solutions span finance and accounting, HR, procurement, and customer service, leveraging technology platforms to manage and optimize complex end-to-end business functions for global clients.
The industry research and growth report includes detailed analyses of the competitive landscape of the market and information about key companies, including:
- Accenture Plc
- Alorica Inc.
- Automatic Data Processing Inc.
- Capgemini SE
- Cognizant Technology Solution
- Concentrix Corp.
- Conduent Inc.
- ExlService Holdings Inc.
- Firstsource Solutions Ltd.
- Foundever Group
- HCL Technologies Ltd.
- IBM Corp.
- Infosys BPM Ltd.
- StarTek Inc.
- Tata Consultancy Services
- Teleperformance SE
- Transcom Holding AB
- TTEC Holdings Inc.
- Wipro Ltd.
- WNS Holdings Ltd.
Qualitative and quantitative analysis of companies has been conducted to help clients understand the wider business environment as well as the strengths and weaknesses of key industry players. Data is qualitatively analyzed to categorize companies as pure play, category-focused, industry-focused, and diversified; it is quantitatively analyzed to categorize companies as dominant, leading, strong, tentative, and weak.
Recent Development and News in Business process outsourcing market
- In February, 2025, Teleperformance announced a strategic partnership with Sanas to deploy advanced AI tools aimed at refining communication clarity and improving the efficiency of customer interactions.
- In March, 2025, Capgemini announced a significant expansion of its partnership with a global CPG company, deploying an AI-powered platform to automate and optimize the client's procure-to-pay and order-to-cash cycles.
- In May, 2025, Accenture announced its strategic acquisition of SentinelShield, a European cybersecurity firm, to bolster its capabilities in providing secure, compliant BPO services for banking and healthcare clients.
- In August, 2025, Wipro announced a multi-year engagement with a leading U.S. healthcare provider to lead its digital overhaul, deploying AI-powered platforms to modernize patient engagement and revenue cycle management.
Dive into Technavio’s robust research methodology, blending expert interviews, extensive data synthesis, and validated models for unparalleled Business Process Outsourcing Market insights. See full methodology.
| Market Scope | |
|---|---|
| Page number | 308 |
| Base year | 2025 |
| Historic period | 2020-2024 |
| Forecast period | 2026-2030 |
| Growth momentum & CAGR | Accelerate at a CAGR of 7.2% |
| Market growth 2026-2030 | USD 101988.8 million |
| Market structure | Fragmented |
| YoY growth 2025-2026(%) | 6.5% |
| Key countries | US, Canada, Mexico, India, China, Japan, South Korea, Australia, Indonesia, UK, Germany, France, Italy, Spain, The Netherlands, UAE, Saudi Arabia, South Africa, Israel, Turkey, Brazil, Argentina and Chile |
| Competitive landscape | Leading Companies, Market Positioning of Companies, Competitive Strategies, and Industry Risks |
Research Analyst Overview
- The Business Process Outsourcing market has fundamentally pivoted from labor arbitrage to technology-led value creation. The integration of generative artificial intelligence and robotic process automation is now a baseline expectation, compelling providers to offer sophisticated intelligent automation solutions. This shift directly influences boardroom budgeting, as investment in ai-augmented engineering and ai-powered chatbots is prioritized to enhance efficiency.
- We see a strong trend toward hyper-specialization, with providers developing deep expertise in areas like clinical trial data management, pharmacovigilance services, and complex anti-money laundering compliance. This vertical focus is critical, as demonstrated by the development of solutions for specific workflows such as the procure-to-pay cycle and order-to-cash cycles.
- In one instance, AI-powered sales tools drove a thirty-eight percent increase in sales conversion rates, showcasing the tangible ROI. The market is also consolidating security capabilities, with moves like a cybersecurity firm acquisition to provide sovereign cloud security and address stringent data residency solutions.
- This evolution requires a new class of digital-native professionals skilled in process automation consulting and legacy system integration to deliver on the promise of digital transformation consulting across all business functions.
What are the Key Data Covered in this Business Process Outsourcing Market Research and Growth Report?
-
What is the expected growth of the Business Process Outsourcing Market between 2026 and 2030?
-
USD 101.99 billion, at a CAGR of 7.2%
-
-
What segmentation does the market report cover?
-
The report is segmented by End-user (IT and telecommunication, BFSI, Healthcare, Retail, and Others), Business Segment (Large enterprises, and SMEs), Deployment (Cloud, and On-premises) and Geography (North America, APAC, Europe, Middle East and Africa, South America)
-
-
Which regions are analyzed in the report?
-
North America, APAC, Europe, Middle East and Africa and South America
-
-
What are the key growth drivers and market challenges?
-
Imperative of digital transformation, Escalating data security and privacy risks
-
-
Who are the major players in the Business Process Outsourcing Market?
-
Accenture Plc, Alorica Inc., Automatic Data Processing Inc., Capgemini SE, Cognizant Technology Solution, Concentrix Corp., Conduent Inc., ExlService Holdings Inc., Firstsource Solutions Ltd., Foundever Group, HCL Technologies Ltd., IBM Corp., Infosys BPM Ltd., StarTek Inc., Tata Consultancy Services, Teleperformance SE, Transcom Holding AB, TTEC Holdings Inc., Wipro Ltd. and WNS Holdings Ltd.
-
Market Research Insights
- Market dynamics are shaped by a shift toward strategic outsourcing partnerships that prioritize value-added services over simple cost-cutting. The demand for enhanced customer experience is driving investment in advanced ai-powered platforms and cx fusion platform technologies, with some deployments boosting sales conversion rates by as much as 38%.
- This pivot to technology-led bpo solutions is supported by a flexible cloud-based infrastructure. Enterprises are increasingly adopting nearshore delivery models for better collaboration and compliance, while esg criteria in outsourcing are becoming standard in vendor selection.
- The accessibility of cloud-based bpaas models is also accelerating adoption among bpo for smes, democratizing access to enterprise-grade tools and fostering a more competitive landscape.
We can help! Our analysts can customize this business process outsourcing market research report to meet your requirements.
 RIA -
RIA - 
