Intelligent Vending Machine Market Analysis, Size, and Forecast 2025-2029: North America (Canada and Mexico), Europe (France, Germany, Italy, Spain, UK), APAC (China, India, Japan, South Korea), South America (Brazil), and Middle East and Africa (UAE)

Intelligent Vending Machine Market Analysis, Size, and Forecast 2025-2029:
North America (Canada and Mexico), Europe (France, Germany, Italy, Spain, UK), APAC (China, India, Japan, South Korea), South America (Brazil), and Middle East and Africa (UAE)

Published: Jan 2025 199 Pages SKU: IRTNTR41183

Intelligent Vending Machine Market Size 2025-2029

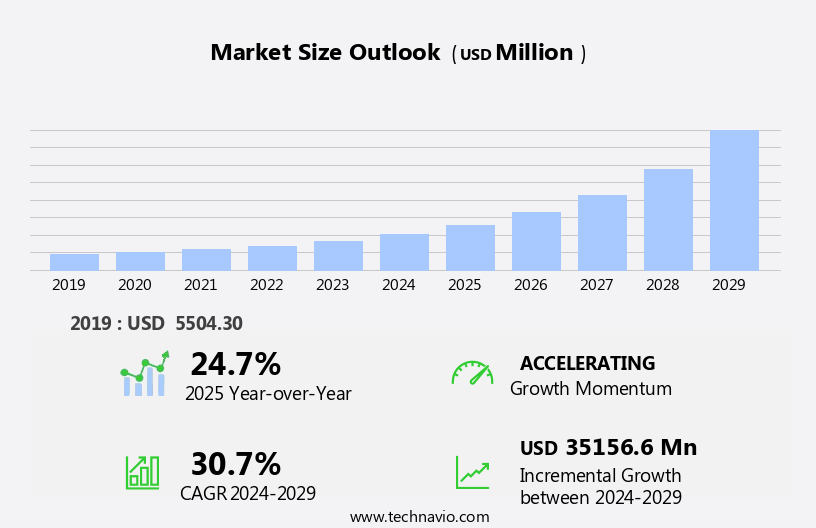
The intelligent vending machine market size is forecast to increase by USD 35.16 billion, at a CAGR of 30.7% between 2024 and 2029.

  • The market is witnessing significant growth due to the increasing demand for cashless payment options in vending machines. This trend is driven by the convenience and speed that cashless transactions offer, making vending machines more appealing to consumers. Furthermore, the integration of real-time data collection capabilities in intelligent vending machines is revolutionizing the industry. This technology enables operators to monitor inventory levels, consumer preferences, and machine performance in real-time, leading to improved efficiency and productivity. However, the market faces challenges that require careful attention. The rise in theft and vandalism incidents is a significant concern for market players.
  • To mitigate these risks, companies are investing in advanced security features such as biometric authentication and remote monitoring systems. These solutions not only enhance the security of the machines but also provide valuable data that can be used to optimize operations and enhance the consumer experience. Overall, the market presents numerous opportunities for growth, driven by consumer preferences for cashless transactions and the ability to collect real-time data. Companies that effectively address the challenges, particularly those related to security, will be well-positioned to capitalize on these trends and succeed in the market.

What will be the Size of the Intelligent Vending Machine Market during the forecast period?

Intelligent Vending Machine Market Size

Explore in-depth regional segment analysis with market size data - historical 2019-2023 and forecasts 2025-2029 - in the full report.  
Request Free Sample

The market continues to evolve, driven by advancements in technology and shifting consumer preferences. Seamlessly integrated components, such as component sourcing, beverage dispensers, customer loyalty programs, user authentication, technical support, and quality control, ensure optimal performance and customer satisfaction. Temperature control, customizable configurations, and product lifecycle management maintain freshness and availability of offerings. Automated cleaning, material science, and cashless payment systems enhance the user experience and promote hygiene. Network security, maintenance alerts, and cloud connectivity enable remote monitoring and sales reporting through mobile applications. Stock replenishment, warranty management, and remote diagnostics facilitate efficient operations and reduce downtime. Touchscreen interfaces, waste management, promotional capabilities, energy efficiency, and IoT integration cater to diverse customer needs.

Inventory management, security systems, data analytics, customer support, data encryption, digital signage, and training programs further strengthen the market's offerings. Regulatory compliance, software updates, and company management ensure industry standards are met, as the market continues to unfold with ongoing innovation.

How is this Intelligent Vending Machine Industry segmented?

The intelligent vending machine industry research report provides comprehensive data (region-wise segment analysis), with forecasts and estimates in "USD million" for the period 2025-2029, as well as historical data from 2019-2023 for the following segments.

  • Product
    • Beverage
    • Food
    • Tobacco
  • Installation Sites
    • Retail sites
    • Public transport hubs
    • Offices
  • Application
    • Manufacturing
    • Commercial malls & retail stores
    • Offices
    • Educational institutes
    • Others
  • Technology Specificity
    • Cashless Payment
    • IoT Connectivity
    • Touchscreen Interfaces
  • Product Types
    • Snack Vending
    • Beverage Vending
    • Combination Vending
  • Geography
    • North America
      • US
      • Canada
      • Mexico
    • Europe
      • France
      • Germany
      • Italy
      • Spain
      • UK
    • Middle East and Africa
      • UAE
    • APAC
      • China
      • India
      • Japan
      • South Korea
    • South America
      • Brazil
    • Rest of World (ROW)

    By Product Insights

    The beverage segment is estimated to witness significant growth during the forecast period.

    Intelligent vending machines have witnessed significant advancements in recent years, integrating various technologies to enhance user experience and streamline operations. Beverages continue to dominate the market, with countries like Spain, Germany, and the UK leading in sales due to their high consumer preferences. The food and drink industry in the EU, as per FoodDrinkEurope's latest data in 2024, generated a turnover of USD1.236 trillion and USD258.25 billion in value added, employing around 4.7 million people. North America, particularly Canada, also shows notable consumption of alcoholic beverages, surpassing the global average. These machines offer customizable configurations, including beverage dispensers, snack dispensers, and product recognition, catering to diverse consumer needs.

    User authentication, cashless payment systems, and API integrations ensure a seamless transaction process. Hygiene standards, temperature control, and automated cleaning maintain product quality, while refrigeration technology and inventory management optimize stock levels. company management, software updates, and remote diagnostics enable efficient maintenance and technical support. Modular design, accessibility features, and network security cater to various user demographics and ensure data security. Remote monitoring, sales reporting, and mobile applications facilitate real-time tracking and analysis. Energy efficiency, IoT integration, and data analytics further optimize machine performance and reduce operational costs. Quality control, regulatory compliance, and warranty management ensure customer satisfaction and trust.

    Training programs and customer support provide essential knowledge and assistance. Material science and product lifecycle management contribute to the development of advanced vending machines. Maintenance alerts, cloud connectivity, and data encryption further enhance the overall functionality and security of these machines.

    Intelligent Vending Machine Market Size

    Request Free Sample

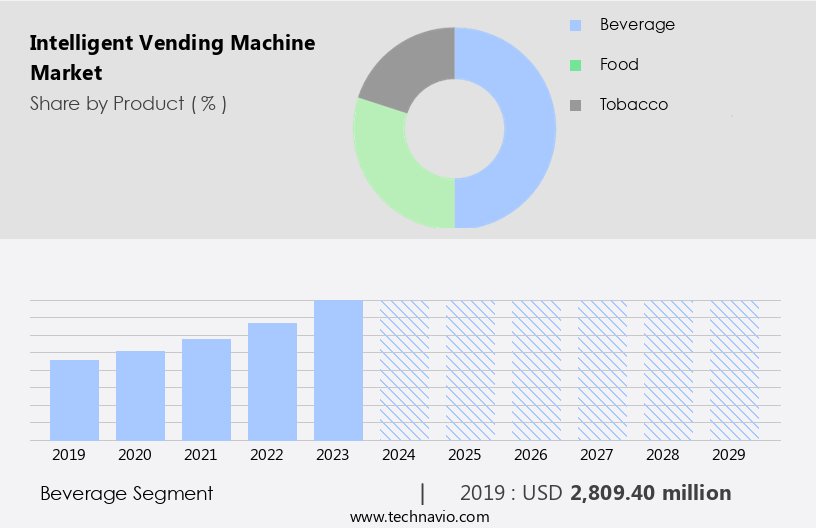
    The Beverage segment was valued at USD 2.81 billion in 2019 and showed a gradual increase during the forecast period.

    Regional Analysis

    North America is estimated to contribute 37% to the growth of the global market during the forecast period.Technavio’s analysts have elaborately explained the regional trends and drivers that shape the market during the forecast period.

    Intelligent Vending Machine Market Share by Geography

     Request Free Sample

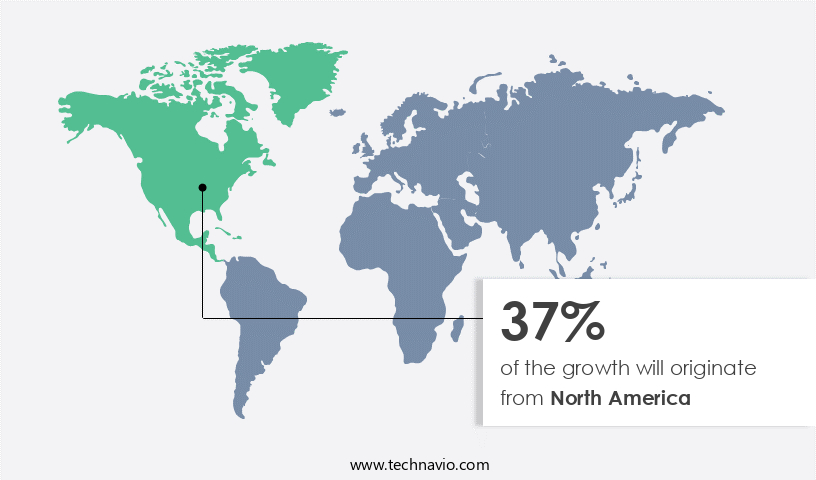
    The market in North America is experiencing significant growth due to the increasing preference for self-service, technologically advanced solutions in retail outlets. The region, which includes the US and Canada, is a major contributor to the global market revenue. The popularity of vending machines, the concentration of manufacturers and retailers, and the awareness of advanced technologies among consumers are key drivers of market expansion. Intelligent vending machines, equipped with features such as user authentication, temperature control, product recognition, and customizable configurations, are in high demand. These machines offer a superior user experience through touchscreen interfaces, cashless payment systems, and remote monitoring capabilities.

    Additionally, they prioritize hygiene standards, network security, and regulatory compliance. Manufacturers are integrating various technologies like refrigeration technology, IoT, and data analytics to enhance the functionality of these machines. They offer remote diagnostics, maintenance alerts, and cloud connectivity for seamless operations. Furthermore, the market caters to accessibility features and waste management to accommodate diverse customer needs. The supply chain is streamlined through inventory management, company management, and sales reporting. API integrations enable seamless data exchange between systems, while training programs ensure efficient installation and usage of these machines. The market also focuses on energy efficiency and promotional capabilities to attract customers.

    In conclusion, the market in North America is thriving due to the increasing demand for advanced, interactive, and self-help solutions. The market is characterized by continuous innovation, integration of advanced technologies, and a focus on customer satisfaction.

    Market Dynamics

    Our researchers analyzed the data with 2024 as the base year, along with the key drivers, trends, and challenges. A holistic analysis of drivers will help companies refine their marketing strategies to gain a competitive advantage.

    In the dynamic and innovative world of automated retail, the market continues to thrive, offering convenience and efficiency like never before. These advanced machines utilize technologies such as artificial intelligence, machine learning, and internet connectivity to provide personalized experiences for consumers. RFID and biometric sensors enable contactless transactions, while real-time inventory management ensures product availability. Energy efficiency, solar power, and remote monitoring are essential features, reducing environmental impact and operational costs. The market caters to various sectors, including healthcare, education, transportation, and hospitality, offering customized solutions. With the integration of mobile applications and IoT devices, the future of intelligent vending machines is promising, revolutionizing the way we access goods and services.

    What are the key market drivers leading to the rise in the adoption of Intelligent Vending Machine Industry?

    • The increasing preference for cashless transactions is primarily fueling the market expansion, with a significant rise in demand for cashless vending machines. 

    • Intelligent vending machines, equipped with cashless payment capabilities, have witnessed substantial growth since 2015. The proliferation of smartphones and the increasing preference for contactless transactions using debit cards, credit cards, and mobile payments have driven this trend. Retailers are increasingly installing these machines in offices, commercial complexes, institutions, hospitals, and hotels to cater to customers' evolving needs. Component sourcing for these machines includes beverage dispensers, user authentication systems, technical support, quality control, temperature control, customizable configurations, product lifecycle management, automated cleaning, and material science. These features enhance the customer experience, boosting loyalty programs and sales. Moreover, intelligent vending machines offer retrofitting options, allowing companies to upgrade existing machines with cashless transaction facilities.
    • This flexibility caters to the dynamic market demands and ensures the machines remain relevant and competitive. In conclusion, the market dynamics of intelligent vending machines are driven by the shift towards cashless transactions, technological advancements, and customer preferences. Retailers are investing in these machines to provide a seamless and immersive buying experience, ultimately fostering long-term customer relationships.

    What are the market trends shaping the Intelligent Vending Machine Industry?

    • Intelligent vending machines are emerging as the new market trend, enabling real-time data collection for enhanced consumer experience and operational efficiency. These advanced machines utilize technology such as IoT sensors and RFID readers to gather valuable data on inventory levels, consumer preferences, and transaction patterns.

    • Intelligent vending machines offer advanced functionalities beyond product dispensing, integrating cashless payment systems, supply chain management, and customer analytics. These machines utilize internet connectivity for real-time data collection and analysis, enabling retailers to optimize inventory management, monitor sales trends, and personalize marketing efforts. API integrations facilitate seamless data exchange with external systems, while refrigeration technology ensures product freshness. Hygiene standards are maintained through modular design, allowing for easy cleaning and maintenance.
    • Accessibility features cater to diverse user needs, and network security measures protect customer data. Maintenance alerts are sent in real-time, ensuring timely servicing and minimizing downtime. Cloud connectivity allows for remote monitoring and management, enhancing operational efficiency.

    What challenges does the Intelligent Vending Machine Industry face during its growth?

    • The escalating issues of theft and vandalism pose a significant challenge to the industry's growth trajectory. 

    • Intelligent vending machines, characterized by product recognition, remote monitoring, sales reporting, and mobile applications, are experiencing significant growth in various industries. However, regulatory compliance and security concerns are key challenges. companies must ensure their machines adhere to industry standards and undergo regular software updates to maintain optimal performance and security. company management is crucial for effective maintenance and stock replenishment. Remote diagnostics enable quick identification and resolution of issues, reducing downtime. Warranty management is essential for maintaining customer satisfaction and trust. Despite these advancements, concerns around data security and potential hacking remain. As the use of connected devices becomes more prevalent, it is imperative for end-users to prioritize robust security measures.
    • These include encryption, access control, and regular software updates. Remote monitoring and real-time sales reporting enable efficient inventory management and stock replenishment. Mobile applications offer convenience and flexibility for customers. companies must prioritize these features while addressing regulatory compliance and security concerns to ensure the continued growth and success of the market.

    Exclusive Customer Landscape

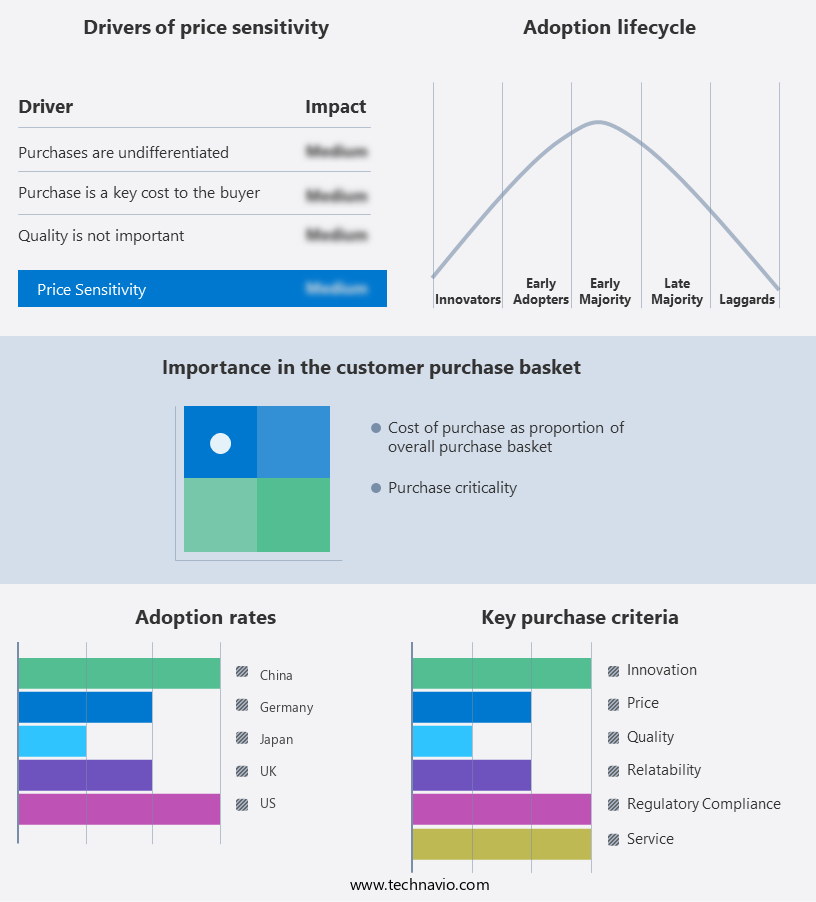
    The intelligent vending machine market forecasting report includes the adoption lifecycle of the market, covering from the innovator’s stage to the laggard’s stage. It focuses on adoption rates in different regions based on penetration. Furthermore, the intelligent vending machine market report also includes key purchase criteria and drivers of price sensitivity to help companies evaluate and develop their market growth analysis strategies.

    Intelligent Vending Machine Market Share by Geography

     Customer Landscape

    Key Companies & Market Insights

    Companies are implementing various strategies, such as strategic alliances, intelligent vending machine market forecast, partnerships, mergers and acquisitions, geographical expansion, and product/service launches, to enhance their presence in the industry.

    Crane Co. (United States) - A leading technology firm introduces an innovative vending solution: the Fanless Arm-based Box PC. This intelligent machine optimizes inventory management and user experience, delivering customized products on demand. Its energy-efficient design enhances sustainability, while advanced analytics provide actionable insights.

    The industry research and growth report includes detailed analyses of the competitive landscape of the market and information about key companies, including:

    • Crane Co. (United States)
    • Azkoyen Group (Spain)
    • Fuji Electric Co., Ltd. (Japan)
    • Sanden Holdings Corporation (Japan)
    • Selecta Group B.V. (Switzerland)
    • Westomatic Vending Services Ltd. (United Kingdom)
    • Bianchi Vending Group (Italy)
    • N&W Global Vending S.p.A. (Italy)
    • Seaga Manufacturing Inc. (United States)
    • Royal Vendors Inc. (United States)
    • Automated Merchandising Systems Inc. (United States)
    • Jofemar S.A. (Spain)
    • Rhea Vendors Group (Italy)
    • Fastcorp Vending LLC (United States)
    • Vendiman Pvt. Ltd. (India)
    • Wittern Group Inc. (United States)
    • TCN Vending Machine Co., Ltd. (China)
    • Sielaff GmbH & Co. KG (Germy)
    • Vending Design Works Ltd. (United Kingdom)
    • Zoom Systems (United States)

    Qualitative and quantitative analysis of companies has been conducted to help clients understand the wider business environment as well as the strengths and weaknesses of key industry players. Data is qualitatively analyzed to categorize companies as pure play, category-focused, industry-focused, and diversified; it is quantitatively analyzed to categorize companies as dominant, leading, strong, tentative, and weak.

    Recent Development and News in Intelligent Vending Machine Market

    • In January 2024, Nestle, the global food and beverage company, announced the launch of its new Nescafe Dolce Gusto Intelligent Vending Machine, which uses advanced AI technology to suggest beverage choices based on consumer preferences and weather conditions (Nestle Press Release, 2024).
    • In March 2024, Coca-Cola and PepsiCo, two major beverage giants, formed a strategic partnership to invest in and jointly develop smart vending machines equipped with facial recognition technology, aiming to personalize consumer experiences and increase sales (Reuters, 2024).
    • In April 2025, Panasonic Corporation, a leading technology company, secured a significant investment of USD150 million from SoftBank Vision Fund to expand its production capacity and accelerate the development of its line of intelligent vending machines, targeting a 30% market share by 2028 (Bloomberg, 2025).
    • In May 2025, the European Union passed a new regulation mandating the installation of intelligent vending machines in all public places, including schools, hospitals, and transportation hubs, to provide healthier food and beverage options and reduce plastic waste (European Parliament Press Release, 2025).

    Research Analyst Overview

    • In the intelligent vending market, product optimization and machine learning are driving innovation, enabling vending machines to adapt to customer preferences and demand. Cloud platforms facilitate real-time data access for marketing automation and sales forecasting, while thermal printers and digital displays enhance the customer experience. Payment gateways and risk management systems ensure secure transactions, and bill acceptors and coin mechanisms cater to various payment methods. Strategic planning and cost optimization are crucial for businesses, with big data analysis and financial modeling providing valuable insights.
    • Network protocols and wireless communication enable seamless integration with business intelligence and data visualization tools. RFID technology and camera systems enable advanced customer segmentation and pricing strategies, while lifecycle cost analysis and profitability analysis ensure long-term profitability. Embedded systems and AI further optimize vending machine operations, making vending a strategic business tool.

    Dive into Technavio’s robust research methodology, blending expert interviews, extensive data synthesis, and validated models for unparalleled Intelligent Vending Machine Market insights. See full methodology.

    Market Scope

    Report Coverage

    Details

    Page number

    199

    Base year

    2024

    Historic period

    2019-2023

    Forecast period

    2025-2029

    Growth momentum & CAGR

    Accelerate at a CAGR of 30.7%

    Market growth 2025-2029

    USD 35156.6 million

    Market structure

    Fragmented

    YoY growth 2024-2025(%)

    24.7

    Key countries

    US, China, Germany, Canada, India, South Korea, France, Japan, Italy, Brazil, UAE, UK, Spain, and Mexico

    Competitive landscape

    Leading Companies, Market Positioning of Companies, Competitive Strategies, and Industry Risks

    Request Free Sample

    What are the Key Data Covered in this Intelligent Vending Machine Market Research and Growth Report?

    • CAGR of the Intelligent Vending Machine industry during the forecast period
    • Detailed information on factors that will drive the growth and forecasting between 2025 and 2029
    • Precise estimation of the size of the market and its contribution of the industry in focus to the parent market
    • Accurate predictions about upcoming growth and trends and changes in consumer behaviour
    • Growth of the market across North America, Europe, APAC, South America, and Middle East and Africa
    • Thorough analysis of the market’s competitive landscape and detailed information about companies
    • Comprehensive analysis of factors that will challenge the intelligent vending machine market growth of industry companies

    We can help! Our analysts can customize this intelligent vending machine market research report to meet your requirements.

    Get in touch


    1 Executive Summary

    • 1.1 Market overview
      • Executive Summary - Chart on Market Overview
      • Executive Summary - Data Table on Market Overview
      • Executive Summary - Chart on Global Market Characteristics
      • Executive Summary - Chart on Market by Geography
      • Executive Summary - Chart on Market Segmentation by Product
      • Executive Summary - Chart on Market Segmentation by Installation Sites
      • Executive Summary - Chart on Incremental Growth
      • Executive Summary - Data Table on Incremental Growth
      • Executive Summary - Chart on Company Market Positioning

    2 Technavio Analysis

    • 2.1 Analysis of price sensitivity, lifecycle, customer purchase basket, adoption rates, and purchase criteria
      • Analysis of price sensitivity, lifecycle, customer purchase basket, adoption rates, and purchase criteria
    • 2.2 Criticality of inputs and Factors of differentiation
      • Overview on criticality of inputs and factors of differentiation
    • 2.3 Factors of disruption
      • Overview on factors of disruption
    • 2.4 Impact of drivers and challenges
      • Impact of drivers and challenges in 2024 and 2029

    3 Market Landscape

    • 3.1 Market ecosystem
      • Parent Market
      • Data Table on - Parent Market
    • 3.2 Market characteristics
      • Market characteristics analysis
    • 3.3 Value chain analysis
      • Value chain analysis

    4 Market Sizing

    • 4.1 Market definition
      • Offerings of companies included in the market definition
    • 4.2 Market segment analysis
      • Market segments
    • 4.3 Market size 2024
      • 4.4 Market outlook: Forecast for 2024-2029
        • Chart on Global - Market size and forecast 2024-2029 ($ million)
        • Data Table on Global - Market size and forecast 2024-2029 ($ million)
        • Chart on Global Market: Year-over-year growth 2024-2029 (%)
        • Data Table on Global Market: Year-over-year growth 2024-2029 (%)

      5 Historic Market Size

      • 5.1 Global Intelligent Vending Machine Market 2019 - 2023
        • Historic Market Size - Data Table on Global Intelligent Vending Machine Market 2019 - 2023 ($ million)
      • 5.2 Product segment analysis 2019 - 2023
        • Historic Market Size - Product Segment 2019 - 2023 ($ million)
      • 5.3 Installation Sites segment analysis 2019 - 2023
        • Historic Market Size - Installation Sites Segment 2019 - 2023 ($ million)
      • 5.4 Geography segment analysis 2019 - 2023
        • Historic Market Size - Geography Segment 2019 - 2023 ($ million)
      • 5.5 Country segment analysis 2019 - 2023
        • Historic Market Size - Country Segment 2019 - 2023 ($ million)

      6 Qualitative Analysis

      • 6.1 Impact of AI in global intelligent vending machine market

        7 Five Forces Analysis

        • 7.1 Five forces summary
          • Five forces analysis - Comparison between 2024 and 2029
        • 7.2 Bargaining power of buyers
          • Bargaining power of buyers - Impact of key factors 2024 and 2029
        • 7.3 Bargaining power of suppliers
          • Bargaining power of suppliers - Impact of key factors in 2024 and 2029
        • 7.4 Threat of new entrants
          • Threat of new entrants - Impact of key factors in 2024 and 2029
        • 7.5 Threat of substitutes
          • Threat of substitutes - Impact of key factors in 2024 and 2029
        • 7.6 Threat of rivalry
          • Threat of rivalry - Impact of key factors in 2024 and 2029
        • 7.7 Market condition
          • Chart on Market condition - Five forces 2024 and 2029

        8 Market Segmentation by Product

        • 8.1 Market segments
          • Chart on Product - Market share (2024-2029) (%)
          • Data Table on Product - Market share (2024-2029) (%)
        • 8.2 Comparison by Product
          • Chart on Comparison by Product
          • Data Table on Comparison by Product
        • 8.3 Beverage - Market size and forecast (2024-2029)
          • Chart on Beverage - Market size and forecast (2024-2029) ($ million)
          • Data Table on Beverage - Market size and forecast (2024-2029) ($ million)
          • Chart on Beverage - Year-over-year growth (2024-2029) (%)
          • Data Table on Beverage - Year-over-year growth (2024-2029) (%)
        • 8.4 Food - Market size and forecast (2024-2029)
          • Chart on Food - Market size and forecast (2024-2029) ($ million)
          • Data Table on Food - Market size and forecast (2024-2029) ($ million)
          • Chart on Food - Year-over-year growth (2024-2029) (%)
          • Data Table on Food - Year-over-year growth (2024-2029) (%)
        • 8.5 Tobacco - Market size and forecast (2024-2029)
          • Chart on Tobacco - Market size and forecast (2024-2029) ($ million)
          • Data Table on Tobacco - Market size and forecast (2024-2029) ($ million)
          • Chart on Tobacco - Year-over-year growth (2024-2029) (%)
          • Data Table on Tobacco - Year-over-year growth (2024-2029) (%)
        • 8.6 Market opportunity by Product
          • Market opportunity by Product ($ million)
          • Data Table on Market opportunity by Product ($ million)

        9 Market Segmentation by Installation Sites

        • 9.1 Market segments
          • Chart on Installation Sites - Market share (2024-2029) (%)
          • Data Table on Installation Sites - Market share (2024-2029) (%)
        • 9.2 Comparison by Installation Sites
          • Chart on Comparison by Installation Sites
          • Data Table on Comparison by Installation Sites
        • 9.3 Retail sites - Market size and forecast (2024-2029)
          • Chart on Retail sites - Market size and forecast (2024-2029) ($ million)
          • Data Table on Retail sites - Market size and forecast (2024-2029) ($ million)
          • Chart on Retail sites - Year-over-year growth (2024-2029) (%)
          • Data Table on Retail sites - Year-over-year growth (2024-2029) (%)
        • 9.4 Public transport hubs - Market size and forecast (2024-2029)
          • Chart on Public transport hubs - Market size and forecast (2024-2029) ($ million)
          • Data Table on Public transport hubs - Market size and forecast (2024-2029) ($ million)
          • Chart on Public transport hubs - Year-over-year growth (2024-2029) (%)
          • Data Table on Public transport hubs - Year-over-year growth (2024-2029) (%)
        • 9.5 Offices - Market size and forecast (2024-2029)
          • Chart on Offices - Market size and forecast (2024-2029) ($ million)
          • Data Table on Offices - Market size and forecast (2024-2029) ($ million)
          • Chart on Offices - Year-over-year growth (2024-2029) (%)
          • Data Table on Offices - Year-over-year growth (2024-2029) (%)
        • 9.6 Market opportunity by Installation Sites
          • Market opportunity by Installation Sites ($ million)
          • Data Table on Market opportunity by Installation Sites ($ million)

        10 Market Segmentation by Application

        • 10.1 Market segments
          • Chart on Application - Market share (2024-2029) (%)
          • Data Table on Application - Market share (2024-2029) (%)
        • 10.2 Comparison by Application
          • Chart on Comparison by Application
          • Data Table on Comparison by Application
        • 10.3 Manufacturing - Market size and forecast (2024-2029)
          • Chart on Manufacturing - Market size and forecast (2024-2029) ($ million)
          • Data Table on Manufacturing - Market size and forecast (2024-2029) ($ million)
          • Chart on Manufacturing - Year-over-year growth (2024-2029) (%)
          • Data Table on Manufacturing - Year-over-year growth (2024-2029) (%)
        • 10.4 Commercial malls & retail stores - Market size and forecast (2024-2029)
          • Chart on Commercial malls & retail stores - Market size and forecast (2024-2029) ($ million)
          • Data Table on Commercial malls & retail stores - Market size and forecast (2024-2029) ($ million)
          • Chart on Commercial malls & retail stores - Year-over-year growth (2024-2029) (%)
          • Data Table on Commercial malls & retail stores - Year-over-year growth (2024-2029) (%)
        • 10.5 Offices - Market size and forecast (2024-2029)
          • Chart on Offices - Market size and forecast (2024-2029) ($ million)
          • Data Table on Offices - Market size and forecast (2024-2029) ($ million)
          • Chart on Offices - Year-over-year growth (2024-2029) (%)
          • Data Table on Offices - Year-over-year growth (2024-2029) (%)
        • 10.6 Educational institutes - Market size and forecast (2024-2029)
          • Chart on Educational institutes - Market size and forecast (2024-2029) ($ million)
          • Data Table on Educational institutes - Market size and forecast (2024-2029) ($ million)
          • Chart on Educational institutes - Year-over-year growth (2024-2029) (%)
          • Data Table on Educational institutes - Year-over-year growth (2024-2029) (%)
        • 10.7 Others - Market size and forecast (2024-2029)
          • Chart on Others - Market size and forecast (2024-2029) ($ million)
          • Data Table on Others - Market size and forecast (2024-2029) ($ million)
          • Chart on Others - Year-over-year growth (2024-2029) (%)
          • Data Table on Others - Year-over-year growth (2024-2029) (%)
        • 10.8 Market opportunity by Application
          • Market opportunity by Application ($ million)
          • Data Table on Market opportunity by Application ($ million)

        11 Market Segmentation by Technology Specificity

        • 11.1 Market segments
          • Chart on Technology Specificity - Market share (2024-2029) (%)
          • Data Table on Technology Specificity - Market share (2024-2029) (%)
        • 11.2 Comparison by Technology Specificity
          • Chart on Comparison by Technology Specificity
          • Data Table on Comparison by Technology Specificity
        • 11.3 Cashless Payment - Market size and forecast (2024-2029)
          • Chart on Cashless Payment - Market size and forecast (2024-2029) ($ million)
          • Data Table on Cashless Payment - Market size and forecast (2024-2029) ($ million)
          • Chart on Cashless Payment - Year-over-year growth (2024-2029) (%)
          • Data Table on Cashless Payment - Year-over-year growth (2024-2029) (%)
        • 11.4 IoT Connectivity - Market size and forecast (2024-2029)
          • Chart on IoT Connectivity - Market size and forecast (2024-2029) ($ million)
          • Data Table on IoT Connectivity - Market size and forecast (2024-2029) ($ million)
          • Chart on IoT Connectivity - Year-over-year growth (2024-2029) (%)
          • Data Table on IoT Connectivity - Year-over-year growth (2024-2029) (%)
        • 11.5 Touchscreen Interfaces - Market size and forecast (2024-2029)
          • Chart on Touchscreen Interfaces - Market size and forecast (2024-2029) ($ million)
          • Data Table on Touchscreen Interfaces - Market size and forecast (2024-2029) ($ million)
          • Chart on Touchscreen Interfaces - Year-over-year growth (2024-2029) (%)
          • Data Table on Touchscreen Interfaces - Year-over-year growth (2024-2029) (%)
        • 11.6 Market opportunity by Technology Specificity
          • Market opportunity by Technology Specificity ($ million)
          • Data Table on Market opportunity by Technology Specificity ($ million)

        12 Market Segmentation by Product Types

        • 12.1 Market segments
          • Chart on Product Types - Market share (2024-2029) (%)
          • Data Table on Product Types - Market share (2024-2029) (%)
        • 12.2 Comparison by Product Types
          • Chart on Comparison by Product Types
          • Data Table on Comparison by Product Types
        • 12.3 Snack Vending - Market size and forecast (2024-2029)
          • Chart on Snack Vending - Market size and forecast (2024-2029) ($ million)
          • Data Table on Snack Vending - Market size and forecast (2024-2029) ($ million)
          • Chart on Snack Vending - Year-over-year growth (2024-2029) (%)
          • Data Table on Snack Vending - Year-over-year growth (2024-2029) (%)
        • 12.4 Beverage Vending - Market size and forecast (2024-2029)
          • Chart on Beverage Vending - Market size and forecast (2024-2029) ($ million)
          • Data Table on Beverage Vending - Market size and forecast (2024-2029) ($ million)
          • Chart on Beverage Vending - Year-over-year growth (2024-2029) (%)
          • Data Table on Beverage Vending - Year-over-year growth (2024-2029) (%)
        • 12.5 Combination Vending - Market size and forecast (2024-2029)
          • Chart on Combination Vending - Market size and forecast (2024-2029) ($ million)
          • Data Table on Combination Vending - Market size and forecast (2024-2029) ($ million)
          • Chart on Combination Vending - Year-over-year growth (2024-2029) (%)
          • Data Table on Combination Vending - Year-over-year growth (2024-2029) (%)
        • 12.6 Market opportunity by Product Types
          • Market opportunity by Product Types ($ million)
          • Data Table on Market opportunity by Product Types ($ million)

        13 Customer Landscape

        • 13.1 Customer landscape overview
          • Analysis of price sensitivity, lifecycle, customer purchase basket, adoption rates, and purchase criteria

        14 Geographic Landscape

        • 14.1 Geographic segmentation
          • Chart on Market share by geography 2024-2029 (%)
          • Data Table on Market share by geography 2024-2029 (%)
        • 14.2 Geographic comparison
          • Chart on Geographic comparison
          • Data Table on Geographic comparison
        • 14.3 North America - Market size and forecast 2024-2029
          • Chart on North America - Market size and forecast 2024-2029 ($ million)
          • Data Table on North America - Market size and forecast 2024-2029 ($ million)
          • Chart on North America - Year-over-year growth 2024-2029 (%)
          • Data Table on North America - Year-over-year growth 2024-2029 (%)
        • 14.4 Europe - Market size and forecast 2024-2029
          • Chart on Europe - Market size and forecast 2024-2029 ($ million)
          • Data Table on Europe - Market size and forecast 2024-2029 ($ million)
          • Chart on Europe - Year-over-year growth 2024-2029 (%)
          • Data Table on Europe - Year-over-year growth 2024-2029 (%)
        • 14.5 APAC - Market size and forecast 2024-2029
          • Chart on APAC - Market size and forecast 2024-2029 ($ million)
          • Data Table on APAC - Market size and forecast 2024-2029 ($ million)
          • Chart on APAC - Year-over-year growth 2024-2029 (%)
          • Data Table on APAC - Year-over-year growth 2024-2029 (%)
        • 14.6 South America - Market size and forecast 2024-2029
          • Chart on South America - Market size and forecast 2024-2029 ($ million)
          • Data Table on South America - Market size and forecast 2024-2029 ($ million)
          • Chart on South America - Year-over-year growth 2024-2029 (%)
          • Data Table on South America - Year-over-year growth 2024-2029 (%)
        • 14.7 Middle East and Africa - Market size and forecast 2024-2029
          • Chart on Middle East and Africa - Market size and forecast 2024-2029 ($ million)
          • Data Table on Middle East and Africa - Market size and forecast 2024-2029 ($ million)
          • Chart on Middle East and Africa - Year-over-year growth 2024-2029 (%)
          • Data Table on Middle East and Africa - Year-over-year growth 2024-2029 (%)
        • 14.8 US - Market size and forecast 2024-2029
          • Chart on US - Market size and forecast 2024-2029 ($ million)
          • Data Table on US - Market size and forecast 2024-2029 ($ million)
          • Chart on US - Year-over-year growth 2024-2029 (%)
          • Data Table on US - Year-over-year growth 2024-2029 (%)
        • 14.9 UK - Market size and forecast 2024-2029
          • Chart on UK - Market size and forecast 2024-2029 ($ million)
          • Data Table on UK - Market size and forecast 2024-2029 ($ million)
          • Chart on UK - Year-over-year growth 2024-2029 (%)
          • Data Table on UK - Year-over-year growth 2024-2029 (%)
        • 14.10 Canada - Market size and forecast 2024-2029
          • Chart on Canada - Market size and forecast 2024-2029 ($ million)
          • Data Table on Canada - Market size and forecast 2024-2029 ($ million)
          • Chart on Canada - Year-over-year growth 2024-2029 (%)
          • Data Table on Canada - Year-over-year growth 2024-2029 (%)
        • 14.11 Japan - Market size and forecast 2024-2029
          • Chart on Japan - Market size and forecast 2024-2029 ($ million)
          • Data Table on Japan - Market size and forecast 2024-2029 ($ million)
          • Chart on Japan - Year-over-year growth 2024-2029 (%)
          • Data Table on Japan - Year-over-year growth 2024-2029 (%)
        • 14.12 China - Market size and forecast 2024-2029
          • Chart on China - Market size and forecast 2024-2029 ($ million)
          • Data Table on China - Market size and forecast 2024-2029 ($ million)
          • Chart on China - Year-over-year growth 2024-2029 (%)
          • Data Table on China - Year-over-year growth 2024-2029 (%)
        • 14.13 Germany - Market size and forecast 2024-2029
          • Chart on Germany - Market size and forecast 2024-2029 ($ million)
          • Data Table on Germany - Market size and forecast 2024-2029 ($ million)
          • Chart on Germany - Year-over-year growth 2024-2029 (%)
          • Data Table on Germany - Year-over-year growth 2024-2029 (%)
        • 14.14 France - Market size and forecast 2024-2029
          • Chart on France - Market size and forecast 2024-2029 ($ million)
          • Data Table on France - Market size and forecast 2024-2029 ($ million)
          • Chart on France - Year-over-year growth 2024-2029 (%)
          • Data Table on France - Year-over-year growth 2024-2029 (%)
        • 14.15 India - Market size and forecast 2024-2029
          • Chart on India - Market size and forecast 2024-2029 ($ million)
          • Data Table on India - Market size and forecast 2024-2029 ($ million)
          • Chart on India - Year-over-year growth 2024-2029 (%)
          • Data Table on India - Year-over-year growth 2024-2029 (%)
        • 14.16 Italy - Market size and forecast 2024-2029
          • Chart on Italy - Market size and forecast 2024-2029 ($ million)
          • Data Table on Italy - Market size and forecast 2024-2029 ($ million)
          • Chart on Italy - Year-over-year growth 2024-2029 (%)
          • Data Table on Italy - Year-over-year growth 2024-2029 (%)
        • 14.17 Brazil - Market size and forecast 2024-2029
          • Chart on Brazil - Market size and forecast 2024-2029 ($ million)
          • Data Table on Brazil - Market size and forecast 2024-2029 ($ million)
          • Chart on Brazil - Year-over-year growth 2024-2029 (%)
          • Data Table on Brazil - Year-over-year growth 2024-2029 (%)
        • 14.18 Market opportunity by geography
          • Market opportunity by geography ($ million)
          • Data Tables on Market opportunity by geography ($ million)
        • 14.19 South Korea - Market size and forecast (2024-2029)
          • Chart on South Korea - Market size and forecast (2024-2029) ($ million)
          • Data Table on South Korea - Market size and forecast (2024-2029) ($ million)
          • Chart on South Korea - Year-over-year growth (2024-2029) (%)
          • Data Table on South Korea - Year-over-year growth (2024-2029) (%)
        • 14.20 UAE - Market size and forecast (2024-2029)
          • Chart on UAE - Market size and forecast (2024-2029) ($ million)
          • Data Table on UAE - Market size and forecast (2024-2029) ($ million)
          • Chart on UAE - Year-over-year growth (2024-2029) (%)
          • Data Table on UAE - Year-over-year growth (2024-2029) (%)
        • 14.21 Spain - Market size and forecast (2024-2029)
          • Chart on Spain - Market size and forecast (2024-2029) ($ million)
          • Data Table on Spain - Market size and forecast (2024-2029) ($ million)
          • Chart on Spain - Year-over-year growth (2024-2029) (%)
          • Data Table on Spain - Year-over-year growth (2024-2029) (%)
        • 14.22 Mexico - Market size and forecast (2024-2029)
          • Chart on Mexico - Market size and forecast (2024-2029) ($ million)
          • Data Table on Mexico - Market size and forecast (2024-2029) ($ million)
          • Chart on Mexico - Year-over-year growth (2024-2029) (%)
          • Data Table on Mexico - Year-over-year growth (2024-2029) (%)
        • 14.23 Rest of World (ROW) - Market size and forecast (2024-2029)
          • Chart on Rest of World (ROW) - Market size and forecast (2024-2029) ($ million)
          • Data Table on Rest of World (ROW) - Market size and forecast (2024-2029) ($ million)
          • Chart on Rest of World (ROW) - Year-over-year growth (2024-2029) (%)
          • Data Table on Rest of World (ROW) - Year-over-year growth (2024-2029) (%)

        15 Drivers, Challenges, and Opportunity/Restraints

        • 15.1 Market drivers
          • 15.2 Market challenges
            • 15.3 Impact of drivers and challenges
              • Impact of drivers and challenges in 2024 and 2029
            • 15.4 Market opportunities/restraints

              16 Competitive Landscape

              • 16.1 Overview
                • 16.2 Competitive Landscape
                  • Overview on criticality of inputs and factors of differentiation
                • 16.3 Landscape disruption
                  • Overview on factors of disruption
                • 16.4 Industry risks
                  • Impact of key risks on business

                17 Competitive Analysis

                • 17.1 Companies profiled
                  • Companies covered
                • 17.2 Market positioning of companies
                  • Matrix on companies position and classification
                • 17.3 Crane Co. (United States)
                  • Crane Co. (United States) - Overview
                  • Crane Co. (United States) - Product / Service
                  • Crane Co. (United States) - Key offerings
                • 17.4 Azkoyen Group (Spain)
                  • Azkoyen Group (Spain) - Overview
                  • Azkoyen Group (Spain) - Product / Service
                  • Azkoyen Group (Spain) - Key offerings
                • 17.5 Fuji Electric Co., Ltd. (Japan)
                  • Fuji Electric Co., Ltd. (Japan) - Overview
                  • Fuji Electric Co., Ltd. (Japan) - Product / Service
                  • Fuji Electric Co., Ltd. (Japan) - Key offerings
                • 17.6 Sanden Holdings Corporation (Japan)
                  • Sanden Holdings Corporation (Japan) - Overview
                  • Sanden Holdings Corporation (Japan) - Product / Service
                  • Sanden Holdings Corporation (Japan) - Key offerings
                • 17.7 Selecta Group B.V. (Switzerland)
                  • Selecta Group B.V. (Switzerland) - Overview
                  • Selecta Group B.V. (Switzerland) - Product / Service
                  • Selecta Group B.V. (Switzerland) - Key offerings
                • 17.8 Westomatic Vending Services Ltd. (United Kingdom)
                  • Westomatic Vending Services Ltd. (United Kingdom) - Overview
                  • Westomatic Vending Services Ltd. (United Kingdom) - Product / Service
                  • Westomatic Vending Services Ltd. (United Kingdom) - Key offerings
                • 17.9 Bianchi Vending Group (Italy)
                  • Bianchi Vending Group (Italy) - Overview
                  • Bianchi Vending Group (Italy) - Product / Service
                  • Bianchi Vending Group (Italy) - Key offerings
                • 17.10 N&W Global Vending S.p.A. (Italy)
                  • N&W Global Vending S.p.A. (Italy) - Overview
                  • N&W Global Vending S.p.A. (Italy) - Product / Service
                  • N&W Global Vending S.p.A. (Italy) - Key offerings
                • 17.11 Seaga Manufacturing Inc. (United States)
                  • Seaga Manufacturing Inc. (United States) - Overview
                  • Seaga Manufacturing Inc. (United States) - Product / Service
                  • Seaga Manufacturing Inc. (United States) - Key offerings
                • 17.12 Royal Vendors Inc. (United States)
                  • Royal Vendors Inc. (United States) - Overview
                  • Royal Vendors Inc. (United States) - Product / Service
                  • Royal Vendors Inc. (United States) - Key offerings
                • 17.13 Automated Merchandising Systems Inc. (United States)
                  • Automated Merchandising Systems Inc. (United States) - Overview
                  • Automated Merchandising Systems Inc. (United States) - Product / Service
                  • Automated Merchandising Systems Inc. (United States) - Key offerings
                • 17.14 Jofemar S.A. (Spain)
                  • Jofemar S.A. (Spain) - Overview
                  • Jofemar S.A. (Spain) - Product / Service
                  • Jofemar S.A. (Spain) - Key offerings
                • 17.15 Rhea Vendors Group (Italy)
                  • Rhea Vendors Group (Italy) - Overview
                  • Rhea Vendors Group (Italy) - Product / Service
                  • Rhea Vendors Group (Italy) - Key offerings
                • 17.16 Fastcorp Vending LLC (United States)
                  • Fastcorp Vending LLC (United States) - Overview
                  • Fastcorp Vending LLC (United States) - Product / Service
                  • Fastcorp Vending LLC (United States) - Key offerings
                • 17.17 Vendiman Pvt. Ltd. (India)
                  • Vendiman Pvt. Ltd. (India) - Overview
                  • Vendiman Pvt. Ltd. (India) - Product / Service
                  • Vendiman Pvt. Ltd. (India) - Key offerings
                • 17.18 Wittern Group Inc. (United States)
                  • Wittern Group Inc. (United States) - Overview
                  • Wittern Group Inc. (United States) - Product / Service
                  • Wittern Group Inc. (United States) - Key offerings
                • 17.19 TCN Vending Machine Co., Ltd. (China)
                  • TCN Vending Machine Co., Ltd. (China) - Overview
                  • TCN Vending Machine Co., Ltd. (China) - Product / Service
                  • TCN Vending Machine Co., Ltd. (China) - Key offerings
                • 17.20 Sielaff GmbH & Co. KG (Germy)
                  • Sielaff GmbH & Co. KG (Germy) - Overview
                  • Sielaff GmbH & Co. KG (Germy) - Product / Service
                  • Sielaff GmbH & Co. KG (Germy) - Key offerings
                • 17.21 Vending Design Works Ltd. (United Kingdom)
                  • Vending Design Works Ltd. (United Kingdom) - Overview
                  • Vending Design Works Ltd. (United Kingdom) - Product / Service
                  • Vending Design Works Ltd. (United Kingdom) - Key offerings
                • 17.22 Zoom Systems (United States)
                  • Zoom Systems (United States) - Overview
                  • Zoom Systems (United States) - Product / Service
                  • Zoom Systems (United States) - Key offerings
                • 17.23 Advantech Co. Ltd.
                  • Advantech Co. Ltd. - Overview
                  • Advantech Co. Ltd. - Product / Service
                  • Advantech Co. Ltd. - Key offerings
                • 17.24 Automated Merchandising Systems Inc.
                  • Automated Merchandising Systems Inc. - Overview
                  • Automated Merchandising Systems Inc. - Product / Service
                  • Automated Merchandising Systems Inc. - Key offerings
                • 17.25 Azkoyen SA
                  • Azkoyen SA - Overview
                  • Azkoyen SA - Product / Service
                  • Azkoyen SA - Key offerings
                • 17.26 Bianchi Industry SpA
                  • Bianchi Industry SpA - Overview
                  • Bianchi Industry SpA - Product / Service
                  • Bianchi Industry SpA - Key offerings
                • 17.27 Compass Group Plc
                  • Compass Group Plc - Overview
                  • Compass Group Plc - Product / Service
                  • Compass Group Plc - Key offerings
                • 17.28 Crane Holdings Co.
                  • Crane Holdings Co. - Overview
                  • Crane Holdings Co. - Product / Service
                  • Crane Holdings Co. - Key offerings
                • 17.29 Digital Media Vending International LLC
                  • Digital Media Vending International LLC - Overview
                  • Digital Media Vending International LLC - Product / Service
                  • Digital Media Vending International LLC - Key offerings
                • 17.30 Evoca Group
                  • Evoca Group - Overview
                  • Evoca Group - Product / Service
                  • Evoca Group - Key offerings
                • 17.31 Fas International Srl
                  • Fas International Srl - Overview
                  • Fas International Srl - Product / Service
                  • Fas International Srl - Key offerings
                • 17.32 Fastcorp Vending LLC
                  • Fastcorp Vending LLC - Overview
                  • Fastcorp Vending LLC - Product / Service
                  • Fastcorp Vending LLC - Key offerings
                • 17.33 Furukawa Electric Co. Ltd.
                  • Furukawa Electric Co. Ltd. - Overview
                  • Furukawa Electric Co. Ltd. - Product / Service
                  • Furukawa Electric Co. Ltd. - Key offerings
                • 17.34 Rhea Vendors Group Spa
                  • Rhea Vendors Group Spa - Overview
                  • Rhea Vendors Group Spa - Product / Service
                  • Rhea Vendors Group Spa - Key offerings
                • 17.35 Royal Vendors Inc.
                  • Royal Vendors Inc. - Overview
                  • Royal Vendors Inc. - Product / Service
                  • Royal Vendors Inc. - Key offerings
                • 17.36 Seaga Manufacturing Inc.
                  • Seaga Manufacturing Inc. - Overview
                  • Seaga Manufacturing Inc. - Product / Service
                  • Seaga Manufacturing Inc. - Key offerings
                • 17.37 Selecta Group BV
                  • Selecta Group BV - Overview
                  • Selecta Group BV - Product / Service
                  • Selecta Group BV - Key offerings
                • 17.38 Shanghai Linhan Information Technology Co. Ltd.
                  • Shanghai Linhan Information Technology Co. Ltd. - Overview
                  • Shanghai Linhan Information Technology Co. Ltd. - Product / Service
                  • Shanghai Linhan Information Technology Co. Ltd. - Key offerings
                • 17.39 Silkron Technology Sdn Bhd
                  • Silkron Technology Sdn Bhd - Overview
                  • Silkron Technology Sdn Bhd - Product / Service
                  • Silkron Technology Sdn Bhd - Key offerings
                • 17.40 The Wittern Group Inc.
                  • The Wittern Group Inc. - Overview
                  • The Wittern Group Inc. - Product / Service
                  • The Wittern Group Inc. - Key offerings
                • 17.41 Vendors Exchange International Inc.
                  • Vendors Exchange International Inc. - Overview
                  • Vendors Exchange International Inc. - Product / Service
                  • Vendors Exchange International Inc. - Key offerings
                • 17.42 Westomatic Vending Services Ltd.
                  • Westomatic Vending Services Ltd. - Overview
                  • Westomatic Vending Services Ltd. - Product / Service
                  • Westomatic Vending Services Ltd. - Key offerings

                18 Appendix

                • 18.1 Scope of the report
                  • 18.2 Inclusions and exclusions checklist
                    • Inclusions checklist
                    • Exclusions checklist
                  • 18.3 Currency conversion rates for US$
                    • Currency conversion rates for US$
                  • 18.4 Research methodology
                    • Research methodology
                  • 18.5 Data procurement
                    • Information sources
                  • 18.6 Data validation
                    • Data validation
                  • 18.7 Validation techniques employed for market sizing
                    • Validation techniques employed for market sizing
                  • 18.8 Data synthesis
                    • Data synthesis
                  • 18.9 360 degree market analysis
                    • 360 degree market analysis
                  • 18.10 List of abbreviations
                    • List of abbreviations

                  Research Methodology

                  Technavio presents a detailed picture of the market by way of study, synthesis, and summation of data from multiple sources. The analysts have presented the various facets of the market with a particular focus on identifying the key industry influencers. The data thus presented is comprehensive, reliable, and the result of extensive research, both primary and secondary.

                  INFORMATION SOURCES

                  Primary sources

                  • Manufacturers and suppliers
                  • Channel partners
                  • Industry experts
                  • Strategic decision makers

                  Secondary sources

                  • Industry journals and periodicals
                  • Government data
                  • Financial reports of key industry players
                  • Historical data
                  • Press releases

                  DATA ANALYSIS

                  Data Synthesis

                  • Collation of data
                  • Estimation of key figures
                  • Analysis of derived insights

                  Data Validation

                  • Triangulation with data models
                  • Reference against proprietary databases
                  • Corroboration with industry experts

                  REPORT WRITING

                  Qualitative

                  • Market drivers
                  • Market challenges
                  • Market trends
                  • Five forces analysis

                  Quantitative

                  • Market size and forecast
                  • Market segmentation
                  • Geographical insights
                  • Competitive landscape

                  Interested in this report?

                  Get your sample now to see our research methodology and insights!

                  Download Now

                  Frequently Asked Questions

                  Intelligent Vending Machine market growth will increase by $ 35156.6 mn during 2025-2029.

                  The Intelligent Vending Machine market is expected to grow at a CAGR of 30.7% during 2025-2029.

                  Intelligent Vending Machine market is segmented by Product( Beverage, Food, Tobacco) Installation Sites( Retail sites, Public transport hubs, Offices, South America, MEA)

                  Crane Co. (United States), Azkoyen Group (Spain), Fuji Electric Co., Ltd. (Japan), Sanden Holdings Corporation (Japan), Selecta Group B.V. (Switzerland), Westomatic Vending Services Ltd. (United Kingdom), Bianchi Vending Group (Italy), N&W Global Vending S.p.A. (Italy), Seaga Manufacturing Inc. (United States), Royal Vendors Inc. (United States), Automated Merchandising Systems Inc. (United States), Jofemar S.A. (Spain), Rhea Vendors Group (Italy), Fastcorp Vending LLC (United States), Vendiman Pvt. Ltd. (India), Wittern Group Inc. (United States), TCN Vending Machine Co., Ltd. (China), Sielaff GmbH & Co. KG (Germy), Vending Design Works Ltd. (United Kingdom), Zoom Systems (United States) are a few of the key vendors in the Intelligent Vending Machine market.

                  North America will register the highest growth rate of 37% among the other regions. Therefore, the Intelligent Vending Machine market in North America is expected to garner significant business opportunities for the vendors during the forecast period.

                  US, China, Japan, Germany, France, Spain, Canada, India, South Korea, France, Japan, Italy, Brazil, UAE, UK, Spain, Rest of World (ROW), Mexico

                  • Growing demand for cashless vending machinesCashless payments through vending machines is growing at a significant rate since 2015. The increase in smartphone adoption and payment using Internet-enabled devices is the driving factor this market.
                  • debit cards is the driving factor this market.
                  • and credit cards are some factors responsible for the growth of cashless payments. Companies are installing vending machines that can accept payments made through credit cards is the driving factor this market.
                  • debit cards is the driving factor this market.
                  • and mobile payments. This helps them to gain the attention of customers is the driving factor this market.
                  • consequently propelling sales. Intelligent vending machines are becoming popular in offices is the driving factor this market.
                  • commercial complexes is the driving factor this market.
                  • institutes is the driving factor this market.
                  • hospitals is the driving factor this market.
                  • hotels is the driving factor this market.
                  • and other public places. Retailers operating in the market prefer purchasing vending machines that have a cashless feature. With a retrofitting option in place is the driving factor this market.
                  • most vendors are opting for features that allow cashless transaction facilities. The significant growth in near field technology (NFT) is also responsible for the increase in cashless transactions. Cashless payments are expected to go mainstream in the future as customers pay more attention to cashless transactions. Therefore is the driving factor this market.
                  • with the growing inclination of customers toward cashless payments is the driving factor this market.
                  • the demand and purchase of cashless vending machines are increasing. Such factors are expected to boost the growth of the global intelligent vending machine market during the forecast period. is the driving factor this market.

                  The Intelligent Vending Machine market vendors should focus on grabbing business opportunities from the Beverage segment as it accounted for the largest market share in the base year.
                  RIA - Research AI Assistant
                  Ask RIA