
What is the Intraocular Lens (Iols) Market Size ?
The intraocular lens market size is forecast to increase by USD 1.17 billion and is estimated to grow at a CAGR of 5.01% between 2023 and 2028. The market is experiencing significant growth due to the increasing prevalence of ophthalmic diseases and an aging population.This growth can be attributed to technological advances in IOL design and materials, such as presbyopic IOLs and multifocal IOLs, which offer improved vision quality and reduced dependence on glasses or contact lenses. Additionally, initiatives to create awareness about the benefits and advances in IOL technology are driving demand for these lenses. For instance, the American Academy of Ophthalmology's campaign "Focus on Eye Health" aims to educate the public about the importance of regular eye exams and the availability of advanced IOLs for cataract surgery. Overall, the IOL market is poised for continued growth due to these factors and the increasing need for vision correction solutions.
_Market_size_abstract_2024_v1.jpg)
Request Free Intraocular Lens (Iols) Market Sample
Market Segment
The market research report provides comprehensive data (region-wise segment analysis), with forecasts and estimates in "USD billion " for the period 2024-2028, as well as historical data from 2018-2022 for the following segments.
- Product Outlook
- Monofocal IOL
- Multifocal IOL
- Toric IOL
- Accommodating IOL
- End-user Outlook
- Hospitals
- Ophthalmic clinics
- Ambulatory surgery centers
- Region Outlook
- North America
- The U.S.
- Canada
- Europe
- U.K.
- Germany
- France
- Rest of Europe
- APAC
- China
- India
- Middle East & Africa
- Saudi Arabia
- South Africa
- Rest of the Middle East & Africa
- North America
Which is the Largest Segment Driving Market Growth?
The monofocal IOL segment is estimated to witness significant growth during the forecast period. Intraocular lenses (IOLs), specifically monofocal IOLs, play a crucial role in addressing vision impairment caused by cataracts and other age-related eye diseases, such as age-related macular degeneration, presbyopia, glaucoma, diabetic retinopathy, and refractive errors including myopia, hyperopia, and astigmatism.
_Market_segments_abstract_2024_v2.jpg)
Get a glance at the market share of various regions Download the PDF Sample
The monofocal IOL segment was the largest segment and valued at USD 1.42 billion in 2018. With an aging population, the demand for cataract surgery and IOL implantation is increasing. Minimally invasive surgeries have gained popularity, allowing skilled ophthalmologists to perform procedures with precision and accuracy. Monofocal IOLs are traditional lenses with a fixed focus for either near or distant vision. In cataract surgery, these lenses help adjust the focus of both eyes for distant objects, enabling patients to use reading glasses for near vision. Hence, such factors are fuelling the growth of this segment during the forecast period.
Which Region is Leading the Market?
_Market_regions_abstract_2023_geo_v2.jpg)
For more insights on the market share of various regions Request Free Sample
North America is estimated to contribute 33% to the growth of the global market during the forecast period. Technavio's analysts have elaborately explained the regional trends and drivers that shape the market during the forecast period. Intraocular lenses (IOLs) are medical devices implanted in the eye to replace the natural lens after cataract surgery. The market for IOLs encompasses various types, including multifocal and toric lenses. Multifocal IOLs provide both distance and near vision correction, while toric IOLs correct astigmatism. IOLs are predominantly made of polymethylmethacrylate (PMMA), a rigid material, but foldable, hydrophobic acrylic and hydrophilic acrylic lenses are also popular due to their ease of implantation. Silicone and collamer lenses are other materials used in IOL manufacturing. Speciality clinics specializing in ophthalmology and eye surgery drive the demand for these lenses. Hence, such factors are driving the market in North America during the forecast period.
How Technavio's company ranking index and market positioning comes to your aid?
Companies are implementing various strategies, such as strategic alliances, partnerships, mergers and acquisitions, geographical expansion, and product/service launches, to enhance their presence in the market.
Alcon Inc: The company offers intraocular lens such as AcrySof IQ Vivity IOL, AcrySof IQ PanOptix IOL, AcrySof IQ Monofocal IOL and AcrySof IQ Toric IOL, and Clareon Monofocal IOL and Clareon Toric IOL.
Technavio provides ranking index for the top 20 companies along with insights on market positioning of:
- Alcon Inc.
- Aurolab
- Bausch Lomb Corp.
- BVI Holdings Ltd.
- Carl Zeiss AG
- EyeKon Medical Inc.
- HOYA CORP.
- HumanOptics Holding AG
- Johnson and Johnson Services Inc.
- Lenstec Inc.
- NanoVision
- Omni Lens Pvt. Ltd.
- Ophtec BV
- Ophthalmic Solution INC.
- Rayner
- RxSight
- Santen Pharmaceutical Co. Ltd.
- SMR Ophthalmic Pvt. Ltd.
- STAAR Surgical Co.
Explore our company rankings and market positioning Request Free Sample
How can Technavio Assist you in Making Critical Decisions?
What is the market structure and year-over-year growth of the Intraocular Lens (Iols) Market?
|
Market structure |
Fragmented |
|
YoY growth 2023-2024 |
4.65 |
Market Dynamic
The market is a significant segment in the ophthalmic industry, driven by the increasing prevalence of cataracts and age-related eye diseases such as Age-related macular degeneration, Presbyopia, Glaucoma, Diabetic retinopathy, and Refractive errors. The market is witnessing growth due to the aging population, an increase in minimally invasive surgeries, and the availability of various types of IOLs like Monofocal, Premium (Multifocal and Toric), and Foldable IOLs made from Acrylic materials such as Polymethylmethacrylate, Hydrophobic acrylic, and Hydrophilic acrylic. The diabetic population also contributes to the market's growth due to the high prevalence of cataracts and other eye diseases. Patents and insurance plans are crucial factors influencing the market. IOLs are implanted during cataract surgery to restore vision impairment caused by the clouding of the natural lens. Conditions like Myopia and Hyperopia can also be corrected using IOLs. The market's growth is expected to continue due to the increasing demand for advanced IOLs and the rising number of contract surgeries in the elderly population. Our researchers analyzed the data with 2023 as the base year, along with the key drivers, trends, and challenges. A holistic analysis of drivers will help vendors refine their marketing strategies to gain a competitive advantage.
What is the Primary Factor Driving Market Growth?
Increasing prevalence of ophthalmic diseases is notably driving market growth. Intraocular lenses (IOLs) play a crucial role in addressing various eye conditions, particularly cataracts, which affect millions of people worldwide, especially those in the aging population. With an increasing number of age-related eye diseases such as age-related macular degeneration, presbyopia, and glaucoma, the demand for IOLs is surging.
Moreover, minimally invasive surgeries have gained popularity, enabling skilled ophthalmologists to perform cataract surgeries more efficiently and effectively. The market for IOLs is driven by patents, insurance plans, and the growing diabetic population. Monofocal IOLs, made of hydrophobic acrylic materials, are commonly used in cataract surgeries. However, the trend is shifting towards premium multifocal IOLs, which offer better vision correction for refractive errors such as myopia, hyperopia, and astigmatism. Thus, such factors are driving the growth of the market during the forecast period
What is the Significant Trends being Witnessed in the Market?
Increasing medical tourism for low-cost ophthalmic surgeries is the key trend in the market. Intraocular lenses (IOLs) play a crucial role in addressing various eye conditions, particularly cataracts, which affect millions of individuals, especially those in the aging population. With an increasing number of age-related eye diseases such as age-related macular degeneration, presbyopia, and glaucoma, the demand for IOLs is anticipated to surge.
Moreover, the market for IOLs is driven by the growing number of skilled ophthalmologists performing minimally invasive surgeries, reimbursement policies, and contract surgeries. The material segment, including hydrophobic acrylic IOLs and acrylic materials, dominates the market. Monofocal IOLs, which are commonly used in cataract surgery, account for a significant share. However, the trend is shifting towards premium multifocal IOLs, which offer improved vision for patients with refractive errors like myopia, hyperopia, and astigmatism. Hence, such factors are driving the market during the forecast period.
What is the Major Market Challenge?
Shortage of skilled ophthalmologists is the major challenge that affects the growth of the market. Intraocular lenses (IOLs) play a crucial role in addressing various eye conditions, particularly cataracts, which affect millions of people worldwide, especially those in the aging population. With an increasing number of age-related eye diseases such as age-related macular degeneration, presbyopia, and glaucoma, the demand for IOLs is surging.
Moreover, minimally invasive surgeries using skilled ophthalmologists have become the preferred choice for cataract surgery, leading to a higher adoption rate of premium IOLs like multifocal and toric IOLs. The material segment, including acrylic materials, dominates the IOL market. Reimbursement policies and insurance plans are essential factors influencing the market growth. Telemedicine and contract surgeries are emerging trends in the industry. The diabetic population, susceptible to diabetic retinopathy and refractive errors like myopia, hyperopia, and astigmatism, also contributes significantly to the market. Hence, such factors are hindering the market during the forecast period.
Exclusive Customer Landscape
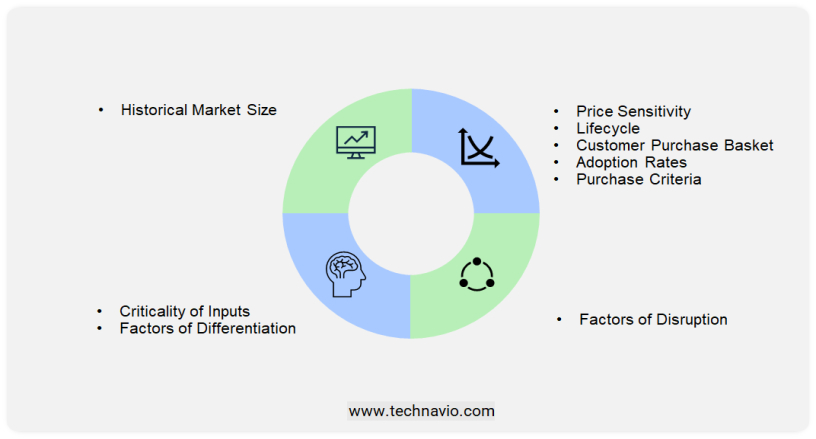
The market forecasting report includes the adoption lifecycle of the market, covering from the innovator's stage to the laggard's stage. It focuses on adoption rates in different regions based on penetration. Furthermore, the report also includes key purchase criteria and drivers of price sensitivity to help companies evaluate and develop their market growth analysis strategies.
_Market_customer_landscape_abstract_2023_geo_v1.jpg)
Customer Landscape
Market Analyst Overview
Addressing Vision Impairment from Cataracts and Age-Related Eye Diseases The Intraocular Lens (IOL) market is witnessing significant growth due to the increasing prevalence of cataracts and age-related eye diseases such as Age-related macular degeneration, Presbyopia, and Diabetic retinopathy. The aging population is a major contributor to this market as people above 60 years are more susceptible to cataracts surgery and other age-related eye conditions. Minimally invasive surgeries have gained popularity in recent years, leading to an increase in the number of cataract surgeries. Skilled ophthalmologists perform these surgeries using advanced IOLs like Monofocal IOLs, Hydrophobic Acrylic IOLs, and Optical IOLs.
Moreover, the material segment, primarily Acrylic materials, dominates the market due to their biocompatibility and durability. Reimbursement policies, insurance plans, and contract surgeries are key factors driving the market growth. Telemedicine is also playing a role in increasing accessibility to IOLs, especially in rural areas. The Diabetic population, which is at a higher risk of developing cataracts and other eye diseases, is another significant market driver. Multifocal IOLs, Toric intraocular lenses, and Premium IOLs are gaining popularity due to their ability to correct refractive errors like Myopia, Hyperopia, and Astigmatism. Hospitals, Ambulatory surgery centers, and Eye research institutes are the major end-users of IOLs. The market is expected to continue its growth trajectory due to the increasing vision impairment cases from cataracts, glaucoma, and other eye diseases.
|
Market Scope |
|
|
Report Coverage |
Details |
|
Page number |
186 |
|
Base year |
2023 |
|
Historic period |
2018-2022 |
|
Forecast period |
2024-2028 |
|
Growth momentum & CAGR |
Accelerate at a CAGR of 5.01% |
|
Market growth 2024-2028 |
USD 1174.1 million |
|
Regional analysis |
North America, Europe, Asia, and Rest of World (ROW) |
|
Performing market contribution |
North America at 33% |
|
Key countries |
US, China, Germany, UK, and Japan |
|
Competitive landscape |
Leading Companies, Market Positioning of Companies, Competitive Strategies, and Industry Risks |
|
Key companies profiled |
Alcon Inc., Aurolab, Bausch Lomb Corp., BVI Holdings Ltd., Carl Zeiss AG, EyeKon Medical Inc., HOYA CORP., HumanOptics Holding AG, Johnson and Johnson Services Inc., Lenstec Inc., NanoVision, Omni Lens Pvt. Ltd., Ophtec BV, Ophthalmic Solution INC., Rayner, RxSight, Santen Pharmaceutical Co. Ltd., SMR Ophthalmic Pvt. Ltd., and STAAR Surgical Co. |
|
Market dynamics |
Parent market analysis, Market growth inducers and obstacles, Fast-growing and slow-growing segment analysis, COVID-19 impact and recovery analysis and future consumer dynamics, Market condition analysis for forecast period |
|
Customization purview |
If our report has not included the data that you are looking for, you can reach out to our analysts and get segments customized. |
What are the Key Data Covered in this Market Research Report?
- CAGR of the market during the forecast period
- Detailed information on factors that will drive the market growth and forecasting between 2024 and 2028
- Precise estimation of the size of the market and its contribution of the market in focus to the parent market
- Accurate predictions about upcoming market growth and trends and changes in consumer behaviour
- Growth of the market across North America, Europe, Asia, and Rest of World (ROW)
- Thorough analysis of the market's competitive landscape and detailed information about companies
- Comprehensive analysis of factors that will challenge the growth of market companies
 RIA -
RIA - 
